MALDI MS analysis, disk diffusion and optical density measurements for the antimicrobial effect of zinc oxide nanorods integrated in graphene oxide nanostructures†
Mukesh Lavkush
Bhaisare
a,
Bo-Sgum
Wu
a,
Mon-Chun
Wu
b,
M. Shahnawaz
Khan
c,
Mei-Hwei
Tseng
b and
Hui-Fen
Wu
*acdef
aDepartment of Chemistry, National Sun Yat-Sen University, Kaohsiung, 80424, Taiwan. E-mail: hwu@faculty.nsysu.edu.tw; Fax: +886-7-5253909; Tel: +886-7-5252000-3955
bDepartment of Applied Physics and Chemistry, University of Taipei, Taipei, 10048, Taiwan
cDoctoral Degree Program in Marine Biotechnology, National Sun Yat-Sen University and Academia Sinica, Kaohsiung, 80424, Taiwan
dSchool of Pharmacy, College of Pharmacy, Kaohsiung Medical University, Kaohsiung, 806, Taiwan
eInstitute of Medical Science and Technology, National Sun Yat-Sen University, 80424, Taiwan
fCenter for Nanoscience and Nanotechnology, National Sun Yat-Sen University, Kaohsiung, 80424, Taiwan
First published on 17th November 2015
Abstract
Graphene oxide–zinc oxide hybrid nanostructures were synthesized and they demonstrated significant and promising antimicrobial activity on pathogenic bacteria. The combination of graphene oxide with zinc oxide nanorods showed an impressive antibacterial effect under intense scrutiny as compared with individual graphene oxide or zinc oxide nanomaterials. The characterization and investigation of GO–ZnO nanorod hybrid nanostructures were conducted using UV, FTIR, XRD, SEM, EDX and TEM measurements. The antimicrobial activity of the above hybrid material was evaluated by various methods including MALDI-MS analysis, a disk diffusion assay and optical density measurements.
1. Introduction
Bacterial infection is one of the most serious clinical issues associated with significant mortality and health-care costs.1,2 Great efforts have thus been invested in the search for an effective solution, and some materials have been developed and investigated for this purpose. In the strategies being sought, antibacterial materials have been widely used and the materials can effectively suppress bacterial growth. The synthesis methods of the materials for various applications, such as silver nanoparticles, derivatives of chitosan, and antibacterial polymers, have been intensively developed.3–9Graphene is a promising material under consideration for antibacterial media owing to its unique structure of a single atom-thick sheet of carbon atoms10 and its related materials having distinctive electronic, thermal, and mechanical properties.11 These graphene related materials, especially graphene oxide (GO), exhibit high potential for the antibacterial effect.12–16 The distinct advantages of graphene oxide such as excellent water solubility, detergent-free for dispersion, and high surface area have made it a superior material in biological applications.17 Previous reports and the work of Nguyen et al. suggested an improved antibacterial activity of graphene oxide decorated with silver, gold, and polymer.18–22 Zinc oxide nanomaterials have also been demonstrated to exhibit significant antimicrobial activity against Staphylococcus aureus23 and Escherichia coli.23–26 The antibacterial activity of ZnO hybrid nanomaterial has been investigated.27 Other nanostructures like ZnO nanorods (NRs) exhibit outstanding antimicrobial effects and can be applied to a variety of applications.28,29 With high surface area to volume ratios, nanoparticles provide advantageous benefits of solubility and prolonged effects on enhanced antimicrobial activity. In addition a nanomaterial has the advantage of low toxicity compared with the conventional antibiotics. Therefore, nanomaterials are prospective substitutes as antibacterial agents for preventive and therapeutic purposes.
We reported a synthesis approach of a novel material of graphene oxide–zinc oxide nanorod hybrid nanostructures for effective antibacterial activity. The morphology, composition and electronic structure of fabricated materials were characterized by using UV, FTIR, Raman, XRD, TEM, SEM and EDX measurements. The antibacterial activity was evaluated and investigated by MALDI-MS and optical density measurements. High effectiveness and long-term antibacterial activity of such GO–ZnO NR hybrid nanostructures were achieved. Evidently, the hybrid nanostructures30 collectively demonstrated a synergistic effect and exhibited higher antibacterial activity as compared with GO and ZnO NRs at the same dispersion concentration individually. Furthermore, the outcome of this research is comparable to the work reported by Kavitha et al. for the investigation of antibacterial properties of graphene–ZnO nanoparticles31 and graphene oxide–ZnO NPs.15 In addition, the outcomes of experimental results were confirmed to demonstrate the applications in Biomedicine field.
2. Experimental section
2.1. Materials and instrumentation
Powdered graphite flakes were obtained from Alfa Aesar (USA). Potassium permanganate was purchased from Merck (Germany). Sinapinic acid (SA), zinc acetate, methanol, and ethanol were procured from J. T. Baker (USA). Trisodium citrate and hydrochloric acid were provided by Showa Chemical Co. Ltd (Japan). Sulfuric acid, sodium chloride, and hydrogen peroxide were obtained from Sigma-Aldrich (USA). Nitric acid procured from Scharlau Chemie S. A. (European Union). Potassium hydroxide pellets were bought from Riedel-de Haën (Czech Republic). Ultrapure water from a Milli-Q Plus water purification system (18.2 MΩ, Millipore, and Bedford, MA, USA) was used for all experiments. All the reagents used in the preparation process were of analytical reagent grade and were used without further purification.The bacteria Staphylococcus aureus (BCRC 10451) and Escherichia coli (BCRC 12570) were purchased from the Bioresource Collection and Research Centre (Hsinchu, Taiwan). The bacteria were cultivated at 37 °C and maintained on Difco™ nutrient broth and agar plates (8 g of the powder in 1 L of purified water). Both bacteria were grown individually overnight at 37 °C. On agar plates the bacterial colonies were freshly grown and were dispersed in DI water for later use in experimental procedures.
All mass spectra were recorded in the positive ion mode using a MALDI-TOF MS (Microflex, Bruker Daltonics, Bremen, Germany) with 1.25 m flight tube. The MALDI source was equipped with a nitrogen laser (337 nm) with 3 ns pulse width. The accelerating voltage was set at 20 kV. All MALDI-MS spectra were obtained using an average of 200 laser shots. All experiments were performed in the linear positive mode with optimal laser energy. The laser power was adjusted to slightly above the ionization threshold of the cell lysate to obtain high resolution signal-to-noise ratios. The dried droplet method was used for all experiments with sinapic acid (50 mM, acetonitrile![[thin space (1/6-em)]](https://www.rsc.org/images/entities/char_2009.gif) :
:![[thin space (1/6-em)]](https://www.rsc.org/images/entities/char_2009.gif) water 50
water 50![[thin space (1/6-em)]](https://www.rsc.org/images/entities/char_2009.gif) :
:![[thin space (1/6-em)]](https://www.rsc.org/images/entities/char_2009.gif) 50) as the matrix.
50) as the matrix.
The morphology of the synthesized nanomaterial was determined using a transmission electron microscope (TEM, Phillip CM200, Switzerland) at an accelerating voltage of 200 kV. Scanning electron microscopy (SEM) and energy dispersive X-ray (EDX) spectroscopy were carried out using a JEOL 6700F, Japan. The UV measurements were undertaken using a UV spectrophotometer (Thermo Scientific Evolution 201, USA), equipped with a xenon flash lamp (150 W). The Fourier transform infrared (FTIR) spectra of graphene were recorded using an FT-IR spectrometer (Spectrum 100, PerkinElmer, USA). All nanomaterials were characterized using X-ray diffraction (XRD) studies (Bruker D8 Advance, Germany). Raman spectra were recorded using a Peak Seeker and a Peak Seeker Pro (Agiltron Inc., USA), with the wavelength of 785 nm and the laser power of 150 mW. All spectra were drawn and fitted using Origin V6 software.
2.2. The preparation of graphene oxide
Graphene oxide was prepared from natural graphite using Hummer's method with a slight modification and according to some related studies.32–34 Powdered graphite flakes (1 g) in a round flask were dissolved in a mixture of nitric acid (10 mL, 69–72%) and sulfuric acid (15 mL, 96%), and then placed in an ice-bath with magnetic stirring (Cimarec™, Thermo Scientific) with due care taken to control the temperature to not exceed 20 °C. Afterwards, potassium permanganate (3 g, 99%) was added gradually into the mixture. The temperature was kept below 0 °C using an ice-sodium chloride bath. After removing the ice-bath, hydrogen peroxide (30–32%, 15 mL) was added to remove excess permanganate. After magnetic stirring for 2 h, distilled water (200 mL) was poured slowly into the mixture to obtain a dark brown colloidal suspension. After stirring for another 30 min, the dispersion was filtered, and then washed several times with diluted HCl solution to remove metal ions. The colloidal suspension was further exfoliated by ultra-sonication for 3 h to generate a stable colloidal suspension. The product obtained was graphene oxide for further use in all experiments.2.3. The preparation of zinc oxide nanorods
ZnO nanorods were prepared following a previously reported method of Sun et al. with some modifications.35 Briefly, 4.45 mmol of Zn(Ac)2·2H2O (analytical reagent, A.R.) was dissolved in 42 mL of methanol with 250 μL of H2O in a flask and the solution was heated at 60 °C under vigorous stirring. Then 9.62 mmol of KOH (82.0%, wt%) was dissolved into 23 mL of methanol, and the solution was poured dropwise into the flask over 10–15 min. The mixed solution was heated at 60 °C for 2 h and 15 min until it became white and cloudy. A small amount of water was found helpful in increasing the growth rate of nanocrystals. To grow the nanorods, the solution was cooled to room temperature, nitrogen purging was used to condense the original solution to about 10 mL and the solution became clear again. It was proved that condensing was helpful in increasing the growth rate of ZnO nanorods. Finally, the condensed solution was reheated at 60 °C for 12 h, resulting in the formation of ZnO nanorods with an average length of 90 nm and an average diameter of 18 nm. The resulting gel was centrifuged and washed with ethanol for the removal of excess ions, and washed further with diluted tri-sodium citrate aqueous solution several times.2.4. The synthesis of graphene oxide–zinc oxide nanorods
In a typical procedure, equal weights of graphene oxide (0.1 g) and ZnO nanorods (0.1 g) were dispersed in 15 mL deionized water. The mixture was stirred for 24 h until a clear dispersion was obtained.36 The prepared graphene oxide–ZnO nanorod hybrid nanostructures were separated by centrifugation (20 min), washed several times and then dispersed again in 15 mL deionized water.2.5. Disk diffusion method
S. aureus and E. coli were cultured using Difco™ nutrient agar medium. The antimicrobial activities of the hybrid nanomaterial were evaluated qualitatively by the disk diffusion method. The concentration of ∼106 cfu mL−1 was inoculated on nutrient agar plates. Filter paper with a diameter of 0.5 cm was dipped in 4 and 6 μg mL−1 of constituent and hybrid nanomaterial suspensions. These filter papers were placed on the surface of bacteria inoculated agar plates. Control filter paper which was dipped with DI water was also used. After incubation for 12 h at 37 °C, the zones of inhibition area were measured and optical images of the plates were taken.2.6. Optical density (OD600) measurements
In this section the optical densities of hybrid nanomaterials and pathogenic bacteria were measured at 600 nm. Different concentrations of hybrid nanomaterials of 2, 4, 6, 8, and 10 μg mL−1 and the highest concentrations of constituent nanomaterial were prepared in DI water. The well grown bacteria E. coli [∼106 cfu mL−1] and S. aureus [∼106 cfu mL−1] were inoculated in each sample. The mixed suspension was kept in an incubator with continuous shaking for different time periods of 0, 3, 6, 9, 12, 15, 19, and 24 h. Each sample was diluted to 3 mL using DI water. At every interval, the OD was measured at 600 nm to examine the growth of bacteria at different time periods. The graph was plotted of OD at 600 nm versus time to predict the growth of bacteria after interacting with increasing concentrations of nanomaterials.2.7. Transmission electron microscopy (TEM) images
TEM was performed to visualize the morphology changes after treating with a nanomaterial hybrid mixture. Herein the pathogenic bacteria grew (∼103 cfu mL−1) in nutrient medium containing hybrid nanomaterial (8 μg mL−1). The bacterial suspension was centrifuged; afterwards it was washed with phosphate buffer saline [PBS] and re-suspended in DI water. This bacterial sample was fixed in 2.5% glutaraldehyde solution for 2 h, followed by post-fixing with freshly prepared 1% osmium oxide solution for 1 h. Finally the specimen was rinsed with DI water twice and the sample was spotted on copper grids and kept for drying. The specimen was then investigated by TEM, and cell membrane damage was observed by hybrid nanomaterials.3. Results and discussion
3.1. Characterization of the constituent and hybrid nanomaterials
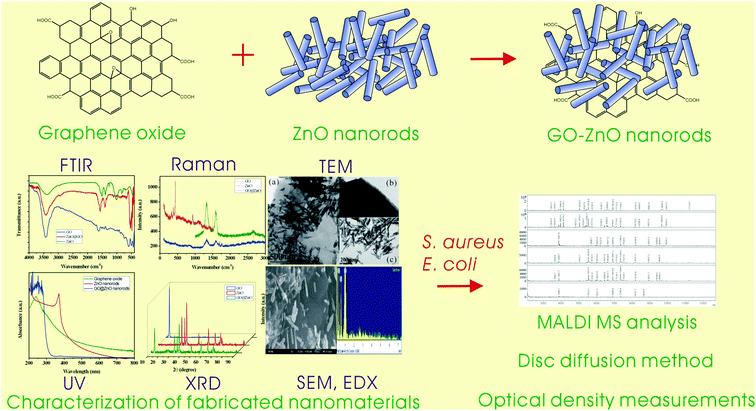
The entire range of experimental processes including the fabrication, characterization of nanomaterials and evaluation of antibacterial activity are presented in the schematic illustration in Fig. 1. The optical and structural properties of nanomaterials were analyzed by using UV, FTIR, Raman and XRD measurements respectively. TEM, SEM and EDS measurements were utilized for morphology and elemental composition analyses. The antibacterial activity was evaluated and investigated in detail by using a MALDI-MS analysis, optical density measurements (at 600 nm), and a disc diffusion assay.In Fig. 2(A), TEM images clearly demonstrate the shape and size of graphene oxide, ZnO nanorods, and the combination of the two constituent materials. ZnO nanorods were decorated on the surface of graphene oxide nanosheets. From the SEM images and the corresponding EDX spectra shown in Fig. 2(B), the morphologies of materials were quite perceptible and the component elements were identified. Usually in composite nanomaterials’ synthesis and applications, their morphological characteristics are altered with respect to individual entities. The synergistic effect of hybrid nanostructure usually depends on inherent shape and size of individual nanomaterial. From the observed TEM images, the results suggest that the reaction steps involved in the synthesis procedure do not have effects on the morphology of the materials.37
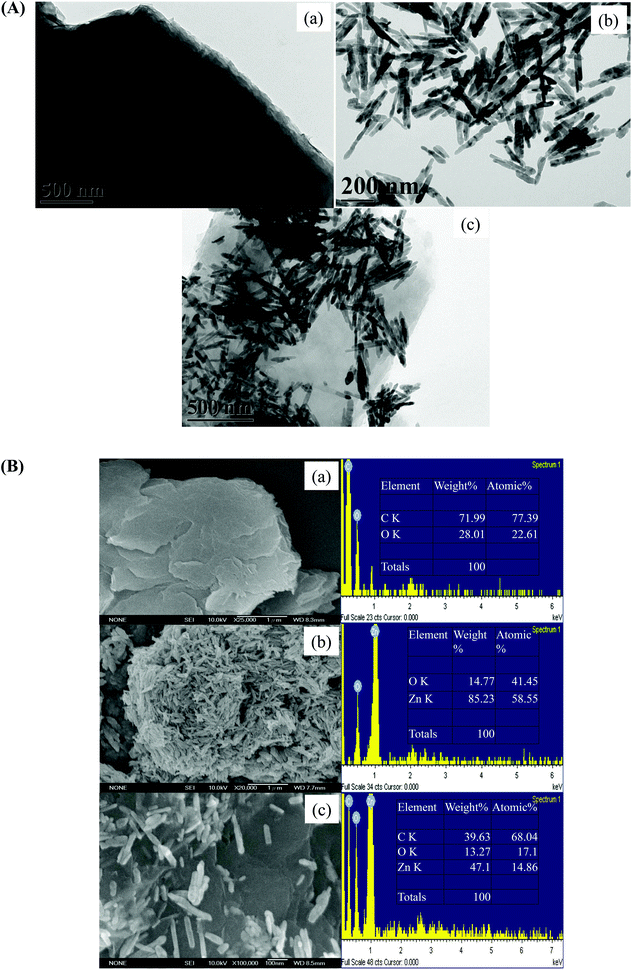 | ||
| Fig. 2 Characterization of GO–ZnO nanorods and their constituents by (A) TEM, (B) SEM images and the corresponding EDX spectra. | ||
As shown in Fig. 3(A) of UV-vis spectra, the major and its shoulder peak of graphene oxide can be observed near 250 nm and around 305 nm, respectively. The peak and its shoulder peak were observed which can be attributed to the excitation of the π → π* transition of aromatic C–C and the n → π* transition of C![[double bond, length as m-dash]](https://www.rsc.org/images/entities/char_e001.gif) O, respectively.38,39 The sharp and distinct peak which is the characteristic of zinc oxide can be found near 370 nm. The narrow and intensive peak is expected from a mono-disperse solution of ZnO NRs. Both peaks are visibly present in the hybrid material, indicating the effective blending of the components and the absorbance at both specific wavelengths implies the confirmation of the structure. The combined observation of a drastic decrease of intensity on the peak at 375 nm (ZnO NRs) and the broadening of the peak at 250 nm (graphene oxide) indicate that the functional groups on graphene oxide sheets were not readily available due to the covering of ZnO NRs. It shows that the UV-vis spectra of hybrid nanomaterials are likely to be influenced.31 The constituent nanomaterials showed significant absorbance in the UV-visible range of 200–400 nm. At around 600 nm, the hybrid nanomaterial showed insignificant absorbance and thus a continuous band was observed instead of a sharp peak. This characteristic pattern of UV-visible absorption is useful to perform OD measurements at 600 nm without self-absorption of the material.
O, respectively.38,39 The sharp and distinct peak which is the characteristic of zinc oxide can be found near 370 nm. The narrow and intensive peak is expected from a mono-disperse solution of ZnO NRs. Both peaks are visibly present in the hybrid material, indicating the effective blending of the components and the absorbance at both specific wavelengths implies the confirmation of the structure. The combined observation of a drastic decrease of intensity on the peak at 375 nm (ZnO NRs) and the broadening of the peak at 250 nm (graphene oxide) indicate that the functional groups on graphene oxide sheets were not readily available due to the covering of ZnO NRs. It shows that the UV-vis spectra of hybrid nanomaterials are likely to be influenced.31 The constituent nanomaterials showed significant absorbance in the UV-visible range of 200–400 nm. At around 600 nm, the hybrid nanomaterial showed insignificant absorbance and thus a continuous band was observed instead of a sharp peak. This characteristic pattern of UV-visible absorption is useful to perform OD measurements at 600 nm without self-absorption of the material.
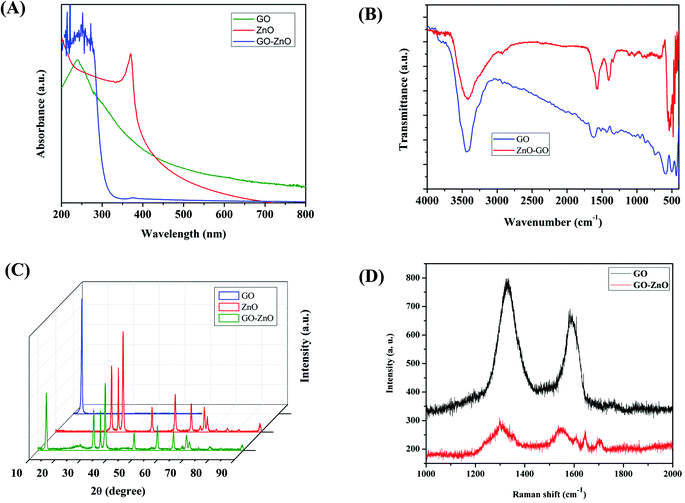 | ||
| Fig. 3 Continued characterization of GO–ZnO nanorods and their constituents by using (A) UV, (B) FTIR, (C) XRD, and (D) Raman spectra. | ||
From the FTIR spectra presented in Fig. 3(B), the functional groups present in materials can be assigned and interpreted. Since the vibrational mode of Zn–O bonding the fingerprint region of ZnO NRs is generally located around 450 cm−1 in FTIR spectra, the FTIR spectrum for ZnO NRs is not shown in the figure.40 As can be seen from the figure, graphene oxide exhibits peaks at 3450 cm−1 (O–H stretching vibration), 1715 cm−1 (C![[double bond, length as m-dash]](https://www.rsc.org/images/entities/char_e001.gif) O stretching vibration), 1420 cm−1 (C–OH stretching vibration), and 1050 cm−1 (C–O stretching vibration).41 The broad band between 3000 and 3700 cm−1 corresponds to the stretching of the OH group of water molecules adsorbed on GO, and the bending of this group at 1635 cm−1. The carbonyl group at the edge of GO is present at 1630 cm−1. C–O stretching of carboxylic acid can be found at 1385 cm−1 and 1110 cm−1 which can be attributed to the stretching vibration of C–OH. The O–H vibrational stretching peak of GO–ZnO NR hybrids decreased in intensity and, on the contrary, the functional groups like C
O stretching vibration), 1420 cm−1 (C–OH stretching vibration), and 1050 cm−1 (C–O stretching vibration).41 The broad band between 3000 and 3700 cm−1 corresponds to the stretching of the OH group of water molecules adsorbed on GO, and the bending of this group at 1635 cm−1. The carbonyl group at the edge of GO is present at 1630 cm−1. C–O stretching of carboxylic acid can be found at 1385 cm−1 and 1110 cm−1 which can be attributed to the stretching vibration of C–OH. The O–H vibrational stretching peak of GO–ZnO NR hybrids decreased in intensity and, on the contrary, the functional groups like C![[double bond, length as m-dash]](https://www.rsc.org/images/entities/char_e001.gif) O and C–OH were intensified as compared to those of GO. The broad and intense peak observed at 500 cm−1 might correspond to Zn–O stretching mode vibration (ZnO NRs). The changes in spectral features of hybrid nanomaterial indicate the slight modification in functional groups of graphene oxide by ZnO NRs. The presence of oxygen containing groups demonstrates the oxidation of graphene sheets. In addition, the hybrid material exhibits a similar peak pattern and the corresponding peaks from the spectra of GO suggest uniform blending of the materials.
O and C–OH were intensified as compared to those of GO. The broad and intense peak observed at 500 cm−1 might correspond to Zn–O stretching mode vibration (ZnO NRs). The changes in spectral features of hybrid nanomaterial indicate the slight modification in functional groups of graphene oxide by ZnO NRs. The presence of oxygen containing groups demonstrates the oxidation of graphene sheets. In addition, the hybrid material exhibits a similar peak pattern and the corresponding peaks from the spectra of GO suggest uniform blending of the materials.
The crystalline and structural behaviors of GO–ZnO NR hybrid nanomaterials were revealed by powder X-ray diffraction measurements. The XRD patterns of the materials ZnO nanorods, graphene oxide and GO–ZnO nanorods are exhibited in Fig. 3(C). An intense and sharp peak at 13.5° (Fig. 3(C), blue curve), which corresponds to the (001) diffraction peak of exfoliated GO, is observed. This peak with the decrease in intensity was similarly observed in diffraction patterns of the GO–ZnO NR hybrid (Fig. 3(C), green curve). Zinc oxide NR array powder exhibits typical peaks at 31.7° (100), 34.4° (002), 36.2° (101), 47.5° (102), 56.6° (110), and 62.9° (103) (JCPDS no. 36-1415), respectively.15,42 The 002 peak at 34.4° corresponds to the wurtzite structure which can prove the well-oriented pattern of ZnO nanorods while in the current approach, other peaks were more intense; that is because the ZnO nanorods were formed and grown in a random way.43 In the hybrid nanomaterial, the peaks were observed corresponding to the ZnO NR nanomaterials with little shift. This implies that the pattern of rods modified on graphene oxide sheets changes the structure of crystal lattices. Regarding graphene oxide, the indication that all peaks in the hybrid nanomaterial well match those of GO confirms that the ZnO nanorods were successfully decorated on the graphene oxide sheet.
The Raman spectroscopy further confirmed the ordered or disordered structures of carbonaceous materials. The defects and structural disorder of material were assessed and are shown in Fig. 3(D). This figure confirms that the hybrid material has been fabricated. It can be seen that the GO exhibits two main bands at 1582 [G band] and 1350 cm−1 [D band]. For the GO–ZnO nanocomposite, the D and G bands shifted to 1300 and 1550 cm−1. Additionally, the intensity ratio of D and G bands is higher in the GO–ZnO nanocomposite [1.14] as compared to GO [1.03]. According to the literature, the increase in the ratio and shifting of bands confirms the successful formation of the GO–ZnO nanocomposite.44 The prominent D peak represents the vibration of sp3-hybridization carbon atoms, and the extent of impurities, which is due to the attachment of hydroxyl and epoxide groups on the carbon basal plane or edges, other defects, and disordered carbon.22,45 The G peak corresponds to ordered sp2-hybridization carbon atoms. The spectra showed that the carbon framework underwent significant structural changes during the ZnO NR decoration on the graphene oxide sheet (Fig. 3(D)). The intensity and broadness of both characteristic D and G peaks were increased for the GO–ZnO NR hybrid nanomaterial.
3.2. Optical density measurement for the antimicrobial test
A quantitative evaluation of the antibacterial activity was performed by measuring the OD600 of bacteria treated with as-synthesized nanomaterials.46Fig. 4 shows the growth curves of S. aureus (Fig. 4(A)) and E. coli (Fig. 4(B)) treated with the constituent and hybrid nanomaterials. The results support the qualitative antibacterial effect of nanomaterials from disk diffusion study. Previous reports and the work of Yan-Wen Wang et al. suggested that the effective antibacterial concentration was 500 μg mL−1 for ZnO and 10 μg mL−1 for GO–ZnO nanoparticles.15 In this study, the same effective antibacterial concentration is ∼8 μg mL−1 for GO–ZnO nanoparticles for both S. aureus and E. coli. The optical density measurements for both Staphylococcus aureus (a Gram-positive bacterium) and Escherichia coli (a Gram-negative bacterium) are shown in Fig. 4. All concentrations of the GO–ZnO nanorod hybrid applied to each bacterium were recorded in time intervals, and the control was included for the efficacy evaluation of the hybrid material. To compare the efficiencies of the hybrid material and the constituents, graphene oxide and ZnO nanorods were included in the diagrams. As can be seen from the curves, higher antibacterial activity was observed for the largest concentration of the material applied to both bacteria. From Fig. 4(A) and (B), the OD of constituent nanomaterials exhibited lower toxicity toward both Gram-positive and Gram-negative bacteria. For the same concentration of GO–ZnO nanorods and time, this hybrid material has superior antibacterial activity for E. coli over S. aureus. The sharp graphene oxide edges are more destructive to the thin peptidoglycan layer of the cell wall of Gram-negative bacteria than Gram-positive bacteria such as S. aureus. In Fig. 4, for both the bacteria S. aureus and E. coli, 8 μg mL−1 is the optimum concentration for bacteria inhibition. The lag phase of bacteria was extended from 2.5 h to 10 h which indicated that the bacterial cells were inhibited tremendously so that the log phase was not started for multiplication. The log phase continued for 16 h is difficult to distinguish. In the case of E. coli, the concentration of 10 μg mL−1 revealed this pattern, the stationary phase was started at around 12 h and continued for 20 h. In the case of E. coli, log and stationary phases were not much different from each other as compared to S. aureus. In the case of S. aureus the log phase was distinguishable but still it was delayed as compared to the control bacterial growth curve. This result showed that the Gram-negative bacteria are more susceptible to the hybrid nanomaterial as compared to the Gram-positive bacteria. The growth of bacteria decreased drastically over the period of time in accordance with the concentration increase of the hybrid nanomaterial. The maximum concentration of 10 μg mL−1 of the constituent nanomaterials has been plotted with the hybrid for comparison. The results showed that the constituent nanomaterials exhibit an insignificant antibacterial capacity toward both Gram-positive and Gram-negative bacteria. The constituent materials possess antibacterial activity only at higher concentrations than those used in this study. This study demonstrates that the synergistic effect of both materials with very low concentrations at short times is well proved.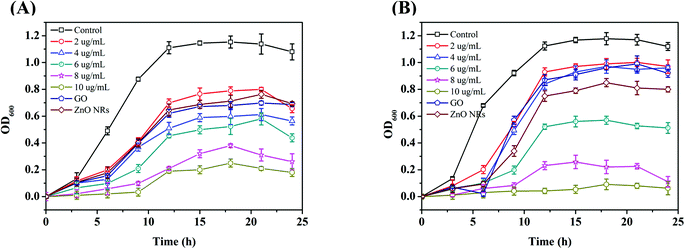 | ||
| Fig. 4 Optical density measurements of bacteria at a wavelength of 600 nm (OD600) for (A) S. aureus and (B) E. coli. | ||
3.3. Matrix-assisted laser desorption/ionization mass spectrometry [MALDI-MS] study for the interactions of nanomaterials with bacteria
In this section, the bacteria were treated with nanomaterials and the bacterial biomarker peaks’ changes for different concentrations of constituents and hybrid nanomaterials were demonstrated. MALDI-MS spectra for S. aureus and E. coli are shown in Fig. 5 and 6, respectively. Fig. 5(A)–(C) show the spectra of S. aureus (∼106 cfu mL−1) treated with different concentrations of graphene oxide, ZnO nanorods, and GO–ZnO NR hybrid nanomaterial under 1 h of incubation. Fig. 6(A)–(C) show the spectra of E. coli treated with graphene oxide, ZnO nanorods and GO–ZnO NR hybrid nanomaterial. In the case of S. aureus, the bacterium treated with graphene oxide is shown in Fig. 5(A) and (a), (b), (c), (d), (e), and (f) represent the control, and 2, 4, 6, 8, and 10 μg mL−1 of nanomaterials added. The control bacterial sample showed various characteristic mass signals at around m/z 3000 to 11![[thin space (1/6-em)]](https://www.rsc.org/images/entities/char_2009.gif) 000. The intensity of specific signals decreased with the increase in the concentration of nanomaterials. In addition, the signals at the highest concentration of graphene oxide treated with S. aureus were diminished as compared to the control. This indicates that the sharp edges of materials exhibit killing activity at higher concentration. In the case of ZnO, S. aureus was treated with this material (Fig. 5(B)), the control bacterial peaks were highly intensified with marker peaks. ZnO nanorods treated with S. aureus showed greater killing effects as compared to graphene oxide. Most of the mass signals and their intensity drastically decreased for the concentration of 10 μg mL−1 (f). In Fig. 5(C), the bacterial killing effects were shown for the GO–ZnO NR hybrid nanomaterial. In the control spectra (a), m/z 3869, m/z 5307, m/z 5534.9, m/z 6573.2 m/z 7351 and m/z 9680.3 of these characteristic bacterial peptides and high biomolecule peaks were observed. As the concentration of the hybrid nanomaterial increased from 2 μg mL−1 to 10 μg mL−1, the peaks decreased in intensity and some peaks disappeared. Higher toxicity to bacteria by the highest concentration was shown when the peaks were seen at very low magnifications like 2000 arbitrary units. In the case of 8 μg mL−1, the peaks were diminished to the extent that the baseline had to be magnified in order to observe higher mass peaks.
000. The intensity of specific signals decreased with the increase in the concentration of nanomaterials. In addition, the signals at the highest concentration of graphene oxide treated with S. aureus were diminished as compared to the control. This indicates that the sharp edges of materials exhibit killing activity at higher concentration. In the case of ZnO, S. aureus was treated with this material (Fig. 5(B)), the control bacterial peaks were highly intensified with marker peaks. ZnO nanorods treated with S. aureus showed greater killing effects as compared to graphene oxide. Most of the mass signals and their intensity drastically decreased for the concentration of 10 μg mL−1 (f). In Fig. 5(C), the bacterial killing effects were shown for the GO–ZnO NR hybrid nanomaterial. In the control spectra (a), m/z 3869, m/z 5307, m/z 5534.9, m/z 6573.2 m/z 7351 and m/z 9680.3 of these characteristic bacterial peptides and high biomolecule peaks were observed. As the concentration of the hybrid nanomaterial increased from 2 μg mL−1 to 10 μg mL−1, the peaks decreased in intensity and some peaks disappeared. Higher toxicity to bacteria by the highest concentration was shown when the peaks were seen at very low magnifications like 2000 arbitrary units. In the case of 8 μg mL−1, the peaks were diminished to the extent that the baseline had to be magnified in order to observe higher mass peaks.
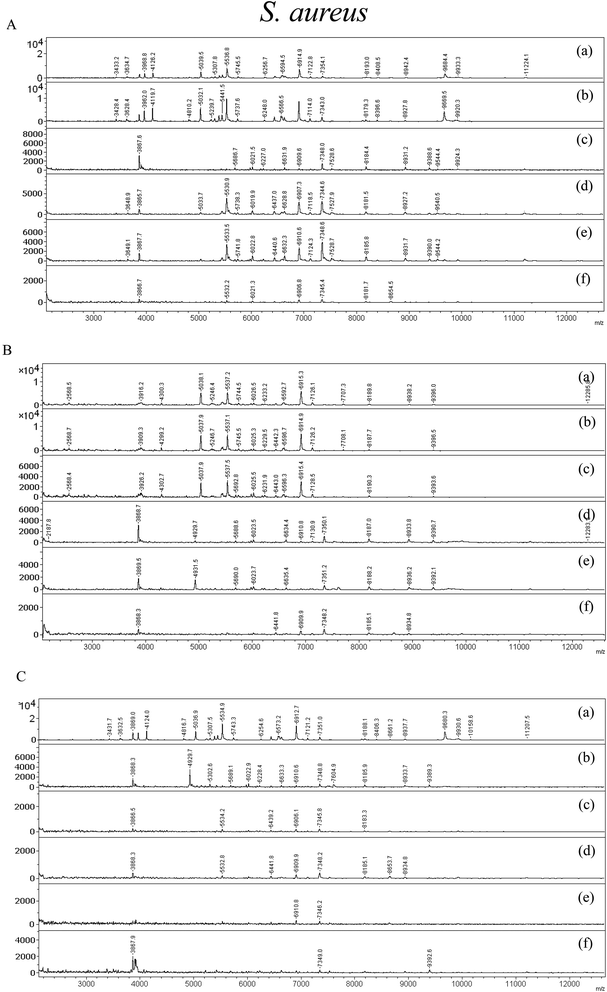 | ||
| Fig. 5 MALDI-TOF MS spectra of S. aureus treated with (A) GO, (B) ZnO, and (C) GO–ZnO nanorods, respectively. | ||
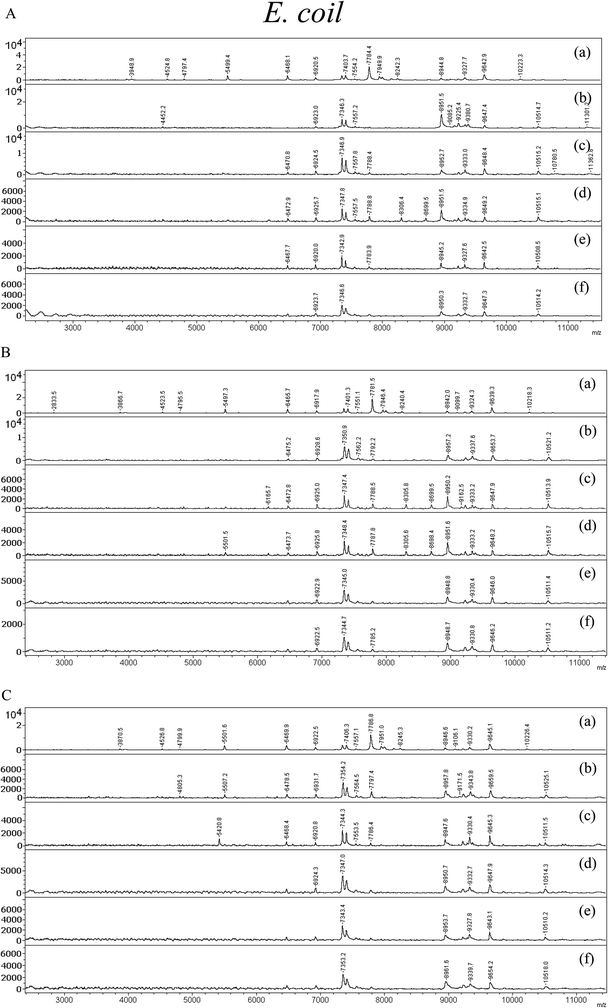 | ||
| Fig. 6 MALDI-TOF MS spectra of E. coli treated with (A) GO, (B) ZnO, and (C) GO–ZnO nanorods, respectively. | ||
In the case of Gram-negative bacteria such as E. coli, those treated with the nanomaterial are shown in Fig. 6. In Fig. 6(A)–(C), the spectra of E. coli treated with GO, ZnO and GO–ZnO NR hybrid nanomaterial are displayed, respectively. In the case of graphene oxide, it showed insignificant toxicity effects on bacteria for almost all the aforementioned concentrations. From this result it can be seen that larger concentrations than 10 μg mL−1 of graphene oxide are needed for antibacterial activity. In the case of ZnO NRs, slightly higher toxicity as compared to GO was observed when treated with E. coli at higher concentrations of 10 μg mL−1. In comparison to constituent nanomaterials like graphene oxide and ZnO nanorods, GO–ZnO NRs showed very significant antibacterial activity toward E. coli. The control spectra for E. coli (a) displayed characteristic peaks at m/z 55![[thin space (1/6-em)]](https://www.rsc.org/images/entities/char_2009.gif) 501.6, m/z 6469.9, m/z 7406.3, m/z 8946.6 and m/z 9645.1. These peaks are attributed to the bacterial cell wall of bio-macromolecules. The high mass peaks were distinctly observed at low concentration of nanomaterials in spectra (b) and (c) for 2 and 4 μg mL−1. With higher concentrations of 6, 8, and 10 μg mL−1 in (d), (e), and (f) very few peaks are shown and the intensity of those signals is very low. Even at as low concentrations as 8 μg mL−1 and 10 μg mL−1 of GO–ZnO NR hybrid nanomaterial, high toxicity of the material was demonstrated by the observation of a few peaks from the control at m/z 7353.2, m/z 8961.6, and m/z 9654.2. In both Gram-positive and Gram-negative bacteria the highest antibacterial effect and toxicity of GO–ZnO hybrid nanomaterial are shown. In conclusion, the mass spectra illustrated that the Gram-negative bacteria E. coli can be killed more effectively as compared to Gram-positive S. aureus. From the number of mass signals, intensity, and the extinction of some signals of E. coli as compared to the control the antibacterial effect of the material can be confirmed. As a result, the antibacterial activity of GO–ZnO NR hybrid nanomaterial has been demonstrated.
501.6, m/z 6469.9, m/z 7406.3, m/z 8946.6 and m/z 9645.1. These peaks are attributed to the bacterial cell wall of bio-macromolecules. The high mass peaks were distinctly observed at low concentration of nanomaterials in spectra (b) and (c) for 2 and 4 μg mL−1. With higher concentrations of 6, 8, and 10 μg mL−1 in (d), (e), and (f) very few peaks are shown and the intensity of those signals is very low. Even at as low concentrations as 8 μg mL−1 and 10 μg mL−1 of GO–ZnO NR hybrid nanomaterial, high toxicity of the material was demonstrated by the observation of a few peaks from the control at m/z 7353.2, m/z 8961.6, and m/z 9654.2. In both Gram-positive and Gram-negative bacteria the highest antibacterial effect and toxicity of GO–ZnO hybrid nanomaterial are shown. In conclusion, the mass spectra illustrated that the Gram-negative bacteria E. coli can be killed more effectively as compared to Gram-positive S. aureus. From the number of mass signals, intensity, and the extinction of some signals of E. coli as compared to the control the antibacterial effect of the material can be confirmed. As a result, the antibacterial activity of GO–ZnO NR hybrid nanomaterial has been demonstrated.
3.4. TEM imaging for bacteria treated with hybrid nanomaterials
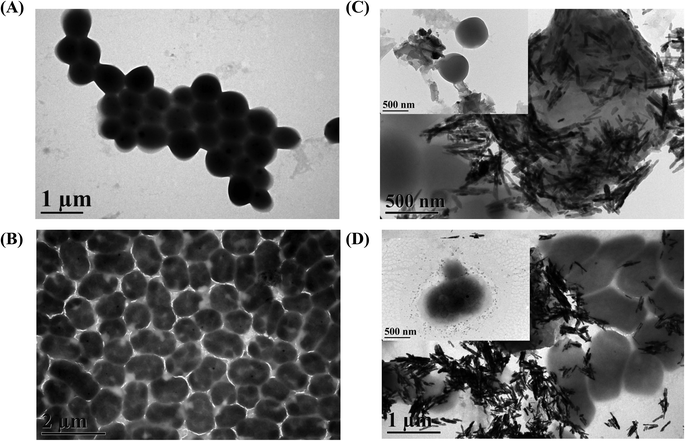
Morphological study helps to investigate the surface interaction between bacteria and GO–ZnO NR hybrid nanomaterial. The morphological analysis of S. aureus and E. coli (the controls and those damaged after the addition of the GO–ZnO NR hybrid nanomaterial) was conducted. As synthesized graphene oxide–ZnO NR hybrid nanomaterial was treated with both S. aureus and E. coli for 1 h of incubation, and TEM results shown in Fig. 7 indicate that the hybrid nanoparticles aggregated and attached onto the surface (membranes) of both bacteria. The bacterial controls for both S. aureus (Fig. 7(A)) and E. coli (Fig. 7(B)) were found to be intact under high vacuum. The GO–ZnO NR hybrids interacted with S. aureus (Fig. 7(C)) and E. coli (Fig. 7(D)) showed a highly ruptured bacterial surface in the inset of the figure. For the interaction of S. aureus with the nanomaterials, the aggregation of ZnO NRs was clearly exhibited over the bacteria and the damaged outer peptidoglycan layer was shown in the inset of the figure. In the case of E. coli (Fig. 7(B)), the nanomaterial remained chemically reactive, resulting in the weakened membrane of elongated shaped bacteria. Large agglomerates were attached to the membrane and were damaged to a large extent (Fig. 7(D), inset). Herein, the nanomaterial hybrid showed higher toxicity and more damaged bacterial surface layer of Gram-negative bacteria of E. coli as compared to S. aureus due to the large thickness of peptidoglycan in the Gram-positive bacteria. TEM images revealed similar results to the OD results for hybrid nanomaterials.3.5. Qualitative antibacterial study by the disk diffusion assay
The GO–ZnO NR hybrid nanomaterial was tested qualitatively for antibacterial activity by the disk diffusion method.47 The GO–ZnO NR hybrid nanomaterial was applied to S. aureus and E. coli and the zone of inhibition was found around the circumference of the nanoparticle dipped disk. The zone of inhibition for GO was not observed and in the case of ZnO NRs, the result is insignificantly visible. In this assay, constituent and hybrid nanomaterials were checked on the same Petri plate with a specific distance for each bacterium. For S. aureus (Fig. 8(A)), when the sample was treated with 6 μg mL−1 of GO–ZnO NRs [3], the visible inhibition zone was seen surrounding the filter paper. When treated with constituent materials like GO [2] and ZnO NRs [1], no inhibition zone was observed. In the case of GO, due to its sheet structure and very low concentration, it is unable to diffuse to nutrient agar. For ZnO NRs, the inhibition was seen but was insignificantly visible by the naked eye. As the ZnO nanorods were elongated in nature, this makes the materials pass to the nutrient agar and kill bacteria but the effect seems to be weak due to a very low concentration. For GO–ZnO NR hybrid nanomaterials, the inhibition zones are clearly visible. In the case of E. coli (Fig. 8(B)), almost the same pattern was observed for GO [2] and ZnO NRs [1]. Compared to S. aureus, hybrid nanomaterials showed a larger inhibition zone toward E. coli [3] for all concentrations. The result implies that both the concentration and hybrid nature of nanomaterials undergo the characteristic changes in the antibacterial study.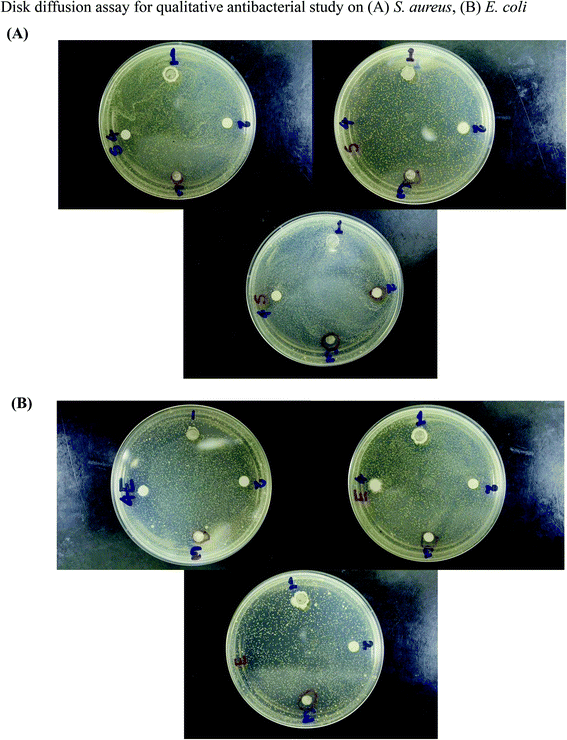 | ||
| Fig. 8 Disk diffusion assay for a qualitative antibacterial study of GO–ZnO nanorods on (A) S. aureus and (B) E. coli. | ||
4. Conclusions
A facile and straightforward approach for the fabrication of GO–ZnO nanorod hybrid nanostructures was demonstrated on an evaluation of their antimicrobial activity on pathogenic bacteria by MALDI-MS analysis. The antimicrobial effect of GO–ZnO nanorod hybrid nanostructures on the pathogens is impressive and promising as compared with their constituent materials. The shape of nanorods plays an important role in the antimicrobial activity due to the interaction between this nanomaterial and the pathogens. The proposed research work can be effective platform in Biomedicine branch to protect against the pathogenic bacteria.Acknowledgements
The authors acknowledge financial support from the Ministry of Science and Technology of Taiwan (NSC 101-2113-M-110-001-MY3) and National Sun Yat-Sen University. We thank Jun-Yi Lee (Department of Chemistry, National Sun Yat-Sen University) for purchasing chemicals and materials.References
- E. L. Munson, D. J. Diekema, S. E. Beekmann, K. C. Chapin and G. V. Doern, J. Clin. Microbiol., 2003, 41, 495–497 CrossRef PubMed.
- P. C. Ray, S. A. Khan, A. K. Singh, D. Senapati and Z. Fan, Chem. Soc. Rev., 2012, 41, 3193–3209 RSC.
- B. C. Allison, B. M. Applegate and J. P. Youngblood, Biomacromolecules, 2007, 8, 2995–2999 CrossRef CAS PubMed.
- M. Aviv, I. Berdicevsky and M. Zilberman, J. Biomed. Mater. Res., Part A, 2007, 83, 10–19 CrossRef PubMed.
- M. Ramstedt, N. Cheng, O. Azzaroni, D. Mossialos, H. J. Mathieu and W. T. Huck, Langmuir, 2007, 23, 3314–3321 CrossRef CAS PubMed.
- V. K. Sharma, R. A. Yngard and Y. Lin, Adv. Colloid Interface Sci., 2009, 145, 83–96 CrossRef CAS PubMed.
- C. Marambio-Jones and E. V. Hoek, J. Nanopart. Res., 2010, 12, 1531–1551 CrossRef CAS.
- M. Dash, F. Chiellini, R. M. Ottenbrite and E. Chiellini, Prog. Polym. Sci., 2011, 36, 981–1014 CrossRef CAS.
- S. B. Lee, R. R. Koepsel, S. W. Morley, K. Matyjaszewski, Y. Sun and A. J. Russell, Biomacromolecules, 2004, 5, 877–882 CrossRef CAS PubMed.
- K. S. Novoselov, A. K. Geim, S. V. Morozov, D. Jiang, Y. Zhang, S. V. Dubonos, I. V. Grigorieva and A. A. Firsov, Science, 2004, 306, 666–669 CrossRef CAS PubMed.
- S. Stankovich, D. A. Dikin, G. H. Dommett, K. M. Kohlhaas, E. J. Zimney, E. A. Stach, R. D. Piner, S. T. Nguyen and R. S. Ruoff, Nature, 2006, 442, 282–286 CrossRef CAS PubMed.
- A. K. Geim, Science, 2009, 324, 1530–1534 CrossRef CAS PubMed.
- C. N. Rao, A. K. Sood, K. S. Subrahmanyam and A. Govindaraj, Angew. Chem., Int. Ed., 2009, 48, 7752–7777 CrossRef CAS PubMed.
- O. Akhavan and E. Ghaderi, ACS Nano, 2010, 4, 5731–5736 CrossRef CAS PubMed.
- Y.-W. Wang, A. Cao, Y. Jiang, X. Zhang, J.-H. Liu, Y. Liu and H. Wang, ACS Appl. Mater. Interfaces, 2014, 6, 2791–2798 CAS.
- D. R. Dreyer, S. Park, C. W. Bielawski and R. S. Ruoff, Chem. Soc. Rev., 2010, 39, 228–240 RSC.
- K. P. Loh, Q. Bao, G. Eda and M. Chhowalla, Nat. Chem., 2010, 2, 1015–1024 CrossRef CAS PubMed.
- I. N. Kholmanov, M. D. Stoller, J. Edgeworth, W. H. Lee, H. Li, J. Lee, C. Barnhart, J. R. Potts, R. Piner, D. Akinwande, J. E. Barrick and R. S. Ruoff, ACS Nano, 2012, 6, 5157–5163 CrossRef CAS PubMed.
- I. E. Mejías Carpio, C. M. Santos, X. Wei and D. F. Rodrigues, Nanoscale, 2012, 4, 4746–4756 RSC.
- D. Zhang, X. Liu and X. Wang, J. Inorg. Biochem., 2011, 105, 1181–1186 CrossRef CAS PubMed.
- J. Ma, J. Zhang, Z. Xiong, Y. Yong and X. S. Zhao, J. Mater. Chem., 2011, 21, 3350–3352 RSC.
- V. H. Nguyen, B.-K. Kim, Y.-L. Jo and J.-J. Shim, J. Supercrit. Fluids, 2012, 72, 28–35 CrossRef CAS.
- O. Yamamoto, Int. J. Inorg. Mater., 2001, 3, 643–646 CrossRef CAS.
- O. Yamamoto, M. Komatsu, J. Sawai and Z. E. Nakagawa, J. Mater. Sci.: Mater. Med., 2004, 15, 847–851 CrossRef CAS PubMed.
- R. Brayner, R. Ferrari-Iliou, N. Brivois, S. Djediat, M. F. Benedetti and F. Fiévet, Nano Lett., 2006, 6, 866–870 CrossRef CAS PubMed.
- X. Wang, F. Yang, W. Yang and X. Yang, Chem. Commun., 2007, 4419–4421 RSC.
- I. Matai, A. Sachdev, P. Dubey, S. Uday Kumar, B. Bhushan and P. Gopinath, Colloids Surf., B, 2014, 115, 359–367 CrossRef CAS PubMed.
- K. H. Tam, A. B. Djurišić, C. M. N. Chan, Y. Y. Xi, C. W. Tse, Y. H. Leung, W. K. Chan, F. C. C. Leung and D. W. T. Au, Thin Solid Films, 2008, 516, 6167–6174 CrossRef CAS.
- I. Perelshtein, E. Ruderman, N. Perkas, T. Tzanov, J. Beddow, E. Joyce, T. J. Mason, M. Blanes, K. Molla, A. Patlolla, A. I. Frenkel and A. Gedanken, J. Mater. Chem. B, 2013, 1, 1968–1976 RSC.
- H. Chang, Z. Sun, K. Y.-F. Ho, X. Tao, F. Yan, W.-M. Kwok and Z. Zheng, Nanoscale, 2011, 3, 258–264 RSC.
- T. Kavitha, A. I. Gopalan, K.-P. Lee and S.-Y. Park, Carbon, 2012, 50, 2994–3000 CrossRef CAS.
- R. Offeman and W. Hummers, J. Am. Chem. Soc., 1958, 80, 1339–1339 CrossRef.
- O. Akhavan, ACS Nano, 2010, 4, 4174–4180 CrossRef CAS.
- H. N. Abdelhamid and H.-F. Wu, J. Mater. Chem. B, 2013, 1, 3950–3961 RSC.
- B. Sun and H. Sirringhaus, Nano Lett., 2005, 5, 2408–2413 CrossRef CAS PubMed.
- P. Khare, R. Yadav and A. Swarup, Int. J. Appl. Phys. Math., 2013, 3, 95–97 CrossRef CAS.
- K. Zhang, L. L. Zhang, X. S. Zhao and J. Wu, Chem. Mater., 2010, 22, 1392–1401 CrossRef CAS.
- T. T. Baby and S. Ramaprabhu, J. Mater. Chem., 2011, 21, 9702–9709 RSC.
- D. C. Marcano, D. V. Kosynkin, J. M. Berlin, A. Sinitskii, Z. Sun, A. Slesarev, L. B. Alemany, W. Lu and J. M. Tour, ACS Nano, 2010, 4, 4806–4814 CrossRef CAS PubMed.
- G. Nagaraju, S. Ashoka, P. Chithaiah, C. N. Tharamani and G. T. Chandrappa, Mater. Sci. Semicond. Process., 2010, 13, 21–28 CrossRef CAS.
- J. Xu, K. Wang, S. Z. Zu, B. H. Han and Z. Wei, ACS Nano, 2010, 4, 5019–5026 CrossRef CAS PubMed.
- C. Pacholski, A. Kornowski and H. Weller, Angew. Chem., Int. Ed., 2002, 41, 1188–1191 CrossRef CAS.
- X. Liu, L. Pan, Q. Zhao, T. Lv, G. Zhu, T. Chen, T. Lu, Z. Sun and C. Sun, Chem. Eng. J., 2012, 183, 238–243 CrossRef CAS.
- G. Eda and M. Chhowalla, Adv. Mater., 2010, 22, 2392–2415 CrossRef CAS PubMed.
- U. Alver, W. Zhou, A. B. Belay, R. Krueger, K. O. Davis and N. S. Hickman, Appl. Surf. Sci., 2012, 258, 3109–3114 CrossRef CAS.
- L. M. Maurer, E. Yohannes, S. S. Bondurant, M. Radmacher and J. L. Slonczewski, J. Bacteriol., 2005, 187, 304–319 CrossRef CAS PubMed.
- K. R. Fiebelkorn, S. A. Crawford, M. L. McElmeel and J. H. Jorgensen, J. Clin. Microbiol., 2003, 41, 4740–4744 CrossRef CAS PubMed.
Footnote |
| † Electronic supplementary information (ESI) available. See DOI: 10.1039/c5bm00342c |
| This journal is © The Royal Society of Chemistry 2016 |

