The vibrational spectroscopy of the coordinated azide anion; a theoretical study
Received
17th September 2015
, Accepted 2nd November 2015
First published on 10th November 2015
Abstract
The vibrational behaviour of the azide anion in a variety of environments has been examined by DFT methods. The frequency is sensitive to polar, dipolar and quadrupolar fields. The frequency is also dependent on the metal to which it is bonded and thus to the details of that bonding. Several azides within one molecule can be strongly vibrationally coupled, a coupling which carries with it a transfer of spectral activity. It is suggested that whilst absolute vibrational frequencies carry little immediately accessible information, a combination of infrared and Raman data for the antisymmetric stretch region might give limited structural insights.
Introduction
The azide anion is a ligand that shows a remarkable versatility in the range of coordination complexes that it forms. As a terminal ligand, the coordinated metal can be either co-linear with the ligand axis or at an angle to it. As a simple bridging ligand, the bridge can involve a single terminal N atom, bonded to two metal atoms, or the N at either end of the ligand can bond to different metal atoms. Surprisingly commonly, however, it is incorporated in a more complicated manner, particularly when other ligands of some complexity are involved.1 The basics of the vibrational spectroscopy of the azide anion have long been well understood,2 as have its characteristics in coordination compounds.3 In that all azide complexes show an asymmetric azide stretching vibrational mode at ca. 2100 cm−1 which has strong infrared activity, there have been many attempts to relate the frequency (and, to a lesser extent, the intensity) of this spectral feature to the coordination mode of the azide. No clear picture has emerged. Although a consistent pattern of behaviour has been found between closely related members of a series, no significant transferability seems to exist. Conversely, an infrared frequency of 2075 cm−1 is one that seems consistent with almost any mode of azide coordination. The situation is well indicated by quotations from publications some forty years apart:4,5 one should avoid making comparisons between markedly different complexes, that is, between complexes which are of different geometry or which contain different metal atoms in different oxidation states. Moreover, in most cases, the degree of coordination of the azide ligand, that is, whether it is monocoordinate or bridging, cannot be established solely from a consideration of infrared data4 and: the νas(N3) of the azido group in azido-Cd(II) could help in predicting the bonding coordination mode of the bridged azide, but it cannot be used as a diagnostic tool to elucidate for certainty the bonding mode of the azide groups in these complexes.5
There are other vibrational modes of the azide, notably a symmetric stretch at ca. 1400 cm−1 and deformation modes at ca. 650 cm−1 but these have been little studied; their identification is problematic. Relatively few Raman data (which might explore the 1400 cm−1 mode) are available – whilst the symmetric stretch and the deformation modes lack spectral dominance and occur in spectral regions commonly rich with other features.
The complexity of the vibrational spectroscopy of the complexed azide anion is in contrast to that of the cyanide, CN−, ligand. For this ligand a rather consistent picture has been generally accepted, in which metal-ligand π bonding (into ligand antibonding orbitals) is held to be of importance; as a bridging ligand the so-called kinematic effect was accepted as an explanation of the observed behaviour.6 However, there were some data which could not be understood in terms of this model, and this led us to undertake a detailed experimental and, particularly, theoretical, study of the vibrational spectroscopy of the cyanide ligand.7 The conclusions were quite surprising, in view of the simplicity of the ligand. The dominant effect controlling the vibrational frequency of a coordinated cyanide group is that of the electrostatic field to which it is subjected, be a single metal atom or several involved. Kinematic and π bonding are but minor effects. The theoretical work involved was largely based on DFT calculations (often on model systems) but normal coordinate analyses (including some on the outputs of the DFT calculations) also featured. The success of this approach led us to the present DFT study of the vibrational spectroscopy of the azide anion. DFT methodology has previously been applied to azides,8 and whilst vibrational data have been reported, these have never been the focus of attention. The present work is the first to report on the vibrational spectroscopy of the azide ligand and their changes on coordination to a metal.
Calculations
The computational modelling of azides has been done by a DFT approach, using the hybrid functional B3LYP and the extended 6-311++g(d,p) basis set. All the models examined have been optimized to a minimum of energy (checked by exploring vibrational frequencies) and harmonic vibrational frequencies computed. The effect of charges and electric fields on N3− have been evaluated with the azide in fixed orientations. Additionally, we have varied the position of the azide group within model species and report the consequential vibrational frequency changes. All calculation have been performed with the Gaussian 09 package.9
Results
As a marker, we carried out an optimization of the isolated azide anion. The anion was calculated to be of D∞h symmetry, with d(N–N) = 1.183 Å and unscaled vibrational frequencies of 2076 (Σu), 1351 (Σg) and 628 (Π) cm−1. The bond length may be compared with a typical experimental value of d(N–N) = 1.162 Å (in lithium azide10). In the present work we prefer to present unscaled frequencies since we believe that this gives a better indication of the effect of the variables that we consider.
Model systems
In our study of the cyanide anion it was found that the calculated vibrational frequency was very sensitive to the magnitude and position of an adjacent positive charge.7 This is true for the azide anion as well. Fig. 1 shows the variation of the frequencies exhibited by the azide anion in the presence of a variable positive charge placed 2.02 Å (the observed separation in [CaN3]+) from the nearest nitrogen and coaxial with the anion. The charge was varied from 0 to 1.0, so that the overall charge of the system varied from −1 to 0. Not surprisingly, only the dipolar modes were sensitive to the charge variation. The frequency of Σu increased approximately linearly with the charge, with a maximum change of ca. 60 cm−1. The changes to the Π mode were more dramatic. Its frequency increased in a non-linear fashion, with a change of ca. 50 cm−1 for a charge of +0.75. However, further increase of the charge to +1.0 caused the frequency to drop to below its original value. The frequency of Σg varied little with charge variation. These data indicated a clear sensitivity of azide frequencies to electrostatic aspects of its environment. We therefore investigated the consequences of an applied electrostatic dipole and an applied electrostatic quadrupole. It was only possible to explore a small electrostatic dipole along the molecular axis; instability and imaginary frequencies occurred for those larger than indicated in Table 1. Here the antisymmetric stretch was least affected and the symmetric the greatest. Much larger changes were found when the dipole is perpendicular to the molecular axis (Table 2), although now the symmetric mode varies little. Both the antisymmetric stretch and deformation modes showed considerable sensitivity, with the latter significantly split. A quadrupolar field perpendicular to the molecular axis caused but small frequency changes, although the deformation modes were split (Table 3). When applied along the molecular axis, the consequences were much greater (Table 4). The symmetric stretch frequency shows a great sensitivity and, in extremis, appears in a totally different spectral region.
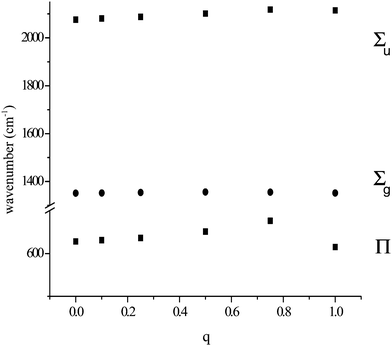 |
| | Fig. 1 Variation of calculated azide frequencies (cm−1) for a N3−⋯q system, with variation of an adjacent charge q. | |
Table 1 Effect on vibrational frequencies (cm−1) of a dipole field applied to N3− (in a.u.) along the molecular axis
| |
0 |
0.04 |
0.045 |
0.048 |
|
Σ
u(νas) |
2076 |
2079 |
2078 |
2078 |
|
Σ
g(νs) |
1351 |
1342 |
1340 |
1339 |
|
Π
|
628 |
642 |
639 |
637 |
Table 2 Effect on vibrational frequencies (cm−1) of a dipole field applied to N3− (in a.u.) perpendicular to the molecular axis
| |
0 |
0.04 |
0.05 |
0.06 |
|
Σ
u(νas) |
2076 |
2052 |
2035 |
2010 |
|
Σ
g(νs) |
1351 |
1350 |
1349 |
1348 |
|
Π
|
628 |
615 |
607 |
597 |
|
Π
|
628 |
590 |
568 |
540 |
Table 3 Effect on vibrational frequencies (cm−1) of a quadrupole field applied to N3− (in a.u.) perpendicular to the molecular axis
| |
0 |
0.0001 |
0.0002 |
0.0003 |
0.0005 |
0.0007 |
|
Σ
u(νas) |
2076 |
2075 |
2074 |
2073 |
2071 |
2068 |
|
Σ
g(νs) |
1351 |
1350 |
1349 |
1347 |
1352 |
1334 |
|
Π
|
628 |
636 |
638 |
635 |
636 |
634 |
|
Π
|
628 |
631 |
634 |
632 |
599 |
531 |
Table 4 Effect on vibrational frequencies (cm−1) of a quadrupole field applied to N3− (in a.u.) parallel to the molecular axis
| |
0 |
0.0001 |
0.0002 |
0.0003 |
0.0005 |
0.0007 |
|
Σ
u(νas) |
2076 |
2075 |
2068 |
2054 |
2006 |
1926 |
|
Σ
g(νs) |
1351 |
1339 |
1301 |
1234 |
979 |
288 |
|
Π
|
628 |
639 |
634 |
612 |
504 |
195 |
The antisymmetric stretch is sensitive, but less so until the field becomes great – when the frequency sensitivity increases. The deformation modes are not greatly affected until, again, the field becomes great. Almost certainly, the quadrupole limit that we have studied is unrealistic – an attempt to increase it further led to imaginary frequencies. However, the sensitivities that we report are surely real.
We have modelled two possible bridging modes of the azide ligand. In the first, the azide is perpendicular to the metal–metal axis (here, charge–charge axis), q1–N(2)–q2 subtending an angle of 107°, the charges being equal and with maximum values of +1/2. The charges were both separated from the terminal N, N(1), by 2.0 Å. the Σu and Σg frequencies increase by a few wavenumbers with charge increase: it is the Π which shows major changes, both splitting, by over 30 cm−1, and increasing in value by up to 40 cm−1. The behaviour is shown in Fig. 2.
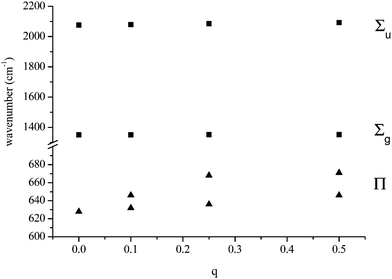 |
| | Fig. 2 Variation of calculated azide frequencies with variation of two equal charges perpendicular to the anion axis (modelling an azide bridging two metal atoms). | |
The second possible bridging mode of the azide ligand may be modelled by placing identical variable charges at either end of the anion, at a fixed separation (2.0 Å was chosen) from and co-linear with it. The variations shown in Fig. 3 and 4 were obtained. Whilst the frequency of the Σg vibration changes little with variation of the charge, both the Σu and Π show considerable sensitivity, the latter particularly so. When the charges increased to +1.5 (from zero) the Π frequency doubled. The effect on Σu maximised at a charge of +0.8 (with an increase of ca. 80 cm−1). The N–N bond-length variation was somewhat surprising; an initial small contraction (maximising at a charge of +0.3) was followed by an extension which approached 1% at a charge of +1.5.
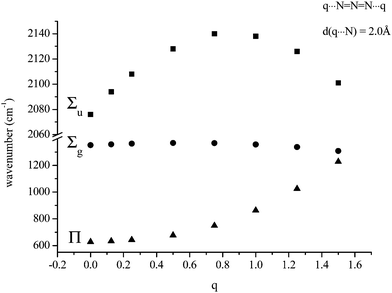 |
| | Fig. 3 Variation of calculated azide frequencies (cm−1) with variation of two equal charges, one at each end of the anion and co-linear with it (modeling an azide bridging two metal atoms). | |
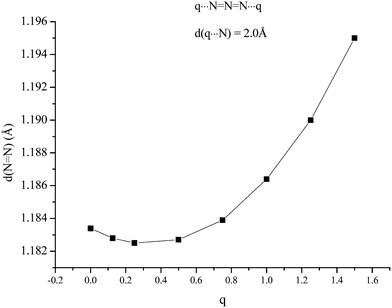 |
| | Fig. 4 Variation of N–N bond length (Å) with variation of two equal charges, one at each end of the anion and co-linear with it (modeling an azide bridging two metal atoms). | |
Metal-containing systems
It has been shown so far, that azide frequencies are sensitive to the charge and multipolar nature of the azide local environment. This conclusion makes understandable the failure to find clear correlations between observed vibrational frequencies and the mode of bonding of the azide anion. Such correlations are dependent of the absence of any charge-sensitivity. We then investigated metal-specific effects. Initially, we studied the interaction between a chosen metal atom, or set of atoms, with the azide ligand without any complication imposed by additional ligands. We first made a detailed study of the bonding between simple metal ions and the azide ligand in an ‘end-on’ arrangement where two different geometries are possible. Either the metal is co-linear with the azide, in a C∞v arrangement, or it is at an angle to it, the symmetry dropping to Cs. The latter geometry is the more important because it is also that commonly found when an azide bridges metal atoms. Some comments on the interactions which determine whether a C∞v or Cs arrangement is adopted by a MN3 unit (with M = Cu) will be found in Appendix 1.
Table 5 gives the results for DFT calculations on M(I) azides of first row transition metals and adjacent cations. It is clear that there are specific bonding effects; generally the M–N–N angle tends to decrease with increasing d electron count. However, the Mn compound, with the lowest calculated metal charge, is also linear. Again, the linear species tend to have the longest M–N3 bonds – but the linear Mn compound has the shortest.
Table 5 Vibrational frequencies (cm−1), atomic charges and molecular parameters (distances are in Å, angles in degrees) calculated by the DFT method for some M(I)N3 complexes
| |
K |
Ca |
Sc |
Ti |
V |
Cr |
Mn |
Fe |
Co |
Ni |
Cu |
Zn |
|
ν
as
|
2167 |
2220 |
2251 |
2241 |
2191 |
2205 |
2225 |
2170 |
2178 |
2165 |
2165 |
2161 |
|
ν
s
|
1397 |
1427 |
1456 |
1436 |
1381 |
1399 |
1430 |
1342 |
1375 |
1334 |
1345 |
1336 |
| π |
654 |
679 |
600 |
647 |
586 |
610 |
575 |
651 |
602 |
647 |
649 |
620 |
| π |
654 |
679 |
600 |
647 |
519 |
569 |
575 |
558 |
571 |
552 |
575 |
580 |
| 287 |
387 |
467 |
426 |
425 |
447 |
428 |
447 |
457 |
454 |
444 |
370 |
| 87 |
125 |
98 |
124 |
95 |
103 |
39 |
129 |
115 |
137 |
145 |
135 |
| 87 |
125 |
98 |
124 |
|
|
39 |
|
|
|
|
|
|
q
(M)
|
0.955 |
0.863 |
0.617 |
0.584 |
0.663 |
0.647 |
0.564 |
0.640 |
0.624 |
0.634 |
0.687 |
0.663 |
|
q
(N1)
|
−0.809 |
−0.879 |
−0.769 |
−0.729 |
−0.691 |
−0.673 |
−0.674 |
−0.660 |
−0.643 |
−0.664 |
−0.687 |
−0.700 |
|
q
(N2)
|
0.188 |
0.219 |
0.241 |
0.237 |
0.203 |
0.204 |
0.232 |
0.193 |
0.195 |
0.191 |
0.186 |
0.189 |
|
q
(N3)
|
−0.334 |
−0.203 |
−0.090 |
−0.092 |
−0.175 |
−0.179 |
−0.122 |
−0.173 |
−0.176 |
−0.162 |
−0.186 |
−0.152 |
| M–N–N |
180 |
180 |
180 |
180 |
149 |
143 |
180 |
131 |
138 |
127 |
124 |
124 |
| N–N–N |
180 |
180 |
180 |
180 |
175 |
176 |
180 |
174 |
176 |
174 |
174 |
176 |
|
d(M–N) |
2.379 |
2.138 |
1.913 |
1.893 |
1.901 |
1.883 |
1.802 |
1.846 |
1.799 |
1.816 |
1.845 |
1.943 |
There seems to be no strong dependence of frequency on any of the possibly relevant molecular quantities, such as metal or nitrogen atom charge or on bond lengths (although a correlation with bond length differences has been suggested for some species).3 The data support the suggestion that both electrostatics and bonding are of importance in determining the vibrational frequency exhibited by a coordinated azide ligand. General patterns are not to be expected.
Table 6 shows the results of calculations for [M(II)N3]+ cations. Linearity is rare and occurs for those with the largest calculated metal charge; these are also the species with the highest calculated asymmetric stretching frequency. Noteworthy is the Cu(II) compound. It has, by far, the lowest antisymmetric frequency and also the lowest calculated metal charge. The next lowest metal charge is exhibited by Ni, which also has the next lowest antisymmetric frequency. It would seem that these calculations show electrostatic effects beginning to dominate bonding.
Table 6 Vibrational frequencies (cm−1), atomic charges and molecular parameters (distances are in Å, angles in degrees) calculated by the DFT method for some M(II)N3 complexes
| |
Ca |
Sc |
Ti |
V |
Cr |
Mn |
Fe |
Co |
Ni |
Cu |
Zn |
|
ν
as
|
2260 |
2270 |
2238 |
2226 |
2230 |
2192 |
2195 |
2291 |
2086 |
1862 |
2154 |
|
ν
s
|
1416 |
1399 |
1279 |
1374 |
1433 |
1234 |
1285 |
1571 |
1295 |
1338 |
1239 |
| π |
665 |
579 |
520 |
538 |
560 |
570 |
568 |
663 |
594 |
568 |
620 |
| π |
665 |
579 |
501 |
517 |
521 |
485 |
483 |
507 |
476 |
459 |
527 |
| 473 |
512 |
442 |
491 |
494 |
460 |
476 |
500 |
443 |
353 |
429 |
| 154 |
141 |
115 |
81 |
95 |
127 |
103 |
122 |
113 |
109 |
183 |
| 154 |
141 |
|
|
|
|
|
|
|
|
|
|
q
(M)
|
1.744 |
1.478 |
1.313 |
1.374 |
1.341 |
1.179 |
1.166 |
1.111 |
1.020 |
0.986 |
1.329 |
|
q
(N1)
|
−0.991 |
−0.829 |
−0.719 |
−0.714 |
−0.644 |
−0.579 |
−0.564 |
−0.502 |
−0.412 |
−0.328 |
−0.634 |
|
q
(N2)
|
0.234 |
0.249 |
0.239 |
0.229 |
0.213 |
0.218 |
0.213 |
0.199 |
0.180 |
0.155 |
0.178 |
|
q
(N3)
|
−0.017 |
0.102 |
0.166 |
0.111 |
0.090 |
0.182 |
0.185 |
0.192 |
0.212 |
0.186 |
0.127 |
| M–N–N |
180 |
180 |
170 |
164 |
159 |
151 |
152 |
154 |
141 |
139 |
120 |
| N–N–N |
180 |
180 |
178 |
178 |
177 |
176 |
176 |
177 |
175 |
175 |
171 |
|
d(M–N) |
2.020 |
1.853 |
1.774 |
1.801 |
1.785 |
1.732 |
1.719 |
1.729 |
1.733 |
1.879 |
1.872 |
In Tables 5 and 6, copper azides stand apart. In Table 5, the Cu(I) compound, inter alia, has a remarkable balancing of calculated internal charges; its unique position in Table 6 has already been commented upon. We chose this metal for an investigation into other aspects of azide coordination, the bonding of more than one azide and azide as a bridging ligand. Table 7 shows the results of calculations on azide complexes of Cu(I) and Cu(II), along with the relevant data from either Tables 5 or 6. Several things are evident from this table. First, when there are two azide groups, all of the infrared intensity is confined to one of the resultant paired modes unless the molecular symmetry is very low. Second, this infrared active mode may be that at higher frequency or that at lower, there seems to be no evident rule. Thirdly, a charge effect seems to be operating, in that the frequencies of Cu+ species are higher than those of Cu2+, the infrared intensities are also greater. Fourthly, the frequencies of bridging azides are not very sensitive to the number of metal atoms bridged for an unchanged orientation of the azide. It is not possible to make meaningful comparisons between the data in Table 7 and experimental results. The data in Table 7 are unscaled, omit the other ligands which are part of the experimental data (and which will influence the formal charge on the Cu) and ignore the fact that many of the relevant compounds are polymeric. However, we note that Agrell3 reports data covering the range 2125–2030 cm−1 for simple species and more recent data fall in this range (for example,11 2045 cm−1). Data for single N-bonded Cu2(N3)2 bridge species show a similar range, (2137–2040 cm−1).12 Data on doubly N-bonded Cu2(N3)2 bridge species are more limited12e,13 and are near 2055 cm−1. However, this figure is surely deceptive in that one species with both types of bridge has frequencies at 2110 and 2115 cm−1.14 The data in Table 7 show the extreme vibrational frequency sensitivity of bare Cu-azide systems to the details of the geometric structure and electronic configuration. Experimental data indicate that addition of other ligands or increase in molecular unit size does nothing to simplify the situation.
Table 7 Calculated vibrational frequencies (cm−1) for some copper-azide complexes (upper, Cu+, lower, Cu2+). Where relevant, infrared intensities (kM mole−1) are given in brackets
| |

|

|

|

|

|

|
| CuN3 |
[Cu2N3]+ |
Cu2(N3)2 |
Cu2(N3)2 |
[Cu3N3]2+ |
[Cu4N3]3+ |
| Sym |
C
s
|
C
2v
|
D
2h
|
D
2h
|
C
3v
|
C
4v
|
|
ν
as
|
2165 |
2245 |
2229(0), 2212(2045) |
2158(1686), 2062(0) |
2265 |
2264 |
|
ν
s
|
1346 |
1250 |
1380(0), 1368(196) |
1360(0), 1357(1) |
1057 |
947 |
| π |
649 |
728 |
655(14), 654(0) |
676(0), 672(10) |
625 |
593 |
| π |
575 |
560 |
583(11), 580(0) |
598(8), 596(0) |
625 |
593 |
|
|
|
|

|
|
|
|
|
[CuN3]+ |
[Cu2N3]3+ |
[Cu2(N3)2]2+ |
[Cu2(N3)2]2+ |
[Cu3N3]5+ not optim. |
[Cu4N3]7+ imaginary freq. |
| Sym |
C
s
|
C
2v
|
C
2v
|
D
2h
|
C
3v
|
C
4v
|
|
ν
as
|
1862 |
1974 |
2156(29), 2151(51) |
1892(0), 1884(185) |
2245 |
|
|
ν
s
|
1338 |
1029 |
1135(47), 1128(123) |
1389(0), 1383(1) |
1105 |
|
| π |
568 |
598 |
608(7), 604(0) |
624(0), 611(2) |
573 |
|
| π |
459 |
421 |
575(3), 558(5) |
571(7), 494(0) |
567 |
|
We have considered in more detail the question of how, given a stoichiometry, the calculated vibrational frequencies vary with geometrical arrangement. Given that bonding will be particularly dependent on the metal chosen, we have opted for a system that will be rather ionic. This has the additional advantage that polar effects will not significantly be in competition with bonding and so should enable a second assessment of the importance of electrostatic effects. The system that we have chosen is, inevitably, somewhat artificial. It is Na2(N3)2. The basic configuration is shown in Fig. 5; it consists of two coplanar azides interleaved by two sodium cations. In a first set of calculations the distance between the central nitrogens of the azides was fixed and all other quantities optimised. The central N–N distance was varied from 3.83 to 4.83 Å, when the N–N–N angle of each azide decreased from 179 to 173°. The results are shown in Fig. 6. Both antisymmetric and symmetric frequencies are sensitive to the inter-azide separation. The symmetric modes appear uncoupled in that no splitting occurs, although the frequency varies (indicating the relevance of electrostatic effects). The antisymmetric modes couple strongly, with a coupling which is not strongly dependent on inter-azide separation. However, one antisymmetric mode is strong in the infrared, the other is calculated to have a zero intensity. Hence the infrared spectra of double azide bridges may be deceptively simple. The Raman are also surprising. The antisymmetric combination of antisymmetric stretches is invariably calculated to be the mode with greatest Raman intensity, greater than the sum of the intensities of the symmetric stretches. In a second set of calculations, in the configuration of Fig. 5 with the inter-azide distance fixed at 3.83 Å, the azides were rotated relative to each other, with the torsion angle varied in steps of 15°, as indicated in Fig. 7. The results are shown in Fig. 8. Both symmetric and antisymmetric modes show a frequency dependence; the latter behave as expected for dipolar behaviour – the coupling between the vibrators decreases to zero at a torsion angle of 90°. By this angle the antisymmetric combination of antisymmetric stretches has become very visible in the infrared but has lost Raman intensity; with a torsion greater than 30°, its intensity is less than the summed intensity of the symmetric stretches (at 30° they are calculated to be equal). Full details are given in Table 8.
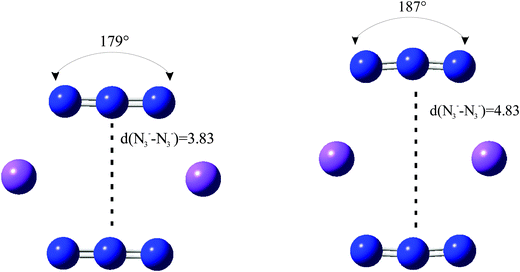 |
| | Fig. 5 The limiting arrangements of Na2(N3)2 considered in the text. The N3−–N3− distances (Å) were varied and all other geometrical parameters optimised. | |
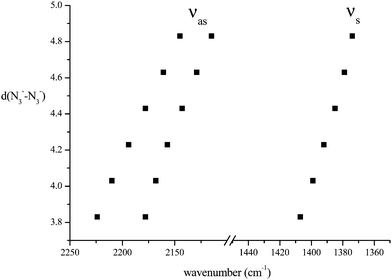 |
| | Fig. 6 Variation of azide stretching frequencies (cm−1) as the N3−–N3− separation (Å) is changed, for the arrangement shown in Fig. 5. | |
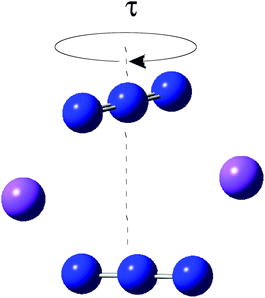 |
| | Fig. 7 Torsional variation (of τ in steps of 15°) of Na2(N3)2 with a central N⋯N separation of 3.83 Å. | |
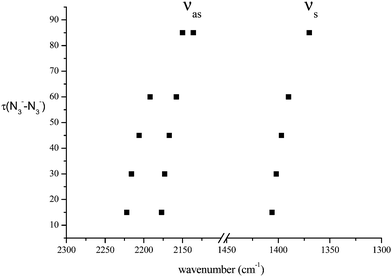 |
| | Fig. 8 Variation of azide stretching frequencies (cm−1) for the set of structures of Fig. 7. | |
Table 8 Frequency and intensity (infrared, Raman) data for a system of two coplanar azide groups, of D2h (azide–azide shift), D2 (azide–azide torsion) and C2h (azide–azide twist), symmetries in Na2(N3)2 (frequencies are in cm−1, infrared intensities in kM mole−1, Raman in Å4 amu−1)
| |
Azide–azide shift |
Azide–azide torsion |
Azide–azide slip |
| 0 |
0.2 |
0.4 |
0.6 |
0.8 |
1.0 |
15 |
30 |
45 |
60 |
85 |
0.2 |
0.4 |
0.6 |
0.8 |
1.0 |
|
ν
as
|
2224 (1602, 0) |
2210 (1613, 0) |
2194 (1626, 0) |
2178 (1643, 0) |
2161 (1668, 0) |
2145 (1702, 0) |
2222 (1582, 0) |
2216 (1526, 0) |
2206 (1438, 0.1) |
2193 (1320, 0.2) |
2150 (1023, 0.6) |
2226 (1609, 0) |
2224 (1627, 0.0) |
2225 (1652, 0.0) |
2222 (1667, 0.0) |
2221 (1697, 0.0) |
|
ν
as
|
2178 (0, 41) |
2168 (0, 43) |
2157 (0, 54) |
2143 (0, 66) |
2129 (0, 85) |
2115 (0, 114) |
2177 (21, 39) |
2173 (82, 36) |
2167 (177, 32) |
2158 (298, 27) |
2136 (575, 18) |
2181 (0.0, 39) |
2183 (0.0, 39) |
2188 (0.0, 38) |
2188 (0.0, 37) |
2192 (0.0, 37) |
|
ν
s
|
1407 (2.4, 0.6) |
1399 (2.4, 0) |
1392 (2.4, 0) |
1385 (1.9, 3.7) |
1379 (0, 39) |
1374 (0, 39) |
1406 (1.3, 16) |
1402 (1.3, 16) |
1397 (0.6, 25) |
1390 (0.9, 21) |
1371 (0.3, 30) |
1408 (2.4, 0) |
1409 (2.5, 0.0) |
1411 (2.4, 0.0) |
1411 (2.6, 0.0) |
1412 (2.4, 0.0) |
|
ν
s
|
1407 (0, 34) |
1399 (0, 36) |
1392 (0, 37) |
1385 (0.2, 34) |
1379 (1.8, 0) |
1374 (1.6, 0) |
1406 (1.1, 19) |
1402 (1.0, 20) |
1397 (1.6, 13) |
1389 (1.1, 19) |
1370 (2.2, 14) |
1408 (0, 36) |
1409 (0.0, 35) |
1411 (0.0, 36) |
1411 (0.0, 36) |
1412 (0.0, 36) |
| πs |
664 (0.0, 8.1) |
665 (0.0, 8.1) |
666 (0.0, 7.8) |
666 (0.0, 7.5) |
666 (0.0, 7.3) |
666 (0.0, 7.3) |
664 (0.1, 8.1) |
664 (0.01, 8.1) |
663 (0.36, 7.9) |
661 (0.1, 7.5) |
656 (0.35, 4.3) |
664 (0.0, 7.7) |
663 (0.0, 6.9) |
662 (0.0, 5.7) |
662 (0.0, 5.1) |
662 (0.0, 3.8) |
| πas |
662 (27, 0.0) |
664 (23, 0.0) |
665 (23, 0.0) |
665 (21, 0.0) |
665 (18, 0.0) |
665 (16, 0.0) |
662 (27, 0.17) |
661 (26, 0.48) |
660 (24, 1.0) |
658 (23, 1.4) |
653 (14, 1.0) |
662 (28, 0.0) |
660 (28, 0.0) |
659 (28, 0.0) |
658 (28, 0.0) |
658 (26, 0.0) |
| πs |
638 (17, 0.0) |
638 (17, 0.0) |
637 (17, 0.0) |
637 (17, 0.0) |
638 (17, 0.0) |
638 (16, 0.0) |
639 (16, 0.01) |
641 (15, 0.03) |
643 (14, 0.1) |
646 (12, 0.2) |
650 (7.1, 2.3) |
638 (17, 0.0) |
638 (17, 0.0) |
638 (18, 0.0) |
638 (18, 0.0) |
638 (18, 0.0) |
| πas |
637 (0, 1.4) |
637 (0, 1.4) |
636 (0, 1.4) |
637 (0, 1.4) |
637 (0, 1.4) |
638 (0, 1.5) |
637 (0.2, 1.4) |
Z639 (0.5, 1.2) |
642 (1.3, 1.0) |
645 (1.6, 0.8) |
650 (6.7, 0.7) |
637 (0.0, 1.4) |
637 (0.0, 1.5) |
636 (0.0, 1.7) |
637 (0.0, 1.8) |
637 (18, 0.0) |
In a further exploration of the effect of changes of azide geometry on frequency, we considered the case in which a D2h azide symmetry was not preserved by two azides in Na2(N3)2, only C2h. The system studied was that of Fig. 5 but with a sideways displacement, slip, of each azide in a direction along the N3 axis (Fig. 9). The Na⋯Na distance was held at 4.652 Å and the slip varied in steps of 0.2 Å. All geometries were optimised; the azide angle remained at 179° and the N–N distances changed by a maximum of 0.002 Å. The behaviour of the calculated frequencies is shown in Fig. 10. Slip has very little effect on frequencies. A slip of 1 Å only changes the stretching mode frequencies by ca. 10 cm−1; similarly the separation between the two modes increases by ca. 10 cm−1. These patterns will not show much spectral evidence. As for the first displacement considered above, only the higher frequency antisymmetric vibration is strong in the infrared; its lower frequency counterpart is the strongest Raman mode. The frequencies of the deformation modes of the two azides are almost independent of slip (not shown in Fig. 10 but detailed in Table 8). There is one additional important feature, common to all of the cases just considered. Coupling between the azides leads to only one member of each resultant pair having significant spectral activity, with consequent apparent spectral simplification.
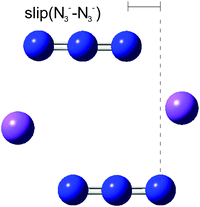 |
| | Fig. 9 The arrangement of Na2(N3)2 shown in Fig. 5 but with an additional sideways slip of the azides, retaining a centre of symmetry. | |
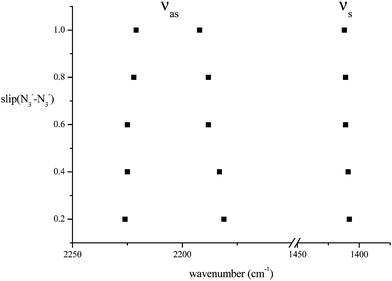 |
| | Fig. 10 The variation of azide stretching mode frequencies (cm−1) consequent upon slip of azide anions relative to each other in the arrangement of Fig. 9. | |
The above studies prompted another; to what extent is the presence of metal ion(s) – here Na+ – essential to the calculated patterns? We therefore carried out calculations on metal-free (and external charge-free) systems. Data were obtained on two coplanar and parallel azide anions, inter-related by a mirror plane reflection but with varying separation. The data obtained are given in Table 9, which is to be compared with the data in Fig. 6. The antisymmetric stretches couple, with a magnitude which decreases slowly with increased separation. However, only the higher frequency mode has any infrared activity, the lower is silent. Comparison with Fig. 6 shows that both the splitting and dependence of frequency on separation are significantly enhanced by the presence of metal ions. The symmetric stretches couple but neither split nor change frequency significantly. Comparison with Fig. 6 shows that the presence of metal ions does not affect this splitting, it is still zero, but does lead to a significant dependence of frequency on separation. Overall, these calculations confirm that bridge azides show a sensitivity to charge effects, just as do terminal azides.
Table 9 The variation of azide stretching mode frequencies (cm−1) with azide separation for two azides with overall D2h symmetry together with spectral activities (infrared in kM mole−1, Raman in Å4 amu−1)
|
d(az–az) (Å) |
3.43 |
3.63 |
3.83 |
4.03 |
4.23 |
4.43 |
4.63 |
4.83 |
|
ν
as
|
2170 (1138, 0) |
2170 (1173, 0) |
2169 (1187, 0) |
2168 (1207, 0) |
2167 (1225, 0) |
2167 (1240, 0) |
2167 (1254, 0) |
2166 (1265, 0) |
| 2136 (0, 0.2) |
2140 (0, 0.2) |
2144 (0, 0.2) |
2147 (0, 0.15) |
2150 (0, 0.13) |
2152 (0, 0.12) |
2153 (0, 0.10) |
2154 (0, 0.09) |
|
|
|
ν
s
|
1367 (0, 37) |
1366 (0, 38) |
1366 (0, 39) |
1366 (0, 39) |
1366 (0, 38) |
1366 (0, 23) |
1366 (0, 28) |
1366 (0, 24) |
| 1366 (0, 0) |
1366 (0, 0) |
1366 (0, 0) |
1366 (0, 0) |
1366 (0, 2.1) |
1366 (0, 18) |
1366 (0, 13) |
1366 (0, 18) |
To investigate isolated azides further, and in particular the vibrational coupling between them, we have studied sets of these anions, placed as close together as is possible for stability (a c. of g. separation of 5.18 Å was used). The detailed results are given in the Deposited Document. When the n azides were parallel to a common Cn axis, a remarkable result was obtained. With n = 2, antisymmetric stretching modes at 2165 and 2155 cm−1 were obtained. With n = 5 the highest frequency mode was at 2167 and the lowest at 2153 cm−1. The patterns for n = 3 and 4 were similar; there was a splitting of 12 ± 2 cm−1 independent of n, weak coupling seems indicated. For all cases, the symmetric stretching modes were ostensibly uncoupled, consisting of n superimposed modes at 1365 (n = 2) or 1366 (n = 3, 4, 5) cm−1. However, the intensities tell a different story; all of the Raman activity is confined to a single mode, that at highest frequency. Similarly, the highest frequency antisymmetric mode was the only one with infrared intensity. That is, vibrational spectroscopy is blind to the presence of multiple parallel azide groups, notwithstanding the fact that they are coupled. A very different pattern is obtained when the azide groups are co-planar. All frequencies are sensitive to n; as n increases, so frequencies decrease. So, from n = 3 to 5 the highest frequency (Raman active) antisymmetric stretching mode decreases from 2105 to 2068 cm−1 (the degenerate, infrared active, antisymmetric stretching modes drop from 2085 to 2041 cm−1). The Raman active highest frequency symmetric stretch decreases from 1322 (n = 3) to 1273 (n = 5) cm−1. As n increases so the overall frequency range increases. So, for n = 3, the spread of asymmetric frequencies is 22 cm−1 but for n = 5 it is 55 cm−1. The symmetric stretch behaves similarly, but with a smaller spread. The conclusion is clear. Both parallel and co-planar azide anions interact vibrationally, even when physically well separated. Whilst that between parallel azides is essentially constant, that between co-planar azides varies considerably.
All of the above work refers either to individual azides or to sets, the members of which are symmetry-related. We have also studied two systems with symmetry distinct species, one with two and the other with three different azides; both are copper systems, one Cu+ (Cs symmetry), the other Cu2+ (C2h symmetry). They are shown in Fig. 11, where the optimized geometries are given. The results are detailed in Table 10. It is evident that zeroth-order frequencies are important. Only the vibrations of symmetry-related azide groups couple. So, in the Cu+ species, B and B′ couple – but there is no significant coupling between A and A′ or between either A and the B's. Although the coupling may lead to a small splitting, always less than 10 cm−1, it can lead to a total transfer of spectral intensity. So, for the Cu2+ species each mode has a zero intensity for one activity. This, of course, is nothing more than the consequence of the centre of symmetry, but the pattern for the Cu+ compound is not dissimilar and in it may lie the, otherwise surprising, different activities of the two highest frequency modes of this compound.
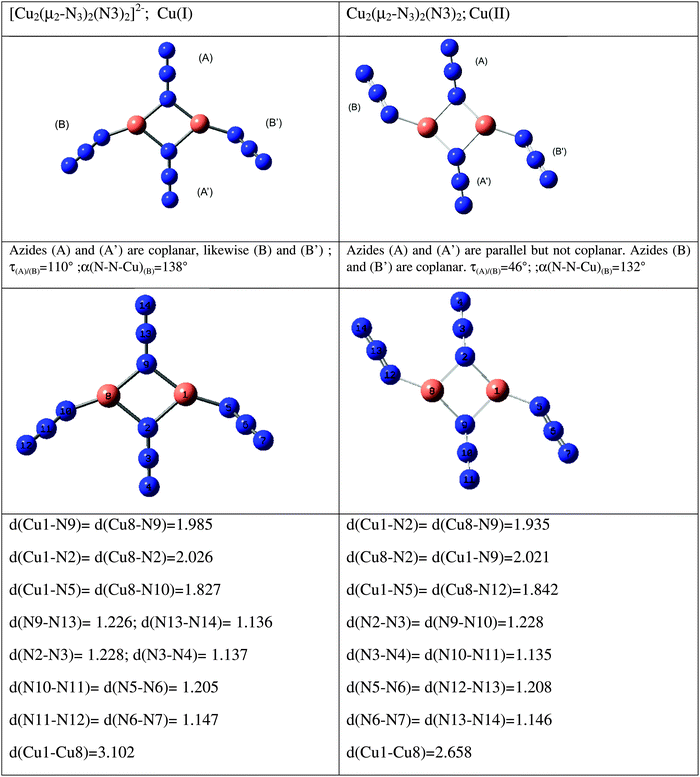 |
| | Fig. 11 Species containing symmetry non-related azides (distances are in Å, angles in degrees). | |
Table 10 Frequency and spectral activity data for the azide vibrational modes of the two model species shown in Fig. 11; Cu+ left, Cu2+ right. Here, A and B refer to the azide groups of Fig. 11 (upper) and so enable the parentage of mixed modes to be determined (frequencies are in cm−1, infrared in kM mole−1, Raman in Å4 amu−1)
| |
Freq (IR, Raman) |
Analysis of normal modes |
|
Freq (IR, Raman) |
Analysis of normal modes |
|
ν
as
|
2187 (671, 1036) |
(A) |
ν
as
|
2193 (0, 1179) |
(A) − (A′) |
|
ν
as
|
2134 (457, 296) |
(A′) |
ν
as
|
2190 (1375, 0) |
(A) + (A′) |
|
ν
as
|
2123 (575, 2489) |
(B) + (B′) |
ν
as
|
2117 (0, 2684) |
(B) − (B′) |
|
ν
as
|
2116 (1343, 881) |
(B) − (B′) |
ν
as
|
2114 (1525, 0) |
(B) + (B′) |
|
ν
s
|
1394 (54, 4) |
(B) + (B′) |
ν
s
|
1377 (0, 15) |
(B) + (B′) |
|
ν
s
|
1393 (126, 0.1) |
(B) − (B′) |
ν
s
|
1376 (174, 0) |
(B) − (B′) |
|
ν
s
|
1315 (124, 37) |
(A) |
ν
s
|
1316 (0, 15) |
(A) + (A′) |
|
ν
s
|
1277 (130, 48) |
(A′) |
ν
s
|
1309 (249, 0) |
(A) − (A′) |
| π |
730 (1, 0.6) |
(A) |
π |
635 (33, 0) |
[(B) + (B′)] − [(A) + (A′)] |
| π |
689 (0.3, 0.7) |
(A′) |
π |
631 (0, 25) |
[(B) − (B′)] − [(A) − (A′)] |
| π |
621 (9, 15) |
(B) + (B′) |
π |
626 (0, 4) |
[(A) − (A′)] + [(B) − (B′)] |
| π |
619 (16, 3) |
(B) − (B′) |
π |
619 (11, 0) |
[(A) + (A′)] + [ (B) + (B′)] |
| π |
593 (4, 1) |
(A) |
π |
601 (0, 22) |
(A) − (A′) |
| π |
586 (6, 0.6) |
(A′) |
π |
597 (14, 0) |
(A) + (A′) |
| π |
567 (14, 2) |
(B) + (B′) |
π |
577 (9, 0) |
(B) + (B′) |
| π |
567 (4, 1) |
(B) − (B′) |
π |
577 (0, 4) |
(B) − (B′) |
The last study that we have made concerns the vibrational consequences of adding further simple ligands to the system. The species studied and the results are given in Table 11. The species are given in more detail in the Deposited Document. The cyanide anion has been chosen for Ni2+, Zn2+ (in both cases with three cyanides but only one azide) and Cu+. Cu+ with NH3 as co-ligand has also been studied. Included in the table are data on Cu2+ with Cl− and Br− as co-ligands. They differ little from those involving Cu+. Formal valence states are perhaps less important than formal charge. The results testify to the unpredictability of azide as a ligand. So, although [NiN3]− has its antisymmetric stretching mode at 2086 cm−1 and that of [Ni(CN)3N3]2− is at 2147 cm−1, the data for the corresponding Zn2+ species are 2154 and 2157 cm−1 respectively. In contrast, the frequency change on the symmetric stretch is the greater for the zinc species (159 as compared to 103 cm−1). For the (split) deformation modes, one increases and one decreases in frequency for Ni2+ whilst for Zn2+ both increase. For Cu+ the picture is much simpler. All of the additional ligands that we have studied lead to an increase in frequency of both symmetric and antisymmetric azide vibrational frequencies. The deformations behave less regularly but the frequency changes are not great, maximum values were 13 and 24 cm−1. Three of the molecules in Table 11 contain both CN− and N3−, ions which might be expected to couple vibrationally. In the Ni complex, there is a weak coupling between all of the cyanide modes and the azide antisymmetric stretch; the mixing with the totally symmetric cyanide mode (νCN = 0 cm−1) is the greatest but remains very small. For the corresponding Zn complex the coupling pattern is similar but even smaller (νCN = 2216 cm−1). Even for the Cu complex, where the anions are almost co-linear, the coupling is small (νCN = 2273 cm−1). These results probably serve to remove one ambiguity. When the azide anion is coordinated together with other ligands with which it might vibrationally couple, this coupling can normally be ignored.
Table 11 DFT results for [MN3]n+ and related mixed-ligand complexes
| |
Ni(II)Az |
[Ni(CN)3Az]2− |
Zn(II)Az |
[Zn(CN)3Az]2− |
Cu(I)Az |
[CuCNAz]− |
CuNH3Az |
CuClAz |
CuBrAz |
|
ν
as
|
2086 |
2147 |
2154 |
2157 |
2165 |
2185 |
2196 |
2174 |
2173 |
|
ν
s
|
1295 |
1398 |
1239 |
1398 |
1345 |
1412 |
1392 |
1400 |
1398 |
| π |
594 |
659 |
620 |
654 |
649 |
636 |
651 |
640 |
641 |
| π |
476 |
322 |
527 |
628 |
575 |
599 |
587 |
598 |
598 |
| 443 |
614 |
429 |
282 |
444 |
470 |
499 |
425 |
408 |
| 113 |
190 |
183 |
130 |
145 |
131 |
166 |
149 |
137 |
|
q
(M)
|
1.020 |
−0.061 |
1.329 |
0.654 |
0.687 |
0.450 |
0.560 |
0.491 |
0.464 |
|
q
(N1)
|
−0.412 |
−0.400 |
−0.634 |
−0.519 |
−0.687 |
−0.602 |
−0.653 |
−0.600 |
−0.502 |
|
q
(N2)
|
0.180 |
0.200 |
0.178 |
0.199 |
0.186 |
0.200 |
0.201 |
0.194 |
0.194 |
|
q
(N3)
|
0.212 |
−0.427 |
0.127 |
−0.445 |
−0.186 |
−0.361 |
−0.250 |
−0.374 |
−0.370 |
| M–N–N |
141 |
138 |
120 |
138 |
124 |
141 |
132 |
137 |
137 |
| N–N–N |
175 |
175 |
171 |
177 |
174 |
176 |
176 |
176 |
176 |
|
d(M–N) |
1.733 |
1.950 |
1.872 |
2.080 |
1.845 |
1.868 |
1.829 |
1.870 |
1.874 |
Conclusions
The motivation for the present study was an attempt to understand the apparent lack of correlation between geometric environment and vibrational characteristics of the azide anion. Whilst our conclusion is that no immediate correlation is to be expected, we believe that a much better understanding has emerged. Firstly, proximate azide groups are normally vibrationally coupled. This coupling is probably dipolar in nature and it attenuates as the molecular complexity increases. The existence of this coupling means that the vibrational spectra might reasonably be expected to be good indicators of molecular geometry. There are two features mitigating against this indication. First, azide vibrations are sensitive to the polar, dipolar and quadrupolar nature of their local environment. This means that the observed frequency is not a unique indicator of coordination geometry in the same way that it is for the coordinated CO group. Both CO and N3− show vibrational coupling but the charge on the azide ion makes its observed frequencies almost useless as indicators. The second problem is that of intensities. When, for instance, the azide antisymmetric stretch is split, almost all of the infrared intensity is concentrated in a single component unless the molecular symmetry is very low. Simple group-theoretical analyses coupled with band counting will not give molecular geometries, again a difference from the CO ligand. Reports of Raman studies are rare and perhaps our calculations explain why. The symmetric stretch mode of the coordinated azide group has a surprisingly low Raman intensity and a reliable assignment of it in the presence of additional ligands of any complexity is improbable. Also surprisingly, it would seem that a formally infrared active, but essentially silent, antisymmetric stretching mode may reveal its presence in a Raman spectrum, sometimes having a greater intensity than the symmetric components combined.
Finally, it possible to suggest the way forward to a better understanding of the vibrational spectra of the azide ligand. Firstly, it would normally be sensible to ignore the actual observed frequencies (the exception is when closely related compounds are involved). The general pattern is of more significance. Secondly, combined infrared and Raman data may enable the use of a simple group-theoretical analysis in the 2100 cm−1 region. Infrared data alone are unlikely to be sufficient. Thirdly, whilst the 1400 cm−1 region should be studied, it is probable that only in those cases where an understanding of the antisymmetric stretch region has already been achieved that such a study will itself give useful data. However, our, pessimistic, general conclusion is that vibrational spectroscopy will seldom give reliable insights into the geometric disposition of azide groups within a complex, unless it be for a set of closely related compounds.
Appendix
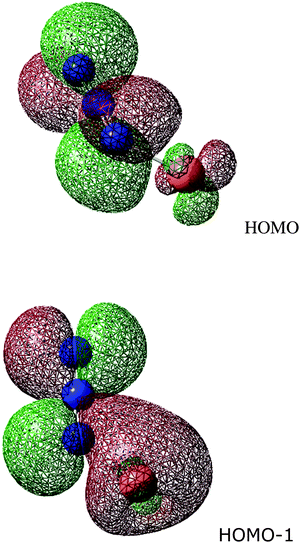
The figure shows the HOMO and HOMO−1 in the Cu(I)-azide system, which is calculated to be bent with a N–N–Cu angle of 124°. Whilst the HOMO shows a π interaction between Cu and terminal nitrogen, this has both bonding and antibonding components. It would seem equally appropriate for a linear molecule; certainly, it offers no explanation for the greater stability of a bent. The most important contributor to this preference is HOMO−1. It has a dominant Cu σ interaction with one lobe of a N–N π bonding orbital.
References
- G. Leibeling, S. Demeshko, B. Bauer-Siebenlist, F. Meyer and H. Pritzkow, Eur. J. Inorg. Chem., 2004, 24132420 Search PubMed.
- I. Agrell, Acta Chem. Scand., 1971, 25, 2965–2974 CrossRef CAS.
- P. Gray and T. C. Waddington, Trans. Faraday Soc., 1957, 53, 901–908 RSC.
- Z. Dori and R. F. Ziolo, Chem. Rev., 1973, 73, 247–254 CrossRef CAS.
- F. A. Mautner, F. R. Louker, J. Hofer, M. Spell, A. Lefèvre, A. E. Guilbeau and S. S. Massoud, Cryst. Growth Des., 2013, 13, 4518–4525 CAS.
-
K. Nakamoto, Infrared and Raman spectra of inorganic and coordination compounds, John Wiley & Sons, New York, 1986 Search PubMed.
-
(a) S. F. A. Kettle, E. Diana, E. M. C. Marchese, E. Boccaleri, G. Croce, T. Sheng and P. L. Stanghellini, Eur. J. Inorg. Chem., 2010, 3920–3929 CrossRef CAS;
(b) S. F. A. Kettle, G. L. Aschero, E. Diana, R. Rossetti and P. L. Stanghellini, Inorg. Chem., 2006, 45, 4928–4937 CrossRef CAS PubMed;
(c) S. F. A. Kettle, E. Diana, E. Boccaleri and P. L. Stanghellini, Inorg. Chem., 2007, 46, 2409–2416 CrossRef CAS PubMed.
-
(a) A. Schulz, I. C. Tornieporth-Oetting and T. M. Klapotke, Inorg. Chem., 1995, 34, 4343–4346 CrossRef CAS;
(b) A. K. Kandalam, M. A. Blanco and R. Pandey, J. Phys. Chem. B, 2001, 105, 6080–6084 CrossRef CAS;
(c) J. O. Jensen, Spectrochim. Acta, Part A, 2003, 59, 2805–2814 CrossRef;
(d) R. Haiges, J. A. Boatz, S. Schneider, T. Schroer, M. Yousufuddin and K. O. Christe, Angew. Chem., Int. Ed., 2004, 43, 3148–3152 CrossRef CAS PubMed;
(e) Q. S. Li and H. X. Duan, J. Phys. Chem. A, 2005, 109, 9089–9094 CrossRef CAS PubMed;
(f) R. Haiges, J. A. Boatz, R. Bau, S. Schneider, T. Schroer, M. Yousufuddin and K. O. Christe, Angew. Chem., Int. Ed., 2005, 44, 2–6 CrossRef PubMed;
(g) J. S. Ogden, J. M. Dyke, W. Levason, F. Ferrante and L. Gagliard, Chem. – Eur. J., 2006, 12, 3580–3586 CrossRef CAS PubMed;
(h) S. Afyonb, P. Höhna, M. Armbrüstera, A. Baranova, F. R. Wagnera, M. Somerb and R. Kniepa, Z. Anorg. Allg. Chem., 2006, 632, 1671–1680 CrossRef;
(i) R. Haiges, J. A. Boatz, T. Schroer, M. Yousufuddin and K. O. Christe, Angew. Chem., Int. Ed., 2006, 45, 4830–4835 CrossRef CAS PubMed;
(j) R. Haiges, J. A. Boatz and K. O. Christe, Angew. Chem., Int. Ed., 2010, 49, 8008–8012 CrossRef CAS PubMed;
(k) A. Schulz and A. Villinger, Chem. – Eur. J., 2012, 18, 2902–2911 CrossRef CAS PubMed;
(l) A. Villinger and A. Schulz, Angew. Chem., Int. Ed., 2010, 49, 8017–8020 CrossRef CAS PubMed;
(m) K. Rosenstengel, A. Schulz and A. Villinger, Inorg. Chem., 2013, 52, 6110–6126 CrossRef CAS PubMed;
(n) R. Haiges, M. Rahm, D. A. Dixon, E. B. Garner and K. O. Christe, Inorg. Chem., 2012, 51, 1127–1141 CrossRef CAS PubMed;
(o) B. Lyhs, D. Bläser, C. Wölper, S. Schulz, R. Haack and G. Jansen, Inorg. Chem., 2013, 52, 7236–7241 CrossRef CAS PubMed;
(p) R. Haiges, M. Rahm and K. O. Christe, Inorg. Chem., 2013, 52, 402–414 CrossRef CAS PubMed;
(q) B. Shaabani, B. Mirtamizdoust, M. Shadman and H. K. Fun, Z. Anorg. Allg. Chem., 2009, 635, 2642–2647 CAS;
(r) B. Lyhs, D. Bläser, C. Wölper, S. Schulz and G. Jansen, Inorg. Chem., 2012, 51, 5897–5902 CrossRef CAS PubMed;
(s) H. Lund, O. Oeckler, T. Schröder, A. Schulz and A. Villinger, Angew. Chem., Int. Ed., 2013, 52, 10900–10904 CrossRef CAS PubMed;
(t) T. M. Klapötke and A. Schulz, Struct. Chem., 1997, 8(6), 421–423 CrossRef;
(u) A. Schulz and T. M. Klapötke, Inorg. Chem., 1997, 36, 1929–1933 CrossRef CAS PubMed;
(v) T. M. Klapötke, Chem. Ber., 1997, 130(4), 443–452 CrossRef;
(w) T. M. Klapötke and A. Schulz, Inorg. Chem., 1996, 35, 4995–4998 CrossRef;
(x) Y. Fan and M. B. Hall, Chem. – Eur. J., 2004, 10, 1805–1814 CrossRef CAS PubMed.
-
M. J. Frisch, et al., Gaussian 09, Revision A.01, Gaussian, Inc., Wallingford, CT, 2009 Search PubMed.
-
(a) J. F. Griffi and P. Coppens, J. Chem. Soc. D, 1971, 502–503 RSC;
(b) O. Reckeweg and A. Z. Simon, Naturforscher, 2003, 58b, 1097–1104 Search PubMed.
- S. S. Massoud, F. A. Mautner, M. A. M. Abu-Youssef and N. M. Shuaib, Polyhedron, 1999, 18, 2061–2067 CrossRef CAS.
-
(a) M. Zbiri, S. Saha, C. Adhikary, S. Chaudhuri, C. Daul and S. Koner, Inorg. Chim. Acta, 2006, 359, 1193–1199 CrossRef CAS;
(b) S.-Q. Bai, E.-Q. Gao, Z. He and C.-H. Yan, New J. Chem., 2005, 29, 935–941 RSC;
(c) W. Dong, Y. Ouyang, D.-Z. Liao, S.-P. Yan, P. Cheng and Z.-H. Jiang, Inorg. Chim. Acta, 2006, 359, 3363–3366 CrossRef CAS;
(d) D. Ghoshal, T. K. Maji, G. Rosair and G. Mostafa, Acta Crystallogr., Sect. C: Cryst. Struct. Commun., 2004, 60, m212–m214 Search PubMed;
(e) S. Chattopadhyay, M. S. Ray, M. G. B. Drew, A. Figuerola, C. Diaz and A. Ghosh, Polyhedron, 2006, 25, 2241–2253 CrossRef CAS.
- S. S. Massoud and F. A. Mautner, Inorg. Chim. Acta, 2005, 358, 3334–3340 CrossRef CAS.
- M. A. M. Abu-Youssef, A. Escuer, M. A. S. Goher, F. A. Mautner and R. Vicente, Eur. J. Inorg. Chem., 1999, 687–691 CrossRef CAS.
|
| This journal is © the Owner Societies 2016 |
Click here to see how this site uses Cookies. View our privacy policy here. 


