 Open Access Article
Creative Commons Attribution 3.0 Unported Licence
New insights into UTSA-16†
Alessio
Masala
a,
Jenny G.
Vitillo
a,
Francesca
Bonino
a,
Maela
Manzoli
a,
Carlos A.
Grande
b and
Silvia
Bordiga
*a
aDepartment of Chemistry, NIS and Reference INSTM Center, Via G. Quarello 15, 10135 Torino, Italy. E-mail: silvia.bordiga@unito.it
bSINTEF Materials and Chemistry, P.O. Box 124 Blindern, N0314 Oslo, Norway
First published on 12th November 2015
Abstract
Among the metal organic framework materials proposed for CO2 separation, UTSA-16 possesses the highest CO2 volumetric density explained on the basis of favourable interactions between CO2 and structural water molecules in the material, as revealed by neutron diffraction. In this study, UTSA-16 was synthesised and extensively characterised by XRD, TEM combined with EDX analysis and DR-UV-Vis, Raman and FTIR spectroscopies, as well as by TGA measurements. The synthesised material shows XRD patterns, surface area, CO2 capacity and isosteric heat coincident to the ones reported for UTSA-16 in the original papers but a higher thermal stability and a complete removal of water upon activation under mild conditions (363 K). On the basis of EDX and IR measurements, the formula of UTSA-16 used in the present study is proposed to be K2Co3(cit)2. Infrared spectroscopy clearly shows that UTSA-16 described in this work reversibly interacts with water vapor, CO and CO2. The interaction is attributed to K+ species, which are present as counterions in the pores. At 1 bar and 298 K a fraction of K+ sites adsorbs 2 CO2 molecules.
Introduction
CO2 adsorption capacities, both gravimetric and volumetric, are critical parameters to evaluate the working performances of a solid adsorbent used as a CO2 separator in carbon dioxide capture and separation (CCS) plants,1,2 as they directly impact the energy requirements for the desorption of captured CO2 influencing the material regeneration costs. For practical applications, such as the separation of CO2/N2 gases in post-combustion capture processes, high volumetric CO2 adsorption capacity and small specific heat capacity are very important factors to be considered in order to fully utilize the fixed-bed space and minimize the energy regeneration costs.3,4 To a great extent, adsorption capacity depends on the nature of the adsorbate, the nature of the pores in the adsorbent, and on the working conditions (such as temperature and pressure of the gas mixture).2 At low pressure, the quadrupole moment of carbon dioxide promotes its capture thanks to the presence of polar functional groups, unsaturated metal centres (or open metal sites, OMSs)1 or extra-framework cations. Note that the presence of functional groups occasionally declines the porosity and the CO2 uptake capacity. In practice best performances are expected in the case of materials with various functional sites characterized by moderate interactions between the CO2 molecule and the adsorbent surfaces, showing an improved selective capacity and keeping down regeneration costs.UTSA-16, as described in the original paper, has a 3-D anatase-type structure constituted of tetrahedral Co(II) atoms linked to tetranuclear cobalt citrate clusters in octahedral geometry, each one surrounded by four potassium ions that are hosted inside the material pores.5 Each K+ ion coordinates two structural water molecules. Around them, two hydroxyl groups belonging to –COOH groups of the citrate units would be present conferring to the site a particularly interesting reactivity. The empirical formula of UTSA-16 is then K(H2O)2Co3(cit)(Hcit) (with cit = fully dehydroxylated citrate anion (4−) and Hcit = citrate anion (3−)).5,6 The final tridimensional structure is characterized by open straight channels along the x direction (Fig. 1a), while the framework is quite dense along the z direction (Fig. 1b).
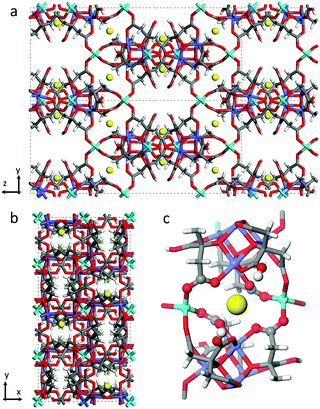 | ||
| Fig. 1 Structure of [K(H2O)2Co3(cit)(Hcit)] UTSA-16 as in ref. 5 (a) View along x and (b) z axes. (c) View on the first coordination shell of K+ atoms. Water molecules have been omitted. The elements have been reported according to the following colour code: carbon (grey), hydrogen (white), oxygen (red), cobalt (light blue for tetrahedral Co2+, violet for octahedral Co2+), potassium (yellow). | ||
Since its discovery, UTSA-16 has attracted interest not only for its magnetic properties5 but also as a selective adsorbent for CO2 in post-combustion emission treatments.6 Moreover, thanks to its high density (zeolite-like) UTSA-16 has been proposed in the purification of hydrogen from steam methane reforming (SMR) off-gases,7 and mixed with graphene oxide (GO) for biogas decarburization (the UTSA-16–GO19 composite has a CO2/CH4 selectivity of 114.4).8
In the case of pure UTSA-16, nice performances in volumetric CO2 uptake (160 cm3 cm−3 at 1 bar and 298 K)6 have been illustrated on the basis of the presence of suitable pore/cage space where structural water molecules directly interact with CO2 molecules enforcing high separation selectivity and capacity, while no specific role has been ascribed to the presence of K+ species. The good performances of UTSA-16, combined with the fact that it can be efficiently formulated in extrudates able to keep most of the pure powder properties, open good perspectives in the use of this material for practical applications.9
The present work reports detailed characterization of the UTSA-16 material aiming to describe its structural features when it is used to adsorb CO2 at low pressure and at room temperature.
Results and discussion
UTSA-16 was synthesized following the recipe previously reported5 and shortly described in the Experimental section. Crystallinity and phase purity have been checked by Powder X-Ray Diffraction (P-XRD) as reported in Fig. S1 in the ESI.† The comparison of the two patterns, collected in 0.8 mm capillaries on the as-synthesized sample (grey curve) and on the sample activated in a high vacuum at 363 K over night (violet curve), testifies no loss in crystallinity. The simulated P-XRD pattern of single crystal UTSA-16 (light grey curve) reported in ref. 5 corresponds to the two patterns. The total volume of pores and Langmuir surface area as calculated from volumetric N2 adsorption isotherms at 77 K, as reported in Table 1, indicated a full agreement with those reported in the original paper.| Langmuir surface area (m2 g−1) | BET surface area (m2 g−1) | Total volume of pores (cm3 g−1) | |
|---|---|---|---|
| Present work | 904 | 687 | 0.32 |
| Xiang et al.8 | 939 | 628 | 0.31 |
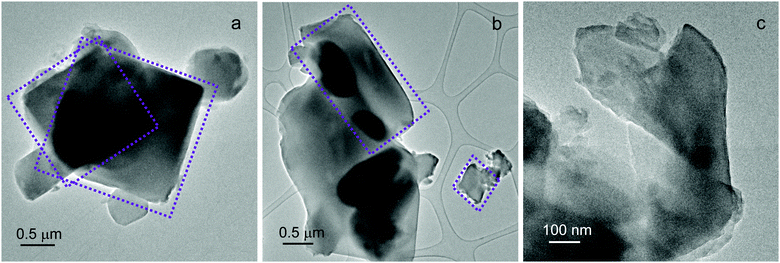
Additional insights into UTSA-16 morphology and chemical composition were obtained by Transmission Electron Microscopy (TEM) coupled with EDX analysis. UTSA-16 exhibits heterogeneous particle shapes, as reported in Fig. 2.
Different from other MOFs whose observation under the TEM beam is difficult or even impossible,10 UTSA-16 crystals remain largely intact even during a prolonged observation under the 300 kV electron beam at low-magnification, as shown in Fig. 2c. In addition, an accurate compositional evaluation was carried out by EDX analysis. Over 21 spectra were acquired throughout the sample (Table S1, ESI†). A K![[thin space (1/6-em)]](https://www.rsc.org/images/entities/char_2009.gif) :
:![[thin space (1/6-em)]](https://www.rsc.org/images/entities/char_2009.gif) Co average ratio of 1
Co average ratio of 1![[thin space (1/6-em)]](https://www.rsc.org/images/entities/char_2009.gif) :
:![[thin space (1/6-em)]](https://www.rsc.org/images/entities/char_2009.gif) 1.34 was obtained, that is significantly higher than 1
1.34 was obtained, that is significantly higher than 1![[thin space (1/6-em)]](https://www.rsc.org/images/entities/char_2009.gif) :
:![[thin space (1/6-em)]](https://www.rsc.org/images/entities/char_2009.gif) 3 reported by Xiang et al.5,6
3 reported by Xiang et al.5,6
Bright purple-violet colour of UTSA-16 does not substantially change upon activation in a vacuum or in an inert flux. This colour is associated with the presence of Co2+ in two different coordination geometries.
The diffuse Reflectance (DR) UV-Vis-NIR spectrum of as-synthesized UTSA-16 (Fig. 3) is dominated by two doublets at about 500 and 1250 nm ascribable to d–d transitions of Co(II) species and a ligand to metal charge transfer transition O → Co(II) at 236 nm. For what concerns the d–d transitions, the maxima at 519 and 1131 nm are associated with octahedral Co(II) sites (in Fig. 3 the cubic arrangement of these species is reported using the colour code used in Fig. 1), while the maxima at 567 and 1514 nm are associated with tetrahedral coordinated Co(II) species.11
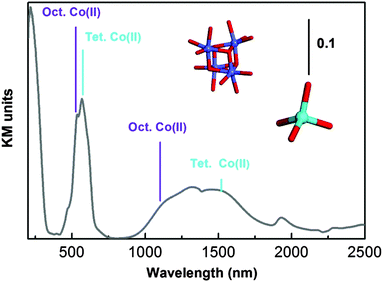 | ||
| Fig. 3 UV-Vis absorption spectrum of as-synthesized UTSA-16 diluted in Teflon. Local symmetry of Co(II) is illustrated using the same colour code used in Fig. 1. | ||
Since measurements were recorded in the diffuse reflectance mode, caution in describing the spectra at more than a qualitative level (in particular with respect to the intensity ratio among the different bands) is requested. In fact band intensities in the NIR and Visible regions are naturally enhanced, with respect to those falling in the ultraviolet range, as the amount of material sampled is larger.
As already mentioned, UTSA-16 colour does not change upon activation treatment: a comparison of the as-synthesized and activated sample is reported in the ESI† (Fig. S2). The fact that optical transitions of UTSA-16 do not undergo any change upon solvent removal is completely explained by the fact that Co(II) sites are fully coordinated by citrate ligands (see Fig. 1) whose number and nature within the first coordination sphere do not change upon adsorption/desorption of species hosted in the pores.
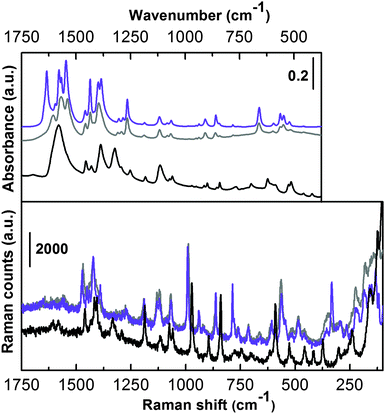
The vibrational counterpart is illustrated in Fig. 4, where Raman (bottom) and IR spectra in the ATR mode (top) of the as-synthesized (grey curves) and activated UTSA-16 (violet curves) are reported.
In order to simplify the assignment, IR and Raman spectra of potassium citrate monohydrate (black curves) have also been reported. The spectra are shown only in the low frequency range where the MOF framework modes are present. These two techniques (ATR-IR and Raman) are not sensitive in the 4000–3000 cm−1 range where signals relative to –OH and –CH stretching are present. This region was characterized by means of IR in the transmission mode and is extensively discussed below. The vibrational spectrum of UTSA-16 is quite similar to that collected in the case of the reference compound and does not substantially change upon prolonged activation in a high vacuum till 363 K. By focusing the attention on the most relevant vibrational fingerprints, only IR spectra in the 1670–1500 cm−1 range clearly present the bands due to the νasym(COO−) mode.12,13 No bands ascribable to protonated –COOH groups are present, ruling out the presence of Hcit in the structure and all the citrate ligands being fully deprotonated in the material under study. In accordance with that, EDX analysis indicated a K![[thin space (1/6-em)]](https://www.rsc.org/images/entities/char_2009.gif) :
:![[thin space (1/6-em)]](https://www.rsc.org/images/entities/char_2009.gif) Co ratio of about 1
Co ratio of about 1![[thin space (1/6-em)]](https://www.rsc.org/images/entities/char_2009.gif) :
:![[thin space (1/6-em)]](https://www.rsc.org/images/entities/char_2009.gif) 1.3, suggesting that a possible empirical formula of UTSA-16 here characterized would be K2Co3(cit)2. In the case of potassium citrate monohydrate the infrared spectrum shows a single broad band centred at 1580 cm−1 while, in the case of UTSA-16 we observe the appearance of a more complex absorption with different maxima ascribable to the perturbation of the citrate unit, when present as the organic ligand in UTSA-16. Moreover, the presence of Co2+ replacing K+ implies the appearance of a component at higher frequency, maximum at 1608 cm−1 (grey line).
1.3, suggesting that a possible empirical formula of UTSA-16 here characterized would be K2Co3(cit)2. In the case of potassium citrate monohydrate the infrared spectrum shows a single broad band centred at 1580 cm−1 while, in the case of UTSA-16 we observe the appearance of a more complex absorption with different maxima ascribable to the perturbation of the citrate unit, when present as the organic ligand in UTSA-16. Moreover, the presence of Co2+ replacing K+ implies the appearance of a component at higher frequency, maximum at 1608 cm−1 (grey line).
The infrared spectrum slightly changes in that region when UTSA-16 undergoes activation in a vacuum (violet line), showing sharper and splitted bands. In particular, the component at 1608 cm−1 upward shifts to 1634 cm−1 and becomes significantly more intense. This is most probably due to the fact that upon solvent removal higher strain occurs in the MOF framework, causing some band shifts and splitting. A more precise assignment would require ab initio molecular modelling calculations.14 The bands of both IR and Raman spectra falling in the 1490–1350 cm−1 range can be attributed to νsym(COO−) vibrational modes.12 Again the similarity to the potassium citrate monohydrate is quite strong (bands are slightly shifted at lower frequency). Moreover, the spectra of as-synthesized and activated UTSA-16 are nearly superimposed (especially the Raman spectra). In the lower frequency range the two UTSA-16 spectra reveal almost identical IR and Raman spectra. Also in this range the main fingerprints of the model compound can be recognized, only slightly red shifted in some cases. In the very low frequency range of the Raman spectra (below 400 cm−1) the appearance of a few features belonging to UTSA-16 samples only is remarkable, most likely ascribable to Co–O vibrational modes.
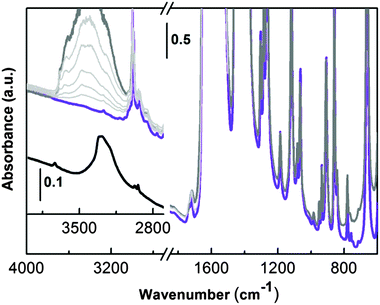
The IR spectrum recorded in transmission of UTSA-16 outgassed in a vacuum at room temperature (two hours) and subsequently at 363 K overnight is shown in Fig. 5 (violet line).
In the high frequency range, UTSA-16 is characterized by (i) the presence of aliphatic C–H stretching (below 3000 cm−1) and by (ii) the lack of any bands ascribable to hydroxyls (3700–3000 cm−1) neither due to the citrate unit nor due to any residual water molecules. This experimental evidence does not match with the description of the UTSA-16 compound previously reported.6 In that paper the authors state that structural water was still present after the activation process and a residual hydroxyl group was localized on the central carboxylic unit at the half of the citrate linkers (Fig. 1c). For the sake of comparison, in the inset of Fig. 5 (black line) the spectrum of potassium citrate mono-hydrate is also reported. The spectrum clearly shows the presence of an isolated –OH group (maximum at 3734 cm−1) due to the alcoholic functionality of the citrate anion and a broad band with a maximum at 3290 cm−1 and a shoulder at 3210 cm−1, due to water molecules interacting with the citrate units. From the comparison of these two spectra it is clear that in the case of the activated UTSA-16 sample, both water and isolated hydroxyl groups are absent.
In order to have a better insight about the effect of a controlled amount of water on the structure of UTSA-16, the sample was contacted with water vapour pressure (Fig. 5, dark grey curve). As soon as water is admitted in the infrared cell, the growth of a complex broad band with maximum centred at around 3400 cm−1 is observed in the high frequency region and it can be related to the medium strength H-bonded water molecules. No other significant changes are observed in the lower part of the infrared spectrum (1700–700 cm−1) testifying how water molecules are not strongly affecting MOF framework modes. IR spectra do not show any evolution in time in the presence of water (spectra not reported). The effect of progressive outgassing at room temperature, until a final equilibrium pressure below 5 × 10⁻⁴ mbar, is shown in Fig. 5 by the series of spectra reported as light grey curves. Water is weakly bonded in UTSA-16, as testified by the progressive decrease of the broad absorption centred at 3400 cm−1 (the last spectrum in light grey has been obtained after dynamic pumping at room temperature for 1 hour). The original spectrum (violet line) where water is totally absent can be obtained with a successive outgassing in a high vacuum at 363 K for two hours (spectrum not reported). The absence of residual water molecules coordinating the K+ counter ions is definitely proved by the results obtained upon adsorption of CO at low temperatures as described in the coming section.
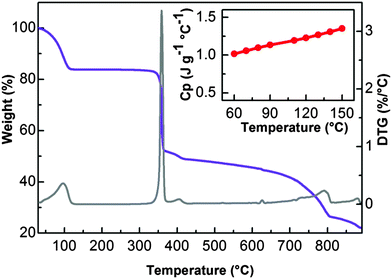
The low interaction energy of water inside the material under investigation has been also confirmed by TGA measurements. As reported in Fig. 6, UTSA-16 shows a substantial weight loss before 373 K followed by a flat region that extends until above 573 K, testifying a range of thermal stability significantly improved with respect to that reported previously where the material does not show any clear plateau in the TGA profile suggesting a lower stability towards heating.8 Note that previous studies were performed with a heating rate of 10 K min−1 while in this case a heating rate of 2 K min−1 was adopted.
The dependence on temperature of the specific heat capacity (Cp) of UTSA-16, being an important parameter in CCS applications, has been determined in the 333–423 K range and it is reported as the inset in Fig. 6. UTSA-16 Cp ranges between 1.0 and 1.4 J K−1 g−1. A review of Cp reported for other microporous materials is reported in Fig. S3 of ESI,† for the sake of comparison. It is evident as this value is close to the one reported for other microporous materials. The fact that UTSA-16 is characterized by a Cp value approximately 1/3 of that measured in the case of MEA 40% water solution (Cp = 3.63 J K−1 g−1 while heat capacity of water is Cp = 4.18 J K−1 g−1)1,15 confirms that UTSA-16 can represent a promising strategy for reducing the regeneration energy penalty.
Role of K+ as a polarizing site able to reversibly bind gaseous molecules
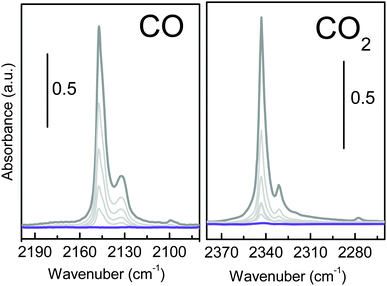
Infrared spectroscopy is extensively used to characterize the presence of specific interaction sites at the surface of microporous materials by characterizing their ability to selectively interact with a target molecule (i.e. CO and CO2).16 Carbon monoxide is a weak base often used as a probe molecule (carbon end-on interacting), with Lewis centres such as K+. Fig. 7a shows the effect of dosing CO at 77 K, on a pre-activated UTSA-16 sample. The appearance of a single main band centred at 2147 cm−1 suggests the formation of a 1![[thin space (1/6-em)]](https://www.rsc.org/images/entities/char_2009.gif) :
:![[thin space (1/6-em)]](https://www.rsc.org/images/entities/char_2009.gif) 1 adduct between the isolated Lewis sites (K+) and the CO through its dipole moment causing a shift of the band (Δν) to +9 cm−1 with respect to CO in the liquid phase.
1 adduct between the isolated Lewis sites (K+) and the CO through its dipole moment causing a shift of the band (Δν) to +9 cm−1 with respect to CO in the liquid phase.
The observed shift of the CO frequency on UTSA-16 is similar to what has been reported for CO adsorbed on K-ZSM5 (2150 cm−1, Δν = +12 cm−1).17 The higher shift observed for the K+ exchanged ZSM5 zeolite is ascribable to the fact that in K-ZSM-5 cations are less interacting with the framework (nearest neighbours are two or three oxygen directly bonded to the aluminium sites), while for UTSA-16 K+ are surrounded by four oxygen from the citrate groups. No other changes are observed in the overall medium infrared range, testifying how the interaction with the probe is localized on the potassium site (see Fig. S4a, ESI†). The interaction with CO is weak, as testified by the complete reversibility of the associate band. The set of spectra shows the presence of a second component at 2132 cm−1 (Δν = −6 cm−1) ascribable to the less favourable K+⋯OC adducts and a shoulder at 2144 cm−1 suggesting not a single minimum geometry for K+⋯CO adducts inside UTSA-16 channels.
A similar experiment has been performed, at room temperature, using CO2 as molecular probe, as reported in Fig. 7b. The interaction with CO2 (grey line) causes the appearance of a band at 2343 cm−1 and the satellite absorptions at 2331 cm−1 accompanied by the complex absorption at 3700 and 3600 cm−1 (see Fig. S4b, ESI†). Similar to what is shown in Fig. S4a (ESI†), all the framework vibrations are left unperturbed upon interaction with CO2 (grey and violet lines are overimposed). The high affinity of UTSA-16 for CO2 is testified by the extreme intensity of the main band that goes out of scale and the appearance of two complex absorptions at about 3700 and 3600 cm−1 due to the combination of ν1 and ν3 modes of CO2 (ν1 + ν3 affected by the Fermi Resonance effect with 2ν2 that causes the appearance of a doublet shift of about ±50 cm−1 from the expected frequency for the combination mode,18 see Fig. S4b, ESI†). In order to clarify how CO2 interacts with this material, it is important to recall that in the case of CO2 adsorption on a positive charge, CO2 molecule is expected to stay linear but with the two C![[double bond, length as m-dash]](https://www.rsc.org/images/entities/char_e001.gif) O bonds no more identical. In particular, the C–O bond adjacent to the cation lengthens slightly, whereas the other C–O bond shortens of almost the same amount, corresponding to an increase of the asymmetric stretching mode frequency.2,19 Moreover, due to the large quadrupole moment of CO2, a strong matrix confinement effect is expected in the case of adsorption inside a microporous material. For this reason, 2338 cm−1 is generally accepted as the referential frequency for the unperturbed CO2 molecule instead of the gas-phase ν3 value.20 The most intense peak, showing a maximum at 2343 cm−1 (Δν = +5 cm−1 with respect to the unperturbed molecule in a microporous framework at 2338 cm−1) can be ascribed to the formation of K+⋯O
O bonds no more identical. In particular, the C–O bond adjacent to the cation lengthens slightly, whereas the other C–O bond shortens of almost the same amount, corresponding to an increase of the asymmetric stretching mode frequency.2,19 Moreover, due to the large quadrupole moment of CO2, a strong matrix confinement effect is expected in the case of adsorption inside a microporous material. For this reason, 2338 cm−1 is generally accepted as the referential frequency for the unperturbed CO2 molecule instead of the gas-phase ν3 value.20 The most intense peak, showing a maximum at 2343 cm−1 (Δν = +5 cm−1 with respect to the unperturbed molecule in a microporous framework at 2338 cm−1) can be ascribed to the formation of K+⋯O![[double bond, length as m-dash]](https://www.rsc.org/images/entities/char_e001.gif) C
C![[double bond, length as m-dash]](https://www.rsc.org/images/entities/char_e001.gif) O adducts with end-on configuration. In fact, the observed CO2 frequency is similar to what has been reported for CO2 adsorbed on K-ZSM5 (2351 cm−1, Δν = +13 cm−1),19 even if the polarizing effect of the MOF is substantially lower than that observed in the case of the zeolite. Moreover, broad side bands symmetrically shifted from the ν3 mode (assigned to vibrational behaviour associated with the rotational degree of freedom of the bound CO2) are observed. Finally, a weaker component at 2331 cm−1, described as a combination band in which a molecule in the first excited bending mode (ν2) undergoes a fundamental transition of the asymmetric stretching mode and a very weak band at 2277 cm−1, due to the fundamental ν3 band of the 13CO2 isotopologue.21
O adducts with end-on configuration. In fact, the observed CO2 frequency is similar to what has been reported for CO2 adsorbed on K-ZSM5 (2351 cm−1, Δν = +13 cm−1),19 even if the polarizing effect of the MOF is substantially lower than that observed in the case of the zeolite. Moreover, broad side bands symmetrically shifted from the ν3 mode (assigned to vibrational behaviour associated with the rotational degree of freedom of the bound CO2) are observed. Finally, a weaker component at 2331 cm−1, described as a combination band in which a molecule in the first excited bending mode (ν2) undergoes a fundamental transition of the asymmetric stretching mode and a very weak band at 2277 cm−1, due to the fundamental ν3 band of the 13CO2 isotopologue.21
Volumetric adsorption of CO2
The presence of K+ ion active sites together with a microporous 3D network makes UTSA-16 a suitable material with high potential for CO2 capturing, as reported by Xiang et al.6 For this purpose, a series of volumetric adsorption measurements up to 1 bar and at different temperatures have been performed. CO2 uptake of UTSA-16 at 298 K and 1 bar reaches 4.18 mol kg−1, a value fully comparable with that one reported by Xiang et al.5 (4.25 mol kg−1). By considering the pore volume of UTSA-16 (0.32 cm3 g−1) and by supposing to fill the pores with liquid CO2, the maximum estimated uptake is 5.59 mol kg−1. This indicates that the saturation value for CO2 adsorption in UTSA-16 is reached at 1 bar and 273 K, whereas, at the same pressure, 4/5 and 3/5 of the total capacity is reached at 298 and 313 K respectively: a quite interesting behaviour with respect to other MOFs.22 Another aspect that highlights UTSA-16 as a suitable carbon dioxide adsorbent for post-combustion CCS is the value of 11.1 wt% uptake at 298 K and a CO2 partial pressure of 0.15 bar (common CO2 pressure in post combustion emissions). This results to be one of the best among the most common carbon dioxide adsorbers (see Table S2 in the ESI†). The three isotherms have been fitted by means of a dual-site Langmuir equation as described in Table S3 in the ESI.† The saturation values obtained from the fits are close to the 5.59 mol kg−1 value estimated from the MOF pore volume, validating them. The fit evidences the prevalence of the most energetic adsorption site (A), whereas the less energetic one (site B) would be almost unoccupied. In order to clarify the nature of the most relevant adsorption site, we have evaluated the CO2 amount by considering a K+/CO2 ratio equal to 1, in the case of three different formula units. The KCo3(H2O)2(Hcit)(cit) formula unit gives rise to 1.6 mol kg−1 or 1.7 mol kg−1 if water is omitted (formula unit: (KCo3(Hcit)(cit))), while the value increases to 3.1 mol kg−1 in the case of the K2Co3(cit)2 formula unit. As all the values are decidedly lower than the one suggested by the fit, in the case of the proposed formula unit (K2Co3(cit)2), we speculate that a fraction of K+ sites adsorbs two molecules of CO2 each. Moreover, as the maximum estimated uptake (5.59 mol kg−1) is reached before the complete saturation of K+ sites towards the formation of K+(CO2)2 adducts, no significant role of less energetic adsorption sites (i.e. the linkers) is suggested. This peculiar behaviour could be the reason that justifies a superior performance of UTSA-16 as a CO2 separator, with respect to other MOFs.Finally, isosteric heat of adsorption (−Qst) of CO2 on UTSA-16 has been computed in the Clausius Clapeyron approximation by fitting with a dual-site Langmuir model (Table S3, ESI†) the CO2 isotherms at different temperatures (273, 298 and 333 K). The zero-coverage −Qst for UTSA-16 is equal to 39.7 kJ mol−1 and can be compared to the one of other important MOFs (Table S4, ESI†) such as IRMOF-1 and HKUST-1 (Cu exposed cation). The isosteric heat of CO2 adsorption was calculated also for higher coverage (Fig. 8, inset) where a constant trend of −Qst is presented (38.0 kJ mol−1 along the flat part of the calorimetric curve); the homogeneity of the isosteric heat values confirms the presence of a single adsorption site (namely K+ species) as already discussed above. These values, being very close to what has been obtained in the case of a K-MCM-22 zeolite (at zero-coverage −Qst of 41.1 kJ mol−1 and an average value −Qst of 38 kJ mol−1 in the range of 0–0.8 mmol g−1),23 further confirm that K+ species are the most relevant adsorption sites in UTSA-16.
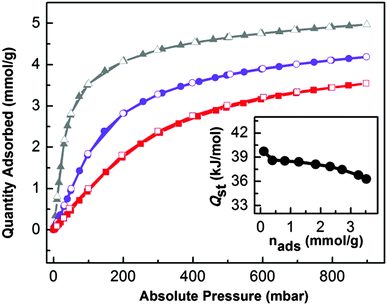 | ||
| Fig. 8 CO2 volumetric isotherms on UTSA-16 and isosteric heat of adsorption. Adsorption and desorption isotherms of CO2 on UTSA-16 from 0 to 1 bar at 273 K (▲, grey line), 298 K (●, violet line) and 313 K (■, red line). Full symbols refer to the adsorption isotherm; empty symbols refer to the desorption isotherm. The inset shows the dependence of adsorption isosteric heat with CO2 loadings extrapolated through a dual-site Langmuir fitting of isotherms curves reported in the main figure (see ESI† for details). | ||
Experimental methods
Preparation of the sample
UTSA-16 was obtained by hydrothermal synthesis as follows: Co(OAc)2·4H2O (0.249 g, 1 mmol), C6H8O7·H2O (0.21 g, 1 mmol), KOH (0.168 g, 3 mmol), H2O (2.5 ml) and C2H5OH (2.5 ml) in a molar ratio of 1![[thin space (1/6-em)]](https://www.rsc.org/images/entities/char_2009.gif) :
:![[thin space (1/6-em)]](https://www.rsc.org/images/entities/char_2009.gif) 1
1![[thin space (1/6-em)]](https://www.rsc.org/images/entities/char_2009.gif) :
:![[thin space (1/6-em)]](https://www.rsc.org/images/entities/char_2009.gif) 3
3![[thin space (1/6-em)]](https://www.rsc.org/images/entities/char_2009.gif) :
:![[thin space (1/6-em)]](https://www.rsc.org/images/entities/char_2009.gif) 139
139![[thin space (1/6-em)]](https://www.rsc.org/images/entities/char_2009.gif) :
:![[thin space (1/6-em)]](https://www.rsc.org/images/entities/char_2009.gif) 43 were put in a Teflon-lined 23 ml Parr acid digestion bomb. The bomb was then placed in a furnace that was heated from room temperature to 393 K in half an hour, kept at 393 K for 2 days, and then slowly cooled to room temperature at a rate of 4 °C h−1.
43 were put in a Teflon-lined 23 ml Parr acid digestion bomb. The bomb was then placed in a furnace that was heated from room temperature to 393 K in half an hour, kept at 393 K for 2 days, and then slowly cooled to room temperature at a rate of 4 °C h−1.
Before interaction with molecular probes (CO, CO2 and H2O vapour) UTSA-16 was activated under high vacuum for two hours then heated up to 363 K over night. Final vacuum was below 1 × 10⁻⁵ mbar.
Potassium citrate monohydrate (HOC(COOK)(CH2COOK)2·H2O) has been purchased from Sigma-Aldrich (≥99.0% purity).
Powder X-ray diffraction
Powder X-ray diffraction patterns were collected using a laboratory diffractometer (Panalytical X’Pert Pro Multipurpose Diffractometer) with a nickel filter and a copper source in Debye–Scherrer geometry. Samples were put in 0.8 mm borosilicate capillaries sealed in a N2 atmosphere and measured in a 2θ range of 2°–102° (a scanning step of 0.016° and 0.010° s−1). Capillaries were constantly rotated to avoid preferential orientations of crystallites.Surface area and pore volume
Volumetric N2 adsorption at 77 K was carried out by means of a Micromeritics ASAP 2020 sorption analyzer on activated UTSA-16 to evaluate the surface area and total pore volume. The Langmuir adsorption model was chosen to represent the surface area of microporous UTSA-16, while the total pore volume was extrapolated from the N2 adsorption isotherm at p/p0 = 0.97 and multiplied by the N2 density conversion factor (0.0015468) in order to obtain a value in cm3 g−1 from cc(STP) g−1.Transmission electron microscopy coupled with the EDX probe
Transmission electron microscopy (TEM) analysis was performed by means of a JEOL JEM 3010-UHR microscope operating at 300 kV, equipped with a (2k × 2k)-pixel Gatan US1000 CCD camera and with an OXFORD INCA EDS instrument for atomic recognition via energy dispersive X-ray spectroscopy (EDX). The powdered samples were deposited on a copper grid covered with a lacey carbon film. Images were acquired in a magnification range of 5000× to 150![[thin space (1/6-em)]](https://www.rsc.org/images/entities/char_2009.gif) 000× to examine the stability of the UTSA-16 material under the electron beam. In order to avoid moisture/solvent release in the microscope column, samples were previously activated overnight (under high vacuum at 363 K) and left in a pre-chamber for 2 hours. In this way, the samples were kept at the analysis chamber under a very high vacuum condition, allowing us to collect images also at high resolution. To evaluate the K
000× to examine the stability of the UTSA-16 material under the electron beam. In order to avoid moisture/solvent release in the microscope column, samples were previously activated overnight (under high vacuum at 363 K) and left in a pre-chamber for 2 hours. In this way, the samples were kept at the analysis chamber under a very high vacuum condition, allowing us to collect images also at high resolution. To evaluate the K![[thin space (1/6-em)]](https://www.rsc.org/images/entities/char_2009.gif) :
:![[thin space (1/6-em)]](https://www.rsc.org/images/entities/char_2009.gif) Co ratio, EDX analysis was made on an extensive number of acquisitions (Table S1, ESI†), using the following parameters: magnification: 30
Co ratio, EDX analysis was made on an extensive number of acquisitions (Table S1, ESI†), using the following parameters: magnification: 30![[thin space (1/6-em)]](https://www.rsc.org/images/entities/char_2009.gif) 000×, accelerating voltage (kV): 300.00, tilt (deg): 0.0, elevation (deg): 17.8, azimuth (deg): 0.0. Quantitative compositional data were obtained using the Oxford INCA Microanalysis Suite software.
000×, accelerating voltage (kV): 300.00, tilt (deg): 0.0, elevation (deg): 17.8, azimuth (deg): 0.0. Quantitative compositional data were obtained using the Oxford INCA Microanalysis Suite software.
DR-UV-Vis-NIR
The DR-UV-Vis-NIR spectrum was collected with CARY 5000. As-synthesized UTSA-16 was diluted in Teflon in order to get Kubelka Munk units below 2. The effect of outgassing has been monitored upon activation of a sample without dilution (Fig. S2, ESI†).FTIR spectroscopy
Framework vibrational modes of UTSA-16 and of K-citrate-monohydrates were measured in the ATR (Attenuated Total Reflection) mode on powdered samples using a Bruker Alpha-P spectrometer equipped with diamond crystals (2 cm−1 resolution; 1024 scans). Measurements were made in a controlled atmosphere as the spectrometer is inside a glove box, a M Braun Lab Star Glove Box filled with N2 5.5 purity grade, <0.01 ppm O2, <0.01 ppm H2O.FTIR spectra in the transmission mode were collected using a Bruker Vertex70 FTIR spectrometer equipped with a MCT detector on thin self supporting pellets. Samples were activated in a high vacuum in a homemade cell that allows also controlled dosages of molecules in the gas phase (H2O, CO and CO2) and in situ measurements.
Raman
Raman spectra were recorded on a Renishaw inVia Raman microscope spectrometer. A diode laser emitting at 785 nm was used. Its power was limited to 1%. Photons scattered by the sample were dispersed by a 1200 lines per mm grating monochromator and were simultaneously collected on a CCD camera; the collection optic was set at 20× objective. The spectral collection setup consisted of 50 acquisitions, each of 20 s. The samples were inserted into an optical cell that allows thermal treatments in a high vacuum.TGA and DSC analysis
Thermogravimetric analysis was performed using TA-instruments SDT Q600, under N2 flux (100 ml min−1, from 303 to 1173 K and a heating rate of 2 K min−1). 0.0062 g of UTSA-16 was measured in an uncovered alumina pan.Differential scanning calorimetry was performed using Q200 TA-instruments, on activated UTSA-16 in order to evaluate its specific heat capacity at different temperatures. This physical quantity can be obtained by comparison with a material of known Cp (sapphire, in this case) applying the following equation:
 | (1) |
Volumetric CO2 adsorption measurements and isosteric heat of adsorption
CO2 adsorption isotherms were carried out using a volumetric instrument, Micromeritics TriStar II 3020 system, on UTSA-16 activated powder at 273, 298 and 313 K (isothermal water bath). In order to evaluate the isosteric heat of adsorption, the CO2 adsorption isotherms were fitted by a dual-site Langmuir model (Table S3, ESI†); each calorimetric point in the inset of Fig. 8 has been obtained by applying the Clausius–Clapeyron equation defined as: | (2) |
![[thin space (1/6-em)]](https://www.rsc.org/images/entities/char_2009.gif) ln
ln![[thin space (1/6-em)]](https://www.rsc.org/images/entities/char_2009.gif) p/∂T at constant loading; the isosteric heat of adsorption is obtained by multiplying the pendency by the 2nd power of T (average temperature between the chosen ones, in our case 273–298–313 K) and by the perfect gas constant.
p/∂T at constant loading; the isosteric heat of adsorption is obtained by multiplying the pendency by the 2nd power of T (average temperature between the chosen ones, in our case 273–298–313 K) and by the perfect gas constant.
Conclusions
A new insight into the structure and the reactivity of the metal organic framework UTSA-16 was provided. Several techniques were used in order to underline the physical–chemical properties that make UTSA-16 a suitable material for post-combustion CO2 adsorption such as its medium affinity for CO2 as well as its low specific heat capacity, both leading to a sustainable energetic penalty during the CO2 desorption step, a crucial point within the whole CCS chain.3Moreover, the CO2 adsorption isotherm at 298 K and at a partial pressure of 0.15 bar (common CO2 pressure in post-combustion emissions) evaluated in UTSA-16 shows an uptake higher than most of carbon dioxide adsorbents. On the basis of IR and TEM-EDX results, the presence of water and of hydroxyls groups in the activated UTSA-16 was ruled out, implying to propose K2Co3(cit)2 as a new empirical formula of the material used for the present study. The total absence of hydroxyl groups and water molecules discarded the interpretation given by Xiang et al.,6 who describe the adsorption of CO2 on UTSA-16 as a water-directed interaction between the MOF and carbon dioxide was discarded.
Infrared spectroscopy and volumetric data suggested that the main interaction between CO2 and UTSA-16 was due to the direct interaction of CO2 with K+ ions. This result is in line with what was reported in the case of a study that describes the interaction of CO2 with K+ open metal sites in K-ZSM-5.19 Moreover, CO2 isosteric heat of adsorption evaluated in this work and the one obtained by Zukal et al.23 in the case of CO2 interacting with the K-MCM-22 zeolite are very similar (39.7 vs. 41.1 kJ mol−1 at zero-coverage). On the basis of the adsorbed amount of CO2 at 1 bar and at 298 K (4.18 mol Kg−1) and the empirical formula of K2Co3(cit)2, the formation of K+(CO2) and K+(CO2)2 adducts can be hypothesized.
Acknowledgements
The research leading to these results has received funding from the European Union Seventh Framework Programme (FP7 2007–2013) under Grant Agreement 608534 (MATESA project).Notes and references
- K. Sumida, D. L. Rogow, J. A. Mason, T. M. McDonald, E. D. Bloch, Z. R. Herm, T. H. Bae and J. R. Long, Chem. Rev., 2012, 112, 724–781 CrossRef CAS PubMed.
- J. G. Vitillo, RSC Adv., 2015, 5, 36192–36239 RSC.
- G. T. Rochelle, Science, 2009, 325, 1652–1654 CrossRef CAS PubMed.
- Z. J. Zhang, Z. Z. Yao, S. C. Xiang and B. L. Chen, Energy Environ. Sci., 2014, 7, 2868–2899 CAS.
- S. C. Xiang, X. T. Wu, J. J. Zhang, R. B. Fu, S. M. Hu and X. D. Zhang, J. Am. Chem. Soc., 2005, 127, 16352–16353 CrossRef CAS PubMed.
- S. C. Xiang, Y. B. He, Z. J. Zhang, H. Wu, W. Zhou, R. Krishna and B. L. Chen, Nat. Commun., 2012, 3, 954–963 CrossRef PubMed.
- V. I. Agueda, J. A. Delgado, M. A. Uguina, P. Brea, A. I. Spjelkavik, R. Blom and C. Grande, Chem. Eng. Sci., 2015, 124, 159–169 CrossRef CAS.
- Y. C. Shen, Z. Y. Li, L. H. Wang, Y. X. Ye, Q. Liu, X. L. Ma, Q. H. Chen, Z. J. Zhang and S. C. Xiang, J. Mater. Chem. A, 2015, 3, 593–599 CAS.
- C. A. Grande, V. I. Agueda, A. Spjelkavik and R. Blom, Chem. Eng. Sci., 2015, 124, 154–158 CrossRef CAS.
- S. T. Meek, J. A. Greathouse and M. D. Allendorf, Adv. Mater., 2011, 23, 249–267 CrossRef CAS PubMed.
- B. N. Figgis, Introduction to ligand fields, Interscience Publishers, 1966 Search PubMed.
- A. C. Bertoli, R. Carvalho, M. P. Freitas, T. C. Ramalho, D. T. Mancini, M. C. Oliveira, A. de Varennes and A. Dias, Spectrochim. Acta, Part A, 2015, 137, 271–280 CrossRef CAS PubMed.
- R. M. Ferreira, M. Motta, A. Batagin-Neto, C. F. D. Graeff, P. N. Lisboa and F. C. Lavarda, Mater. Res., 2014, 17, 550–556 CrossRef CAS.
- F. Bonino, C. Lamberti, S. Chavan, J. G. Vitillo and S. Bordiga, in Metal Organic Frameworks as Heterogeneous Catalysts, ed. F. Xamena and J. Gascon, 2013, pp. 76–142 Search PubMed.
- R. H. Weiland, J. C. Dingman and D. B. Cronin, J. Chem. Eng. Data, 1997, 42, 1004–1006 CrossRef CAS.
- C. Lamberti, A. Zecchina, E. Groppo and S. Bordiga, Chem. Soc. Rev., 2010, 39, 4951–5001 RSC.
- C. O. Arean, M. R. Delgado, K. Frolich, R. Bulanek, A. Pulido, G. F. Bibiloni and P. Nachtigall, J. Phys. Chem. C, 2008, 112, 4658–4666 CAS.
- S. Bordiga, L. Regli, F. Bonino, E. Groppo, C. Lamberti, B. Xiao, P. S. Wheatley, R. E. Morris and A. Zecchina, Phys. Chem. Chem. Phys., 2007, 9, 2676–2685 RSC.
- B. Bonelli, B. Civalleri, B. Fubini, P. Ugliengo, C. O. Arean and E. Garrone, J. Phys. Chem. B, 2000, 104, 10978–10988 CrossRef CAS.
- J. G. Vitillo, M. Savonnet, G. Ricchiardi and S. Bordiga, ChemSusChem, 2011, 4, 1281–1290 CrossRef CAS PubMed.
- S. A. FitzGerald, J. M. Schloss, C. J. Pierce, B. Thompson, J. L. C. Rowsell, K. Yu and J. R. Schmidt, J. Phys. Chem. C, 2015, 119, 5293–5300 CAS.
- J. Ethiraj, E. Albanese, B. Civalleri, J. G. Vitillo, F. Bonino, S. Chavan, G. C. Shearer, K. P. Lillerud and S. Bordiga, ChemSusChem, 2014, 7, 3382–3388 CrossRef CAS PubMed.
- A. Zukal, J. Pawlesa and J. Cejke, Adsorption, 2009, 15, 264–270 CrossRef CAS.
Footnote |
| † Electronic supplementary information (ESI) available. See DOI: 10.1039/c5cp05905d |
| This journal is © the Owner Societies 2016 |

