 Open Access Article
Heads or tails: how do chemically substituted fullerenes melt?
Jeff
Armstrong
*ab,
Sanghamitra
Mukhopadhyay
ab,
Fernando
Bresme
ac and
Felix
Fernandez-Alonso
*bd
aChemical Physics Section, Department of Chemistry, Imperial College London, London SW7 2AZ, UK
bISIS Facility, Rutherford Appleton Laboratory, Chilton, Didcot, Oxfordshire OX11 0QX, UK. E-mail: jeff.armstrong@stfc.ac.uk; felix.fernandez-alonso@stfc.ac.uk
cDepartment of Chemistry, Norwegian University of Science and Technology, Trondheim, Norway
dDepartment of Physics and Astronomy, University College London, Gower Street, London, WC1E 6BT, UK
First published on 12th April 2016
Abstract
We address the question as to whether the melting of chemically substituted fullerenes is driven by the dynamics of the fullerene moiety (the head) or the substituted sub-unit (the tail). To this end, we have performed quasielastic neutron-scattering experiments and classical molecular-dynamics simulations as a function of temperature on the prototypical fullerene derivative phenyl-C61-butyric acid methyl ester. To enable a direct and quantitative comparison between experimental and simulation data, dynamic structure factors for the latter have been calculated from atomic trajectories and further convolved with the known instrument response. A detailed analysis of the energy- and momentum-transfer dependence of this observable in the quasielastic regime shows that melting is entirely driven by temperature-activated tail motions. We also provide quantitative estimates of the activation energy for this process as the material first enters a plastic-crystalline phase, followed by the emergence of a genuine liquid at higher temperatures.
1 Introduction
The past two decades have witnessed an unprecedented upsurge in social and political pressure to find sustainable alternatives to fossil fuels, combined with an ever-increasing consensus about the anthropogenic origin of global warming. This awareness has ushered in an era where the search for renewable alternatives for power generation and conversion has become a scientific and technological imperative. Silicon solar cells have provided modest success in addressing these challenges.1 However, with technology becoming ever more mobile, the demands for a more versatile alternative to silicon solar cells has arisen. Organic solar cells hope to fill this need, through their ability to be printed on flexible substrates, and benefit too from the low cost of their constituent organic elements. Despite their early promise, the key bottleneck in achieving conversion efficiencies which are viable on a commercial level lies in understanding (and controlling) how the morphology and structure of the blends affect both charge generation and the resulting diffusion in condensed-matter media. In particular, it has been shown that both structure and morphology are highly sensitive to preparation and annealing methods.2,3 Fullerene-based compounds relying on the addition of functional groups to the quintessential fullerene parent C60 have become a commonly used ingredient in complex multi-component devices for solar-energy harvesting, yet at the same time their thermodynamic behaviour continues to be poorly understood. This situation is in stark contrast with that of C60. Over the past three decades, the structure and dynamics of C60 have been the subject of extensive studies,4,5 and these works have provided some very interesting physics, due to the high symmetry of this carbon allotrope and its small interaction-distance-to-size ratio. In particular, C60 has been shown to undergo a transition to a rotor phase at 90 K and a first-order phase transition from simple cubic to face-centered-cubic at 260 K.6 Since the initial discovery of C60, there has also been an intense debate over whether it could exhibit a true liquid state, and what unusual properties such a liquid might have. In particular, some simulation models have predicted three states of matter, whereas others have predicted or reported direct sublimation to the gas phase from the crystal.7–9 In this context, fullerenes may be regarded as exotic quasiparticles due to the short range of attraction relative to their large dimensionality, with the subsequent theoretical implications on its phase diagram and thermodynamic properties.10 Given the heavy focus over the past decade on the use of substituted fullerenes for technological applications,11–13 not much attention has been given to the study of structural or dynamical disorder leading to the emergence of rotor, glassy, or liquid phases beyond those known for C60. Phenyl-C61-butyric acid methyl ester (hereafter PCBM) is a timely case in point, given its extensive use in emerging solar devices and technologies,1 yet at the same time little is known about how the addition of a soft organic tail to C60 modifies its phase and thermodynamic behaviour, including the putative existence of a true liquid phase. This work addresses these pending questions via a combination of high-resolution neutron spectroscopy and classical molecular-dynamics simulations over a wide temperature range.2 Methods
PCBM was purchased from Solaris Chem and used as received. Chemically, a PCBM molecule consists of 72 carbon (C), 14 hydrogen (H), and 2 oxygen (O) atoms. Differential scanning calorimetry (DSC) measurements were performed in an argon atmosphere with a Mettler Toledo unit covering the temperature range T = 273–573 K with a heating rate of 2 K per minute. Neutron-scattering experiments were performed on a three-gram powder specimen using the OSIRIS spectrometer14–16 at the ISIS Pulsed Neutron and Muon Source, Rutherford Appleton Laboratory, United Kingdom. The sample was initially cooled to 233 K and data were collected for ca. three hours every 10 K up to 563 K. OSIRIS is equipped with a total of 42 detectors over an angular range of 11° < 2θ < 148°. In so-called PG002 mode, OSIRIS allows an effective coverage of the dynamic structure factor S(Q,E) over a momentum-transfer range Q ∼ 0.3–1.8 Å−1 and an energy-transfer range E ∼ ±0.44 meV. In this quasielastic neutron-scattering (QENS) regime, the spectral resolution amounts to ∼25 μeV, enabling access to correlation times of up to ca. 100 ps. S(Q,E) was obtained from the experimental neutron data using the software package Mantid.17,18 For each detector and temperature, neutron spectra were binned over the aforementioned energy-transfer range using a constant bin size of 4 μeV. Integration of S(Q,E) over E provides us with an estimate of the neutron-weighted structure factor S(Q).Classical molecular-dynamics simulations (hereafter CMD) were performed using the freely available software package NAMD.19 We have used a previously studied model of PCBM20 based on the OPLS force-field, with an increased van-der-Waals radius to better reproduce the experimental thermal expansion coefficient of the solid.21 The initial configuration was that of the previously determined crystal structure from powder X-ray diffraction,20 where the unit cell has been replicated three times in each dimension thus incorporating a total of 9504 atoms. Simulations were performed with a fully flexible simulation cell to allow for structural changes of the system during heating, a task achieved via the use of a NPT Langevin piston. Electrostatics were dealt with using the particle-mesh Ewald method with a force tolerance of 10−6. A time-step of 1 fs was used for all simulations and all statistics have been calculated over a 2 ns trajectory with a 1 ps sampling period. As seen in previous studies of this model, a slight change of cell dimensions is seen upon heating/relaxation of the experimentally determined crystal geometry, although the overall C60–C60 structure is largely maintained.
3 Results and discussion
3.1 Structure
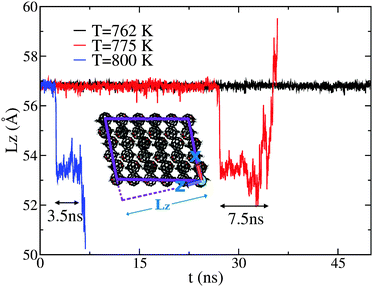
CMD simulations were performed at temperatures of 700, 762, 775, 800, and 900 K. The simulated melting temperature appears to be significantly higher than that of experiment, however no attempt has been made to find the precise melting temperature due to the size and timescale restrictions of such a complex system. However, if we define a reduced temperature TR for both experiment and simulation via normalisation of the data by the respective melting temperature (TM) such that TR = T/TM, then we observe good agreement for both structural and dynamical properties, as explained in more detail in the next section. At T = 800 K, we observe a change in cell dimensions, accompanied by a change in C60–C60 coordination. In addition, the new structure appears to allow the free rotation of the fullerene in its lattice position. This phase is only seen to persist for approximately 3.5 ns before a full melting transition occurs. Evidence that this rotor or plastic phase may be a true equilibrium phase of the system can be obtained from an analysis of lower-temperature simulations (T = 775 and 762 K). At T = 775 K, the rotor phase onsets after a much longer duration (∼27 ns) and also persists for a longer duration (∼7.5 ns). A further decrease in temperature to T = 762 K does not produce any such transition within a 50 ns window. These results are summarised in Fig. 1, showing the time evolution of the dimension of the simulation cell along z, hereafter Lz. This particular direction is the most sensitive one to structural changes as a function of temperature.For the purposes of temperature rescaling, we therefore define the simulation melting temperature to be TM = 775 K, to be compared with an experimental value of TM = 543 K, as presented in the next section. We note that establishing whether this dynamically disordered phase represents a true equilibrium state or is a transient process in the full melting transition would require both much-longer simulation times, as well as a full free-energy analysis, both of which are beyond the scope of the present work. Nonetheless, the portion of the CMD trajectory exhibiting this rotor phase can be used to provide a model S(Q,E) to compare with the QENS data for a system in which PCBM has full rotational mobility. CMD trajectories were used to calculate the associated S(Q,E) using nMolDyn,22 followed by numerical convolution with the resolution function of OSIRIS for direct comparison with experimental data.
Previous experimental and computational studies have established the existence of multiple polymorphic structures of PCBM, dependent of the choice of solvent and temperature during thermal annealing.23,24 For this reason, we have carefully characterised our sample before the neutron measurements. Firstly, DSC measurements on a 10 mg sample have been used to determine whether we observe a similar calorimetric response as that reported in previous works. A quasi-linear dependence of the heat-flow with temperature is observed between 273 K and 483 K, before a sharp thermal event is observed at approximately 496 K. Following this first transition, a second and larger drop in heat flow is observed at 537 K (see Fig. 2). This second event is significantly sharper and deeper than the first one. Previous DSC studies have postulated that these two transitions correspond to some form of pre-melting transition followed by full melting, although no microscopic explanation has been advanced to date. The nature of these transitions and, indeed, whether a liquid PCBM state is attained constitute the primary focus of the present work. The fact that the DSC profile reported herein is very similar to that seen in previous studies25 gives us confidence in the quality of our PCBM specimen, and also allows us to pin-point with confidence the temperature range of interest for a more-detailed characterisation using neutron spectroscopy.
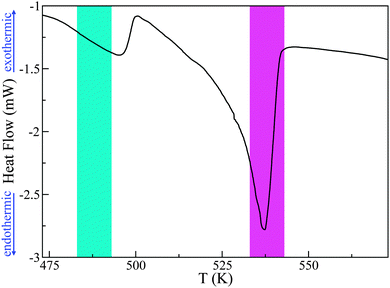 | ||
| Fig. 2 DSC data for PCBM. The cyan and magenta areas depict the pre-melting and melting transitions respectively, as discussed in more detail in the main text. | ||
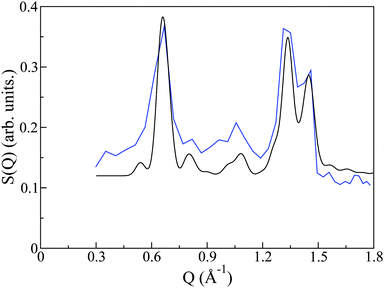
The crystal structure of PCBM has been previously determined by powder X-ray diffraction.20 As a rigorous test of the quality of synthesis and reproducibility of PCBM structures in this and previous works, we have compared the structure factor S(Q) measured on OSIRIS to that predicted by the aforementioned X-ray work. The CIF file as determined from X-ray powder diffraction was input to the crystal structure program Crystal Diffract26 and neutron-scattering cross sections were used to generate the predicted diffraction pattern. This pattern is remarkably similar to that given from our neutron spectroscopy experiment (see Fig. 3), thus giving us confidence not only in the reproducibility of PCBM structures, but also confirming that the crystal structure we employ for our simulation study is indeed the correct one. We also note that the neutron data contains a significant and relatively featureless background arising from the incoherent scattering of protons. The resulting S(Q,E) is, therefore, a complex addition of coherent and incoherent contributions to scattered intensities, whose analysis cannot be performed within the celebrated ‘incoherent approximation’.27 This difficulty provides the primary motivation for the use of CMD simulations to interpret the neutron measurements in the remainder of this work, where we note that both C and O are purely coherent scatterers, whereas H exhibits both coherent and (predominantly) incoherent scattering.
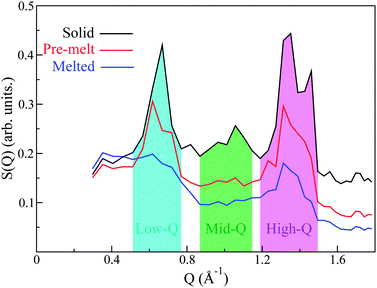
Analysis of S(Q) as a function of temperature shows three distinct thermodynamically stable structures over the studied range of temperature (see Fig. 4). The first transition occurs between 483 K and 493 K and shall be referred to as the ‘pre-melting’ transition, leading to the ‘pre-melt state.’ The second transition occurs between 523 K and 533 K and will be referred to as the ‘melting transition’ leading to the ‘melted state.’ It is important to note that the intermediate state which we refer to as the pre-melt state was structurally stable over the time period of measurement between 493 K and 523 K (i.e., 12 hours). Fig. 4 shows each one of the three observed states at representative temperatures, namely, 453 K, 533 K and 563 K.
After performing neutron measurements on the melted state, the sample was cooled at a rate of 0.9 K min−1 from 563 K to 453 K, and this process was followed in real time. Since previous studies have highlighted that long annealing times are required during the synthesis of crystalline PCBM,2,3,24 we anticipated that our relatively fast cooling rate would invariably result in a trapped glassy state upon cooling from the melt. As explained in more detail in subsequent sections, these considerations are confirmed by the neutron data, as the resultant S(Q) for the cooled melt displays multiple low-Q peaks, indicative of a mixture of length scales at the intermolecular level characteristic of an amorphous system. The observed lack of reversibility across the melting transition upon cooling under our experimental conditions does not come as a surprise, given that the melting transition is largely entropy driven, and involves weak interactions in a system of low symmetry. Moreover, PCBM displays an exceptionally complex free-energy landscape due to the high degree of motility of the chain, where crystal nucleation appears to be driven by rare events associated with the cooperative alignment of neighbouring molecules.
By virtue of the high abundance of C in PCBM (C![[thin space (1/6-em)]](https://www.rsc.org/images/entities/char_2009.gif) :
:![[thin space (1/6-em)]](https://www.rsc.org/images/entities/char_2009.gif) H ∼ 5
H ∼ 5![[thin space (1/6-em)]](https://www.rsc.org/images/entities/char_2009.gif) :
:![[thin space (1/6-em)]](https://www.rsc.org/images/entities/char_2009.gif) 1) and its relatively large coherent scattering length, we expect that the structural features observed in the neutron-weighted S(Q) will be strongly dominated by C–C correlations. Any coherent correlations between C–H and H–H will be substantially smaller and the signal from O is expected to be negligible as it only represents ∼2% of the atomic makeup of PCBM. We can immediately see that the primary peak observed in S(Q) occurs at length scales between (∼7.5–12.5 Å), sensibly longer than the diameter of the C60 unit of PCBM.28 Qualitatively, we therefore expect that this feature will be dominated by inter-C60 and some intra-C60-chain/chain–chain correlations. Similarly, the other observed peaks at higher Qs may be tentatively assigned to intra-C60 and chain correlations. Examining the structural peaks of the pre-melting transition, it is clear that a peak splitting occurs for the primary low-Q peak, indicating a change of structure, which is corroborated by changes in the high-Q features. To the best of our knowledge, these neutron data provide the first direct evidence to date of a structural phase transition in PCBM. More specifically, the two pronounced peaks present in the solid phase at intermediate Qs in the range 0.8–1.1 Å−1 disappear completely into the incoherent background upon pre-melting, thus signaling relaxation of the underlying structure. The final melting transition results in a complete broadening of the low-Q peak, with the high-Q peaks becoming drastically suppressed yet still persisting in the data. These results indicate that structural correlations are still pronounced at these shorter (intramolecular) length scales well within the liquid state.
1) and its relatively large coherent scattering length, we expect that the structural features observed in the neutron-weighted S(Q) will be strongly dominated by C–C correlations. Any coherent correlations between C–H and H–H will be substantially smaller and the signal from O is expected to be negligible as it only represents ∼2% of the atomic makeup of PCBM. We can immediately see that the primary peak observed in S(Q) occurs at length scales between (∼7.5–12.5 Å), sensibly longer than the diameter of the C60 unit of PCBM.28 Qualitatively, we therefore expect that this feature will be dominated by inter-C60 and some intra-C60-chain/chain–chain correlations. Similarly, the other observed peaks at higher Qs may be tentatively assigned to intra-C60 and chain correlations. Examining the structural peaks of the pre-melting transition, it is clear that a peak splitting occurs for the primary low-Q peak, indicating a change of structure, which is corroborated by changes in the high-Q features. To the best of our knowledge, these neutron data provide the first direct evidence to date of a structural phase transition in PCBM. More specifically, the two pronounced peaks present in the solid phase at intermediate Qs in the range 0.8–1.1 Å−1 disappear completely into the incoherent background upon pre-melting, thus signaling relaxation of the underlying structure. The final melting transition results in a complete broadening of the low-Q peak, with the high-Q peaks becoming drastically suppressed yet still persisting in the data. These results indicate that structural correlations are still pronounced at these shorter (intramolecular) length scales well within the liquid state.
3.2 Dynamics
To compare the experimental and simulation data in a model-independent manner, we make recourse to the first, non-zero energy moment of the dynamic structure factor S(Q,E), in a similar spirit as in previous studies of dynamical disorder in molecular systems.29 Mathematically, this second spectral moment m2 is defined as: | (1) |
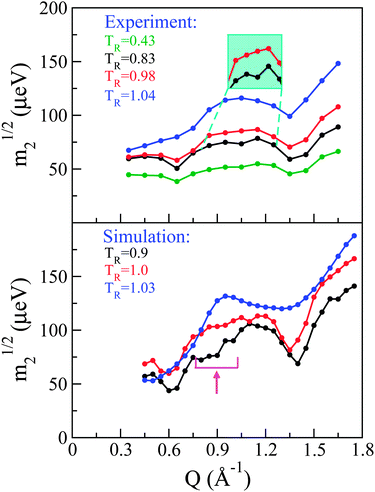
Following previous work,29 a so-called ‘reduced m2’ defined as m21/2 provides a measure of the overall spectral width of the neutron data without recourse to a specific model for the underlying dynamics. Fig. 5 shows these for both experiment (top panel) and simulation (bottom panel). Qualitatively speaking, it is reassuring to see that our CMD simulations are able to reproduce the main features observed in the neutron experiments. More specifically, the experimental data in the solid phase display three dips in m21/2. The two most prominent dips in signal appear at the same low and high positions in Q where we previously observed strong structural features that were qualitatively argued to originate from inter and intra-atomic C–C correlations, respectively. The third dip in intensity is less pronounced but, nonetheless, present at all temperatures investigated in the solid phase, and becomes progressively more pronounced with increasing temperature. Again, its Q position is the same as that where a third (less pronounced) feature was observed in the experimental S(Q). Given this correspondence between structural and dynamical features and the existence of dips in m21/2 where we observe structural peaks, the latter may be viewed as arising from de Gennes narrowing caused by dynamical arrest at highly structured regions of Q.27
Upon transition into the pre-melting phase, the intermediate-range narrowing disappears completely and m21/2 increases in the vicinity of this Q-region, indicating the onset of additional dynamical processes at these length scales. Upon full melting, the low-Q narrowing disappears and there is increasing energy broadening across all Qs associated with intermolecular correlations. The narrowing at high-Q persists, a result compatible with the notion that this high-Q region is expected to be dominated by intra-molecular correlations.
To assess the origin of these changes in dynamical behaviour at an atomic scale, a direct comparison has been performed between experiment and simulation, whereby the latter S(Q,E)s were convolved with the instrument resolution function of OSIRIS. The convolved S(Q,E) was then integrated in the same fashion as the experimental data so as to obtain simulated spectral moments. As shown in Fig. 5, the general features discussed for the experimental data are also present in the simulation. Namely, we see three regions of de Gennes narrowing in the solid phase, which progressively disappear in the same manner as seen experimentally. Quantitatively we see that the narrowing at intermediate Qs occurs over a broader range than seen experimentally, and occurs at slightly lower Qs. To understand further the microscopic origin of these spectral narrowings, we can inspect the coherent contribution to S(Q,E) from C atoms which, as expected, dominates the coherent scattering. This contribution can be decomposed into contributions coming from the C60 structure and those from the chain. These components have then been integrated over E to yield partial structure factors. Fig. 6 shows these data, including the partial contribution from these sub-units. The intermediate-Q region where we observe de Gennes narrowing primarily contains coherent contributions from C belonging to the chain, whereas the remaining regions are dominated by the C60 sub-unit. The observed narrowing at intermediate-Qs therefore arises from dynamical arrest of C atoms within the chain. This structural arrest disappears in the pre-melting transition, giving rise to the emergence of additional spectral broadening as seen through an increase in m21/2. Detailed examination of simulation trajectories also shows that in the pre-melting phase the chains have full mobility, whereas in the solid phase their positions are confined to more localised regions of space, which corroborates the idea of a loss of de Gennes narrowing at intermediate Qs during this transition. In addition, a number of PCBM molecules undergo full rotational transitions between adjacent voids within the C60 matrix. However, this process appears to be slow, thus only a subset of the molecules perform this full rotation over a period of 2 ns. We also observe that the molecules which perform this rotation are generally not located together, which gives us a degree of confidence that this is not a property associated with nucleation of the liquid phase, but instead is a genuine dynamical process at thermal equilibrium. A more robust analysis of the time-scales associated with these “void hoppings” would require a longer trajectory in the pre-melt phase and is, therefore, deferred to future work.
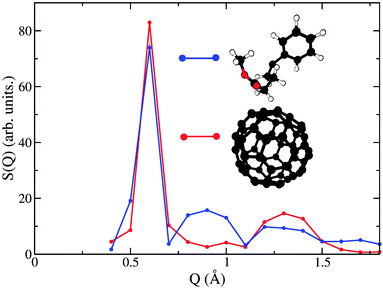 | ||
| Fig. 6 Decomposition of the neutron-weighted structure factor S(Q) into partial contributions from C60–C60 (red) and chain–chain (blue) correlations. | ||
The agreement between experiment and simulation for the melted phase is of a semi-quantitative nature. In particular, we note that the comparison of energy broadenings across the entire Q-range of the neutron experiments is similar, giving us confidence that the simulation model is providing a suitable description of the structure and dynamics of the material. The de Gennes narrowing at high-Qs appears at a similar value of Q, yet it spans a wider range of Q than in experiment. It is also noteworthy that the overall trend for this spectral narrowing to shift progressively to lower Qs following each subsequent phase transition is seen in both experiment and simulation.
The self-diffusion coefficient of PCBM in the liquid state was calculated from simulation at TR = 1.16, and found to be Ds ∼ 8 Å2 ns−1. This value is ca. two orders of magnitude lower than those of simple molecular liquids like water, a decrease which, to first order, may be viewed as arising from the much-heavier mass of PCBM. From the CMD simulations, we also infer that centre-of-mass motions of a given PCBM molecule in the liquid conform to those of a structurally caged particle as opposed to the continuous (Fickian) diffusion characterising simpler (and smaller) molecular systems. This behaviour is attested via inspection of the linear portion of simulated mean-squared centre-of-mass displacements, which only approach the Fickian limit after ca. 1 ns. Although these timescales are not within the direct reach of the present neutron study, our analysis of the underlying (and faster) Q-dependent two-particle correlations are nonetheless able to capture the essential physics of the process, i.e., via the observation of a progressive disappearance of spatio-temporal correlations over length-scales associated with characteristic intermolecular distances in PCBM.
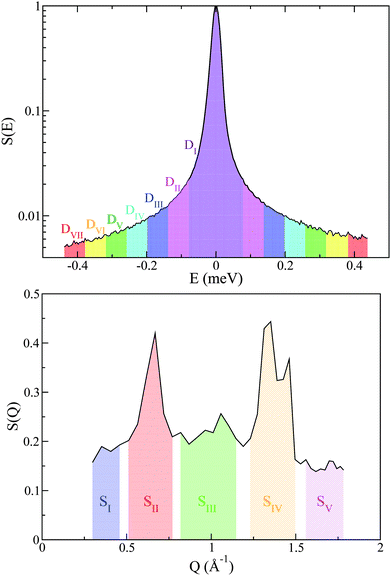
Additional support for the progressive order–disorder transitions and underlying microscopic mechanisms observed in PCBM is provided by an analysis of the temperature evolution of neutron spectra. To this end, we dissect the S(Q,E) into five distinct regions in Q, as shown in Fig. 7. These regions of Q separate regions containing prominent structures from those that do not. These structural (S) groupings shall be referred to as SI–V. In addition to focusing on specific regions of Q, we also calculate integrals for specific E windows. Each of these integrals are normalised by its corresponding value at the lowest temperature accessed in the neutron-scattering experiments (T = 233 K). This procedure enables a detailed examination of changes to S(Q,E) relative to the low-temperature solid, as shown in more detail in Fig. 7. In line with our dissection along Q, these dynamical (D) windows are referred to as Di(E), where:
 | (2) |
The integrals shown above are performed over a given energy range, Si(E) is the neutron-weighted spectrum averaged over a give range of Q-values, and Sref represents the chosen reference state (in our case, T = 233 K).
A total of seven D-windows were chosen for our analysis, each of which is labeled in Fig. 8 for structural group SV. All S-groups display a similar trend, involving a gradual broadening of neutron spectra with temperature. Each D-window reaches a maximum which occurs at progressively higher temperatures with increasing energy-transfer interval (cf.Fig. 8).
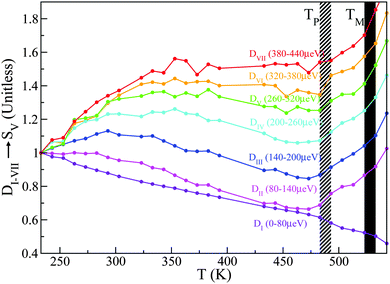 | ||
| Fig. 8 D I–VII for structural group SV. Striped- and solid-black regions correspond to the pre-melting and melting transitions, respectively. See the main text for further details. | ||
It is noteworthy that for structural groups SIV and SV, there is a net decrease in the value of DII–VI after reaching a maximum, indicating that the observed spectral broadenings ‘sweep through’ these energy-transfer intervals within the studied temperature range. In all cases, the lowest energy interval primarily associated with purely elastic events decreases with temperature, thereby signaling a gradual loss of structure. The higher-energy windows eventually plateau with temperature, indicating either ‘saturation’ or passage into higher-frequency regions beyond the range accessible on OSIRIS. Upon a further increase in temperature, the pre-melting transition occurs. The temperature range spanning the pre-melting phase exhibits a large broadening in energy across all D-windows except for the elastic region De = DI, followed by an abrupt change of gradient upon reaching the full melting transition. These two changes in the gradient of these observables upon crossing both transitions indicates a large increase in QENS signal across, pointing towards progressively stronger, thermally activated motions. It is clear from this analysis of S(Q,E) that slow tail motions persist even at low temperatures, well below pre-melting.
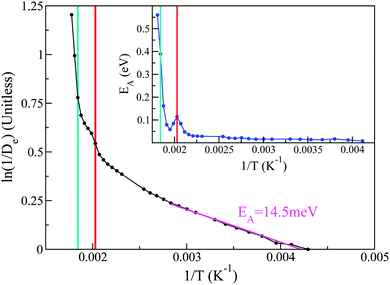
With the above considerations in mind, we can also provide an activation energy EA, associated with the loss (gain) of elastic(QENS) signals associated with tail motions. To this end, the magnitude of 1/De in structural group SV acts as a measure of the melting, whose Arrhenius behaviour is calculated as a function of temperature T using
 | (3) |
Taking the local gradient of ln(1/D) vs. 1/T, we see that the activation process reaches a maximum during the pre-melting transition and returns to a lower value, thereby indicating that pre-melting requires additional latent energy to that provided by thermally activated motions in the lower-temperature solid phase. A similar initial increase in activation energy is also observed as the melting transition is crossed, its more pronounced character indicating that this increase is now related to the increased mobility of the entire PCBM molecule as opposed to only its tails. These trends are in line with the DSC data reported earlier in this work and, therefore, provide additional support to our microscopic picture of the pre-melting and melting transitions in the prototypical substituted fullerene PCBM.
4 Outlook
Using QENS experiments and CMD simulations over a wide temperature range, we have established that tail motions in PCBM lie at the heart of its thermodynamic phase behaviour. Notwithstanding current limitations to describe PCBM at a quantitative level using state-of-the-art force fields, a detailed analysis of experimental and simulated neutron-weighted dynamic structure factors in the QENS regime signals the presence of both an order–disorder transition, followed by a genuine liquid phase. We also provide a quantitative measure of the activation energy associated with the process of pre-melting, and show how the QENS data may be dissected in momentum- and energy-transfer so as to provide spatially and temporally resolved information at the atomic level that can be ultimately linked to the thermophysical properties of the material, particularly its calorimetric response. These new insights evince that it is the tail in this chemically substituted (and ubiquitous) fullerene the one driving these phenomena at a microscopic level. Conversely, this work provides a rationale as to why its absence in the parent fullerene C60 results in the complete suppression of stability for phases beyond the solid. More generally, gaining further physico-chemical insights into this class of materials also offers the enticing prospects of understanding and ultimately controlling their behaviour at the nanoscale, of certain relevance to the rational design of next-generation energy materials.Acknowledgements
The UK Science and Technology Facilities Council is gratefully acknowledged for financial support under Contract No. 3624, and the provision of beamtime on the OSIRIS spectrometer (Award No. RB1510601). We also thank the UK Engineering and Physical Sciences Research Council for financial support in the form of a Leadership Fellowship (EP/JOO3859/1), and the Imperial College High Performance Computing Service for the provision of computational resources.References
- N. Asim, K. Sopian, S. Ahmadi, K. Saeedfar, M. A. Alghoul, O. Saadatian and S. H. Zaidi, Renewable Sustainable Energy Rev., 2012, 16, 5834–5847 CrossRef CAS
.
- D. Chen, A. Nakahara, D. Wei, D. Nordlund and T. Russell, Nano Lett., 2011, 11, 561–567 CrossRef CAS PubMed
.
- E. Verploegen, R. Mondal, C. J. Bettinger, S. Sok, M. F. Toney and Z. Bao, Adv. Funct. Mater., 2010, 20, 3519–3529 CrossRef CAS
.
- S. Parker, S. M. Bennington, J. W. Taylor, H. Herman, I. Silverwood, P. Albers and K. Refson, Phys. Chem. Chem. Phys., 2011, 13, 7789–7804 RSC
.
- M. R. Stetzer, P. A. Heiney, J. E. Fischer and A. R. M. and, Phys. Rev. B: Condens. Matter Mater. Phys., 1997, 55, 127–131 CrossRef CAS
.
- W. I. F. David, R. M. Ibberson and T. J. S. Dennis, Europhys. Lett., 1992, 18, 219–225 CrossRef CAS
.
- A. Cheng and M. L. Klein, Phys. Rev. Lett., 1993, 71, 1200 CrossRef CAS PubMed
.
- M. H. J. Hagen, E. J. Meijer, G. C. A. M. Mooij, D. Frenkel and H. N. W. Lekkerkerker, Nature, 1993, 365, 425–426 CrossRef CAS
.
- B. Pevzner, A. F. Hebard and M. S. Dresselhaus, Phys. Rev. B: Condens. Matter Mater. Phys., 1997, 55, 16439 CrossRef CAS
.
- P. Orea, J. Chem. Phys., 2009, 130, 104703 CrossRef PubMed
.
- H.-W. Liu, D.-Y. Chang, W.-Y. Chiu, S.-P. Rwei and L. Wang, J. Mater. Chem., 2012, 22, 15586 RSC
.
- L. Ye, S. Zhang, D. Qian, Q. Wang and J. Hou, J. Phys. Chem. C, 2013, 117, 25360–25366 CAS
.
- A. A. Y. Guilbert, L. X. Reynolds, A. Bruno, A. MacLachlan, S. P. King, M. A. Faist, E. Pires, J. E. Macdonald, N. Stringelin, S. A. Haque and J. Nelson, ACS Nano, 2012, 6, 3868–3875 CrossRef CAS PubMed
.
- M. T. F. Telling, S. I. Campbell, D. Engberg, D. Martin y Marero and K. H. Andersen, Phys. Chem. Chem. Phys., 2016, 18, 8243 RSC
.
- F. Demmel, D. McPhail, J. Crawford, D. Maxwell, K. Pokhilchuk, V. Garcia-Sakai, S. Mukhopadhyay, M. T. F. Telling, F. J. Bermejo, N. T. Skipper, F. Fernandez-Alonso, European Physical Journal Web of Conferences, 2015, 83, 03003.
- M. T. F. Telling and K. H. Andersen, Phys. Chem. Chem. Phys., 2005, 7, 11255–11261 RSC
.
- J. Taylor,
et al.
, Bull. Am. Phys. Soc., 2012, 57, W26.10 Search PubMed
, http://meetings.aps.org/link/BAPS.2012.MAR.W26.10.
- S. Mukhopadhyay, RAL-TR-2014-005, 2014, 1–80.
- J. C. Philips, R. Braun, W. Wang, J. Gumbart, E. Tajkhorshid, E. Villa, C. Chipot, R. D. Skeel, L. Kale and K. Schulten, J. Comput. Chem., 2005, 26, 1781–1802 CrossRef PubMed
.
- G. Paternò, A. J. Warren, J. Spencer, G. Evans, V. G. Sakai, J. Blumberger and F. Cacialli, J. Mater. Chem. C, 2013, 1, 5619 RSC
.
- P. A. Heiney, J. Phys. Chem. Solids, 1992, 53, 1333 CrossRef CAS
.
- T. Róg, K. Murzyn, K. Hinsen and G. R. Kneller, J. Comput. Chem., 2003, 24, 657–667 CrossRef PubMed
.
- M. T. Rispens, A. Meetsma, R. Rittberger, C. J. Brabec, N. S. Sariciftci and J. C. Hummelen, Chem. Commun., 2003, 2116–2118 RSC
.
- F. Frigerio, M. Casalegno, C. Carbonera, T. Nicolini, S. V. Meille and G. Raos, J. Mater. Chem., 2012, 22, 5434 RSC
.
- F. Machui, S. Rathgeber, N. Li, T. Ameri and C. J. Brabec, J. Mater. Chem., 2012, 22, 15570 RSC
.
- CrystalDiffract, http://www.crystalmaker.com/crystaldiffract.
-
F. Fernandez-Alonso and D. L. Price, Neutron Scattering – Fundamentals, Academic Press, 2013 Search PubMed
.
- A. Goel, J. B. Howard and J. B. V. Sande, Carbon, 2004, 42, 1907–1915 CrossRef CAS
.
- F. Fernandez-Alonso, F. J. Bermejo, I. Bustinduy, M. A. Adams and J. W. Taylor, Phys. Rev. B: Condens. Matter Mater. Phys., 2008, 78, 104303 CrossRef
.
| This journal is © the Owner Societies 2016 |

