Optimisation and costing of faecal sludge management options for Lusaka's informal settlements†
Ruth
Kennedy-Walker
a,
Tomas
Holderness
b,
David
Alderson
a,
Jaime M.
Amezaga
a and
Charlotte A.
Paterson
a
aSchool of Civil Engineering and Geosciences, Cassie Building, Newcastle University, Newcastle Upon Tyne, NE1 7RU, UK. E-mail: ruth.kennedywalker@gmail.com
bSMART Infrastructure Facility, University of Wollongong, Wollongong, New South Wales 2522, Australia
First published on 11th September 2015
Abstract
Faecal Sludge Management (FSM) is achieving traction in developing countries as a technical solution for the safe management (collection, transportation and in some cases treatment and end-use/safe disposal) of Faecal Sludge (FS) captured by onsite systems. Whilst some approaches do exist the overall availability of tools, data and practical examples to support decision makers in the implementation of FSM services on the ground is limited. This study aims to address some of these sector limitations by presenting a long-term costing methodology that was developed for two informal settlements in Lusaka, The Republic of Zambia. The approach compares the costs associated with a number of feasible fixed infrastructure and transportation technology scenarios over a 25 year design period. Within the analysis a spatio-topological tool was utilised to model proposed FSM networks and allowed the path of least-time transportation to be identified. This was then used to calculate Net Present Value and Average Incremental Cost, for seven different FSM scenarios, over a 25 year design life. The results of the study show that FSM could provide an affordable solution for the provision of sanitation services to Lusaka's poorest communities. The research conducted aims to support planners in Lusaka but also presents a number of methodologies that could be beneficial to the wider sanitation sector.
Water impactA novel spatio-topological tool that optimises the transportation component of Faecal Sludge Management is presented. The paper presents how results from use of the tool can be used to further support the development of long-term costing for possible Faecal Sludge Management in the city of Lusaka, Zambia. The methodologies and results developed can support sanitation planning in Lusaka and beyond. |
1 Introduction
Faecal Sludge Management (FSM) involves the manual or mechanical emptying of FS from onsite sanitation systems, and transportation of waste to treatment facilities using road-based equipment.1 Various combinations of fixed infrastructure and transportation technologies can be used within FSM service delivery and are discussed in detail by Tilley et al.2 The role of FSM as a viable, affordable and sustainable technical solution for the safe management of FS has achieved traction in recent years with many scholars emphasising its potential for meeting the global sanitation challenge.4–7However, recent work looking more closely at FSM identifies that more tools and approaches need to be developed that promote FSM as a viable solution, and support decision makers on the ground.3,5 Sector-wide there are a restricted number of costing methodologies available and limited financial information to support the development of detailed cost analysis for FSM.4,7,8 A lack of consideration for the long-term operational, maintenance and capital costs associated with sanitation service delivery has shown to cause project failure or long-term reliance on external subsidies.9 Further, investments in sanitation should reinforce rather than undermine current community and government facilities and financial resources to ensure success.10 This is particularly relevant in informal settlements where users' ability to pay is limited. Therefore, detailed costing methodologies should be used early on in the planning and implementation process to ensure that only sustainable and affordable service delivery options are considered and implemented.11 In conjunction, whilst a number of costing methodologies exist, they commonly only consider the first year of operation or the initial stages of the Sanitation Value Chain (i.e. containment) and therefore do not achieve the above objective.7,12,13
Another major barrier to the success of FSM solutions is reported to be the costs associated with the operation and maintenance of FS transportation vehicles and specialists, indicating that more consideration is required of this component.1,1,4,12 For example, Transfer Stations (TSs) can be utilised to reduce the distance over which FS has to be transported, and therefore a greater focus on their use and optimisation is required to increase the overall efficiency of FSM systems as a whole.4,14
This paper looks to support the status of FSM within the sector by addressing some of the gaps identified from the literature. The paper introduces a long-term costing methodology that was developed for two informal settlements in Lusaka, The Republic of Zambia. Within the methodology long-term costs were developed for seven different fixed infrastructure scenarios using both manual and motorised FSM transportation technologies. Within the analysis a spatio-topological network was created and the results utilised to optimise the transportation component of the system and show how this influences the long-term costs of various FSM service delivery scenarios.
1.1 The existing sanitation situation in Lusaka
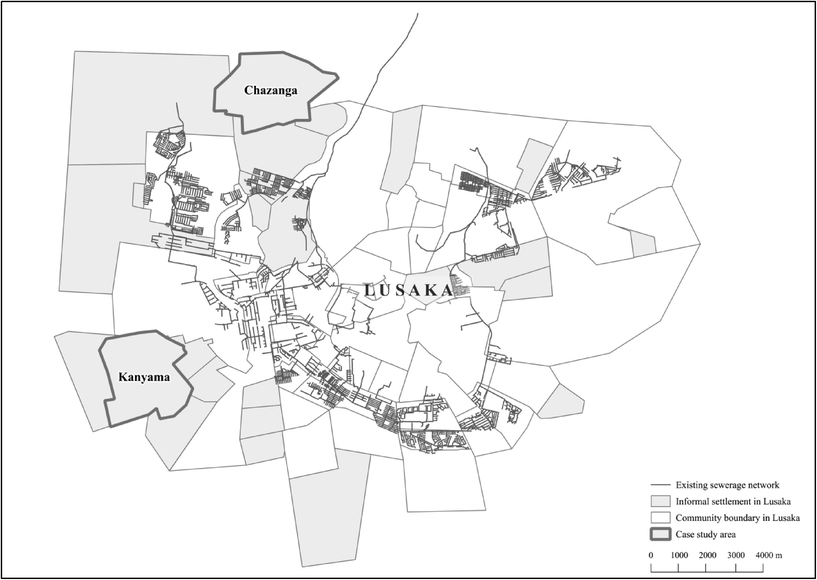
Lusaka is the capital city of The Republic of Zambia and it is reported that over 60% of the population live in informal settlements which have been developed devoid of planning regulation.15 Sanitation provision via conventional sewerage, onsite septic tanks, or formalised FSM services are only available to middle and high-income residents living in planned areas of the city.16 In contrast, low income unplanned areas have little or no sanitation service provision16 leading to large areas of the city with inadequate infrastructure required to meet the sanitation needs of the population (see Fig. 1). Fig. 1 exemplifies this, showing that only 9 of the 21 informal settlements in Lusaka are provisioned by the formal sewerage network.Within informal settlements in Lusaka, privately-owned communal pit latrines are estimated to be used by approximately 90% of the population.17 These facilities are often poorly designed and constructed without formalised design standards, and pose a high risk to the surrounding environment and public health through the contamination of groundwater.12 Once full, informal emptying practices composed of manually emptying the facilities and dumping the faecal waste indiscriminately cause further environmental and public health risks.12
In 2013 and 2014 respectively, the commercial utility Lusaka Water and Sewerage Company supported the implementation of a pilot FSM service delivery in two informal settlements, Kanyama and Chazanga (see Fig. 1). Community Based Organisations, known as Water Trusts, exist in both settlements as the primary water service providers. The Water Trusts are the lead overseeing bodies in both FSM pilots.18,19 The pilots consist of providing a service to manually empty and transport FS from households, treat the sludge at a community-level decentralised anaerobic treatment facility, and to dry and sell the resulting biosolids.18 During author observation of the pilots they appear to be successful with a continuous customer base although a full evaluation of these service provisions has not occurred to date.
Whilst pilot FSM services have been implemented the challenge now is to scale up such solutions to achieve city-wide access to sanitation service delivery. The current absence of sanitation services in the majority of informal settlements and the lack of detailed long-term plans and cost analysis to prescribe solutions means Lusaka provides an ideal location to develop a decision support tool. This paper presents such methodology, which could support the planning and implementation of future FSM interventions. The proposed decision support tool developed consists of a long-term cost analysis for various fixed infrastructure, transportation and containment design scenarios for the two informal settlements of Kanyama and Chazanga.
2 Methodology
The methodology conducted comprised of several parts. First, spatio-topological networks were developed to identify the transportation time requirements for each modelled FSM scenario. The network model development consisted of a pre-processing stage followed by analysis. Once the network pre-processing and analysis had been conducted transportation time and fixed operational costs were calculated for each scenario so that a long-term costing analysis could be completed. The following section below explains each stage of this process in detail.2.1 Study area scenarios
The two informal settlements of Kanyama and Chazanga were selected as the focus of this study due to the existent FSM services and the availability of data to support the methods (shown in ESI† A). Seven fixed infrastructure scenarios were selected for modelling based on the pilot FSM projects,18 the proposed Lusaka sanitation master plan16 and technical literature related to FSM.2 For all seven scenarios a long-term costing model was completed, simulating the use of both manual and motorised emptying and transportation technologies for the primary transportation component. Each scenario was tested with a range of parameters to simulate different potential options (see Table 1). The motorised option selected was the Vacutug Mark II technology20 whilst the manual option was based on the technology currently being utilised in Lusaka's FSM pilots (i.e. buckets, spades and carts).18Table 1 below summarises the fixed infrastructure and transportation technology scenarios and variation selected for this study.| Scenario | Scenarios and variations | Removal & primary transportation | TS(s) | Secondary transportation | Treatment |
|---|---|---|---|---|---|
| 1 | 1A ≧ | Manual cart | Community level treatment facility located next to water trust | ||
| Vacutug | |||||
| 1B ≧ | Manual cart | Community level treatment facility located centrally | |||
| Vacutug | |||||
| 2 | 2A ≧ | Manual cart | Single TS | Vacuum tanker | Manchinchi wastewater treatment facility |
| Vacutug | |||||
| 2B ≧ | Manual cart | Multiple TSs | Vacuum tanker | Manchinchi wastewater treatment facility | |
| Vacutug | |||||
| 3 | 3A ≧ | Manual cart | Manchinchi wastewater treatment facility via sewer discharge station | ||
| Vacutug | |||||
| 3B ≧ | Manual cart | Single TS | Vacuum tanker | Manchinchi wastewater treatment facility via sewer discharge station | |
| Vacutug | |||||
| 3C ≧ | Manual cart | Multiple TSs | Vacuum tanker | Manchinchi wastewater treatment facility via sewer discharge station | |
| Vacutug |
2.2 Development of spatio-topological network
For each modelling scenario (see Table 1) a spatio-topological network model was constructed. For scenarios which did not use Transfer Stations (TSs) the spatial network was built so that geometric road length between containment and treatment could be established. A graph-based approach, developed by Newcastle University, was used to identify the minimal transport time associated with those scenarios that utilised TSs within the network.21 A previously published paper demonstrates that this methodology can successfully identify the least-time transportation network for FSM systems based on identifying optimum TS locations.22 For this methodology an extra pre-processing step was required so scenarios representing the least amount of transportation time could be identified for analysis of scenarios using single and multiple TS variations (discussed in section 3.2.2).The distance and speed of FS transportation routes was computed, and the shortest transportation path was then calculated based on travel time. Speeds of 2.5 km per hour were attributed to the primary transportation networks for both types of technologies based on the maximum Vacutug velocity and average walking speeds adjusted to take into account uneven road surface in both communities.2 Secondary transportation speeds (vacuum tanker) were set at 35 km per hour based on the literature.23 The final pre-processing step was to construct a spatio-topological model of the sanitation network, used to calculate total waste travel time across the shortest possible path from FS collection points, to transfer station, and then on to the end-point.
 | ||
| Fig. 2 Topological configurations.22 | ||
In the single TS configuration the sum of the journey time over the shortest path from each of the collection points to the TS plus the travel time from the TS to end point was computed.22 In the multiple TS configurations the model optimises the TS locations on a per collection basis, with the number of TSs being limited by the number of suitable areas identified in the multi-criteria evaluation. The shortest paths between network locations were calculated based on travel time for each road using Dijkstra's algorithm.25,26 The results of the TS optimisation were then used within the long-term costing methodology. For those scenarios without TSs the transport time was established from geometric road lengths and transport equipment travel speeds.
2.3 Long term costing methodology
Once the spatio-topological networks had been developed and analysed the results were used in the development of the long-term costing methodology. A design period of 25 years was selected based on the typical concession period used within the sector.27 The input parameters required (associated with socio-economic data, fixed infrastructure data and transportation equipment data) were collected so that they could be input into the long-term cost analysis for each settlement. A full list of parameters can be found in the ESI† B.To calculate the long-term costs, both the capital costs and, operation and maintenance costs associated with each scenario and variation were included. The total capital costs were produced for each year based on the cost of each unit of equipment or infrastructure and included any new equipment required, accounting for inflation. The operation and maintenance costs were calculated based on the annual costs associated with each piece of infrastructure or equipment that was required, again adjusted for inflation. The model incorporated annual population growth for each settlement and the economic life of equipment and infrastructure used was also accounted for in the model. For each scenario and variation the Net Present Value (NPV) was calculated (using eqn (1) found in ESI† C) and the minimum household charge (monthly) required for each scenario to break even over the 25 year design life was determined.
The Average Incremental Cost (AIC) was also determined as it is a widely-used approach in the sector when comparing potential costs between varying engineering projects.28 It was calculated using eqn (2) and (3) found in ESI† C (to compare the various scenarios modelled objectively based on US$ cost per m3 of FS emptied and transported).
The analysis also provided a breakdown of the overall cost per m3 of FS into individual components (individual capital, maintenance, wear and tear, labour, fuel and oil and discharge costs) so the associate expenditure variation between each scenario could be identified. All of the calculations were set up in a Microsoft Excel spreadsheet and the equations used are provided in the ESI† section D.
3 Results and discussion
The results of the long-term costing methodology for various FSM scenarios and variations for two informal settlements in Lusaka are discussed below. Where required, the spatio-topological methodology was successfully used to identify optimum single and multiple TS configurations, which allowed the least-time transportation networks to be modelled to calculate NPV and AIC. Fig. 3 below provides results of the optimised transportation distances identified for each scenario. The spatial network developed and the optimum TSs selected are shown in Fig. 5.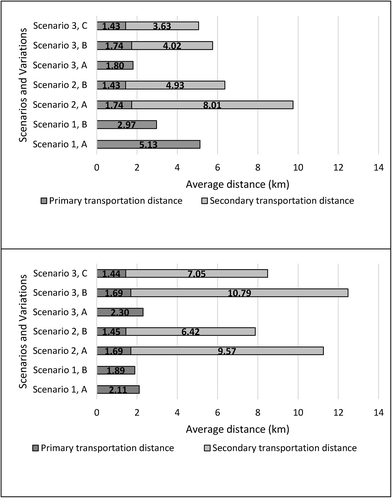 | ||
| Fig. 3 Average FS transportation distances required for each scenario and variation in Kanyama (top graph) and Chazanga (bottom graph) after optimisation. | ||
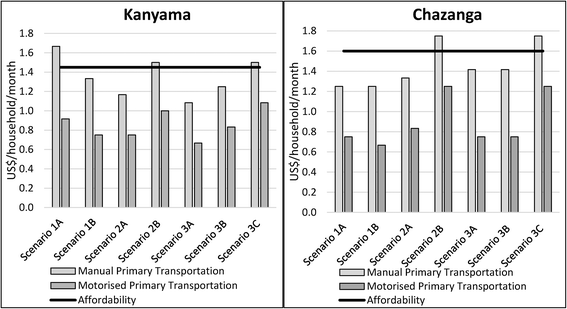 | ||
| Fig. 4 Break even net present value and affordability of various FSM scenarios for two informal settlements in Lusaka. | ||
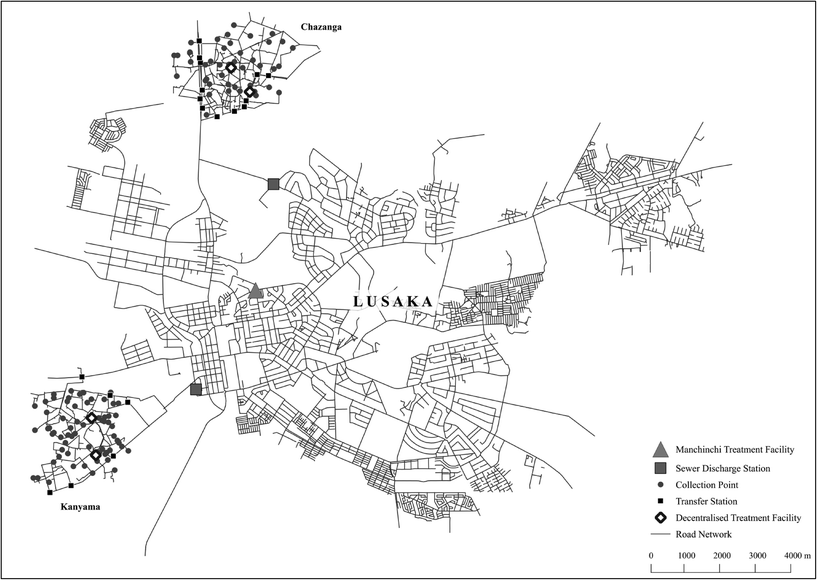 | ||
| Fig. 5 Complete transportation network and fixed infrastructure scenarios analysed in Lusaka (data derived from LWSC data). | ||
The long-term costs associated with three different fixed infrastructure scenarios and variations to improve FSM in informal settlements of Lusaka were determined. Fig. 4 below shows the results for breakeven Net Present Value for each scenario and highlights that the majority of options would be deemed affordable if it is assumed that 0.5% of the household's overall income could be allocated to spending on sanitation services.12
The results showed that overall the scenario with the lowest costs associated for Kanyama was Scenario 3A which transports FS directly from collection points to the sewer discharge station using primary transportation equipment. In Chazanga it was Scenario 1B that has the lowest costs associated which transports directly to a community-level treatment facility using primary transportation equipment. In both cases these results were expected as both scenarios utilised no secondary transportation system, had the shortest transport distances associated and used fixed infrastructure with the least-cost associated (i.e. no TSs).
During the analysis the costs associated with various components of the network were established. For all scenarios the majority of the cost (percentage of total costs in US$) was shown to be associated with the primary transportation system and were applicable discharge costs (only for end point of Wastewater Treatment Plant or Sewer Discharge Station). This infers that if cost saving or optimisation were required the focus should be on reducing costs associated with the primary transportation components (i.e. distance travelled, efficiency of emptying, capital cost of equipment, labour and fuel efficiency) and discharge fee. Where multiple TSs were used the costs associated with fixed infrastructure increased greatly.
A cost breakdown of the Average Incremental Cost for each scenario revealed that for those scenarios which utilised manual primary transportation the largest proportions of the cost related to labour and fuel, whilst those options which used motorised primary transportation was shown to have a higher cost associated with components which were more variable, such as capital, shipping costs, fuel and oil.
The results of the breakeven household charges and value for AIC showed that those options that utilise manual primary transportation system were between 27–49% more expensive than the motorised options for both Chazanga and Kanyama. Despite those scenarios which utilised manual primary transportation equipment having lower capital costs associated, they had higher overall fleet requirements and associated operation and maintenance costs (including high costs associated with labour) which caused the overall cost to be higher.
For those scenarios which utilised TSs (Scenario 2A & B and 3B & C – Table 1) the results showed that the costs were higher when multiple TSs were utilised rather than a single TS. Despite an overall reduction in the transportation distance being achieved when multiple TSs were used the associated cost saving did not outweigh the cost incurred (capital and operation and maintenance costs) by using more TSs. These results highlight the importance of modelling the long-term costs associated with FSM networks which both utilise TSs is important to understand the merits of both options (relates to cost, fleet requirements, distance requirements and associated wear and tear).
Beyond analysis of the lowest costing scenarios, consideration of the non-technical factors which may influence decisions over which scenarios or variations are the most applicable for each location were made. In the majority of the scenarios modelled, some form of fixed infrastructure was required to be built within the community itself. Due to the nature of informal settlements and in some cases because of their illegal status, the acquisition of land can be difficult and could restrict implementation of certain scenarios.29 Having infrastructure internally located and possibly managed in such communities may also be limited by the existence of the required technical, financial and managerial capacity. Limitations may also exist on the primary transportation fleet size which can be feasibly managed in each community.
A final consideration between using either manual or motorised emptying options relates to the health and safety risk associated with each. The manual option poses health and safety risks to the operators themselves due to their direct contact with FS, however with proper personal protective equipment and training this risk could be significantly reduced. This risk is less prominent in the motorised options as less direct handling of FS occurs. The emptying practice used by manual emptiers to gain access to the FS also carries a risk as the pit latrine can collapse due to its structural integrity being compromised. Such an event would carry environmental risk in addition to the risk to individuals operating the facility. It is also of interest to note that manual removal options such as those modelled in this study may not be in line with Joint Monitoring Programs' post 2015 Water, Sanitation and Hygiene indicators and therefore may not be promoted by the sector.30
4 Limitations
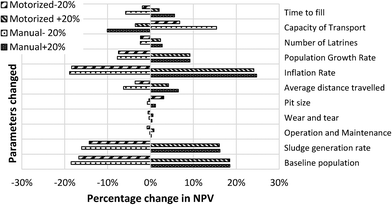
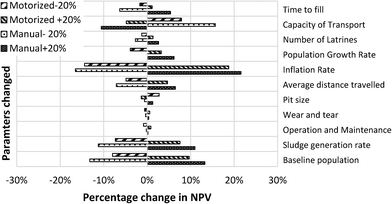
There are several limitations within this study concerning the input parameters, data availability, processing and the cost analysis methods. It should be noted that this cost analysis is based on two specific informal settlements in Lusaka and therefore the numerical results have limited applicability to other locations globally. However, the methodology in general would be applicable to other locations based on the transferability of the network-based approach and the cost methodology developed.Due to poor data availability and reliance on secondary sources the input parameters used in this study and the spatio-topological network developed are open to errors. A simplistic sensitivity analysis was conducted (varying input parameters by ±5% – Fig. 6 and 7) and provides a useful indication of which input parameters need to be the most accurate and which factors should be concentrated on to provide the highest return on investment. In data-poor settings the use of such a sensitivity analysis is advantageous to highlight which parameters should be prioritised for data collection. Fig. 6 and 7 identify inflation rate, sludge generation rate and baseline population as being critical to the accuracy of the final results by having the largest impact on the overall NPV calculations.
Where possible, primary data should be collected or precise secondary data should be sourced for all of the required input parameters to ensure the accuracy of this methodology. If the required data doesn't currently exist, primary data collection should be attempted. Many of the parameters related to the spatial data required for this methodology (specifically transport networks and onsite facilities) could be collected using high-cost traditional topographic surveys. Alternatively, crowd-source mapping and data collection could be employed as a cost-saving alternative, whereby volunteers create maps and collect data using mobile technologies such as smartphones with built-in GPS technology, or handheld Geographic Information System (GIS) equipment, alongside remotely sensed imagery and existing paper maps.22 In the case of the non-spatial data parameters, high-cost in-depth city/country wide studies or surveys are likely to be required for the collection of accurate primary data (e.g. inflation rate, sludge generation rate and baseline population). In the absence of data, where primary data cannot be collected, estimates should be sort from the cross referencing of reliable secondary sources. For example, the sludge generation parameter value used in this study, which was one of the 3 key data parameters identified from the sensitivity analysis, was found from cross-referencing figures quoted from informal settlements from other African cities and using these figures as proxies to establish an estimate for Lusaka.
There were several components which were not included in this study which would affect the cost of the project and the ease of its implementation. These include;
• Purchasing any land required
• Cost to alter or rebuild containment facility
• Cost associated with management (i.e. higher wages, overheads or office)
• The depreciation values for any of the fixed assets (equipment) modelled
• The costs associated with the final component of disposal or reuse of FS
• The presence and effect of Municipal Solid Waste
• In-direct costs associated with practices
There were a number of simplifications and assumptions that were made during this cost analysis process. It was firstly assumed that all end points (sewerage system and centralised wastewater treatment plant) would be technically feasible. Due to difficulty in predicting how population growth would occur it was assumed that the future population growth would only affect the population density (i.e. number of people per household) and not the physical growth of each settlement. The cost analysis also assumed that the whole community in both informal settlements would require access to the FSM service. In reality, a detailed analysis of these elements would be required.
Both methods used (NPV and AIC) provide very crude and simplistic methods of conducting long-term financial analysis which fail to account for important financial aspects (uncertainties) such as rising fuel prices, government incentives, currency devaluation and the effect of subsidies or tax breaks.31 The analysis did not take into consideration variations in the rate of inflation and population growth or include any contingency for extra costs (i.e. interest fees) which may be incurred if loans were taken out to finance the required initial capital investments.
5 Conclusions and recommendations
This paper directly addresses needs identified within the sector and for Lusaka through the development of improved decision support tools which assess the long-term costs associated with FSM service provision. The costings produced were focused on two informal settlements in Lusaka and modelled the long-term costs associated (capital and operation and maintenance) with seven different fixed infrastructure scenarios involving the use of both manual or motorised emptying and primary transportation technologies.Firstly, the optimisation of the transportation component using the spatio-topological methodology was successfully completed for the two selected informal settlements. The optimisation helped to ensure that minimum time transportation networks were selected for analysis, thus, ensuring that the costing analysis was completed for the most efficient transportation networks from the outset. This provides a useful tool in terms of city-wide planning as it helps to compare and identify the least-cost scenarios (in terms of the transportation component) prior to completing an in-depth cost analysis.
Through employing a variety of fixed infrastructure scenarios, optimum FSM networks for the 2 settlements, based on cost, were identified. Whilst different scenarios were optimum for each settlement, the scenarios which had the lowest primary transportation distance, only utilise primary transportation equipment and utilised the minimum amount of fixed infrastructure had the lowest costs associated. The results also indicated that the majority of scenarios were deemed affordable in both settlements. The results showed that the comparison of the various fixed infrastructure scenarios is useful for planning as it allows possible options to firstly be identified and then compared against each other in terms of costs. The feasibility of each option can then be further assessed once the financial viability has been exposed.
The results indicated that utilising manual equipment was more expensive than using motorised equipment in all of the scenarios modelled. The reasons for this being the high fleet and labour requirements associated with using the manual options. However, motorised emptying was shown to have a higher cost associated with components which were more variable, such as capital, shipping costs, fuel and oil. In all scenarios the results indicated that a large proportion of the cost was associated with the primary transportation technology (manual cart or Vacutug) and, therefore, if cost saving was required, the focus should be on this part of the network.
There was shown to be a higher cost associated with scenarios that utilised multiple TSs over those that use a single TS. The use of multiple TSs was shown to reduce the overall transportation distance required but the cost of implementing multiple TSs (capital and operational costs) was shown to be higher than the cost saving made by this reduction.
The cost associated with the scenarios were shown to be sensitive to various input parameters. It was highlighted that accurate transportation network data was an important parameter as the average transportation distance (between collection point and end point) had an effect on the overall cost. Variations in population, sludge generation rates, inflation rate and primary transportation volumetric capacity were shown to cause the largest variations in the total cost of the least cost FSM scenario for each settlement.
A further extension of this analysis would be to assess the long-term costs associated using other transportation technologies and other types of sanitation systems so that a direct comparison between them could be made. It would also be beneficial to complete this cost analysis in a number of further locations (inside and outside Lusaka) and to compare it to real world FSM services. This would help establish the financial sustainability of road-based FSM in a more generalised context as well as to confirm the accuracy and usability of such a model. It would also be beneficial to ensure that all parameters are obtained via primary data collection and specific research is conducted to ensure the accuracy of the input parameters.
In summary, these findings help to support the notion that road-based FSM systems could provide a financially-sustainable and affordable solution to help improve the sanitation situation in informal settlements in Lusaka. A spatio-topological methodology was used to optimise the potential fixed infrastructure scenarios so that least-time transportation networks could be identified prior to further analysis. The results produced were then used to develop a robust long-term cost analysis of various feasible FSM scenarios for two informal settlements in Lusaka. Notwithstanding the studies' identified limitations, the results could be used to help support planning for FSM implementation in Lusaka by providing detail on the financial and logistical requirements for FSM which could be directly compared with other types of available solutions (i.e. conventional sewerage). Beyond Lusaka, this paper addresses the need within the sector for more decision support tools and costing methodologies to be available to support planning for FSM service delivery and provides further evidence that FSM can provide a sustainable and viable technological solution to the global sanitation crisis.
Acknowledgements
The authors would like to acknowledge the funding received by the UK Engineering and Physical Science Research Council (project EP/J00538X/1). The authors would also like to acknowledge the support of Lusaka Water and Sewerage Company and Water and Sanitation for the Urban Poor. We acknowledge the receipt and subsequent use of data supplied by Lusaka Water and Sewerage Company to facilitate this research.References
- M. O'Riordan, Investigation into methods of pit latrine emptying, Partners in Development, WRC Project 1745, Durban, South Africa, 2009 Search PubMed.
- E. Tilley, C. Lüthi, A. Morel, C. Zurbrügg and R. Schertenleib, Compendium of Sanitation Systems and Technologies, Swiss Federal Institute of Aquatic Science and Technology, Eawag, Dübendorf, Switzerland, 2008 Search PubMed.
- A. Peal, B. Evans, I. Blackett, P. Hawkins and C. Heymans, Fecal Sludge Management: analytical tools for assessing FSM in cities, J. Water, Sanit. Hyg. Dev., 2014, 4(3), 371–383 CrossRef.
- S. Chowdhry and D. Koné, Business Analysis of Fecal Sludge Management: Emptying and Transportation Services in Africa and Asia - Draft final report, Bill & Melinda Gates Foundation, Seattle, USA, 2012 Search PubMed.
- AECOM, SANDEC and Eawag, A Rapid Assessment of Septage Management in Asia: Policies and Practies in India, Indonesia, Malaysia, the Philippines, Sri Lanka, Thailand, and Vietnam, USAID, Bangkok, Thailand, 2010.
- L. Strande, in Faecal Sludge Management: Systems Approach for Implementation and Operation, ed. L. Strande, M. Ronteltap and D. Brdjanovic, IWA publishing, London, UK, 2014, ch. 1, pp. 1–14 Search PubMed.
- P. H. Dodane, M. Mbéguéré, O. Sow and L. Strande, Capital and operating costs of full-scale fecal sludge management and wastewater treatment systems in Dakar, Senegal, Environ. Sci. Technol., 2012, 46(7), 3705–3711 CrossRef CAS PubMed.
- A. Opel and M. K. Bashar, Inefficient technology of misperceived demand: the failure of vacutug- based pit-emptying services in Bangladesh, Waterlines, 2013, 32, 213–220 CrossRef.
- D. Koné, Making urban excreta and wastewater management contribute to cities' economic development: A paradigm shift, Water Policy, 2010, 12, 602–610 CrossRef.
- K. Eales, D. Schaub-Jones and L. Tyers, Sanitation partnerships: Harnessing their potential for urban on-site sanitation, Building Partnerships for Development (BPD) and Water and Sanitation for the Urban Poor (WSUP), London, UK, 2006 Search PubMed.
- Y. P. Thye, M. R. Templeton and M. Ali, A critical review of technologies for pit latrine emptying in developing countries, Crit. Rev. Environ. Sci. Technol., 2011, 41, 1793–1819 CrossRef.
- E. Von Münch and K. M. K. Mayumbelo, Methodology to compare costs of sanitation options for low-income peri-urban areas in Lusaka, Zambia, Water SA, 2007, 33, 593–602 Search PubMed.
- G. Hutton and L. Haller, Evaluation of the costs and benefits of water and sanitation improvements at the global level, 2004, World Health Organization, Geneva Search PubMed.
- E. Tilley, L. Ulrich, C. Lüthi, P. Reymond and C. Zurbrügg, Compendium of Sanitation Systems and Technologies, Swiss Federal Institute of Aquatic Science and Technology (Eawag), Dübendorf, Switzerland, 2014 Search PubMed.
- Government of the Republic of Zambia, National Urban Water Supply and Sanitation Programme: 2011–2030, Ministry of Local Government and Housing, Lusaka, Zambia, 2011 Search PubMed.
- TetraTech, Final Sanitation Master Plan, United States Army Corps of Engineers (USACE) and Millennium Challenge Corporation (MCC), Zambia and USA, 2011.
- UN Habitat, Zambia: Lusaka Urban Profile: Participatory slum upgrading programme in African, Carrabean and Pacific Countries, United Nations Human Settlements Programme: Regional and Technical Cooperation Division, Nairobi, Kenya, 2007.
- WSUP, FSM services in Lusaka: Moving Up the Excreta Management Ladder: Practice Note, Water & Sanitation for the Urban Poor, London, UK, 2014.
- C. K. Mwanamwambwa, H. C. Nkoloma and S. Kayaga, Linking community to policy level support: The CARE-Zambia trust model. Presented in part at 31st WEDC International Conference, Kampala, Uganda, 2005 Search PubMed.
- DSK, ed. Singha DD, Dushtha Shasthya Kendra, Dhaka, Bangledesh, 2010, DSK Activity Report, vol. 52 Search PubMed.
- S. Barr, T. Holderness, D. Alderson, C. Robson and A. Ford, ‘An open source relational database schema and system for the analysis of large scale spatial interdependent infrastructure networks, Proceedings of the 4th Open Source GIS Conference, Nottingham, UK, 2012 Search PubMed.
- R. Kennedy-Walker, T. Holderness, D. Alderson, B. Evans and S. Barr, Network modelling for road-based faecal sludge management, Proceedings of the ICE - Municipal Engineer, 2014, 167(3), 157–165 CrossRef.
- JICA, Internal Ex-Post Evaluation for Grant Aid Project, Japan International Cooperation Agency, Lusaka, Zambia, 2012.
- A. Hagberg, D. Schult and P. Swart, Exploring network structure, dynamics, and function using NetworkX, Proceedings of the 7th Python in Science Conference, Pasadena, USA, 2008 Search PubMed.
- M. Gastner and M. Newman, The spatial structure of networks, Eur. Phys. J. B, 2006, 49, 247–252 CrossRef CAS.
- NetworkX Developers, http://networkx.lanl.gov/reference/generated/networkx.algorithms.shortest_paths.weighted.dijkstra_path.html#networkx.algorithms.shortest_paths.weighted.dijkstra_path, (accessed June 2014).
- D. Whittington, W. M. Hanemann, C. Sadoff and M. Jeuland, The Challenge of Improving Water and Sanitation Services in Less Developed Countries, Now Publishers, Hanover, USA, 2008 Search PubMed.
- The World Bank, Discounted Cash Flow Analysis (DCF) and Average Incremental Cost Analysis (AIC), The World Bank, Washington, DC, 2008.
- C. Rakodi and C. R. Leduka, Informal Land Delivery Processes and Access to Land for the Poor: A Comparative Study of Six African Cities, Informal Land Delivery Processes in African Cities, International Development Department, The University of Birmingham, Birmingham, UK, 2006 Search PubMed.
- WSSCC, WASH Targets and Indicators Post 2015- Recommendations from International Consultants Comprehensive Recommendations, Updated April 2014, Water Supply and Sanitation Collabprative Council, Geneva, Switzerland, 2014 Search PubMed.
- E. von Münch, Financial aspects and market considerations - Ecosan online course, UNESCO-IHE Institute for Water Education, Delft, The Netherlands, 2008 Search PubMed.
Footnote |
| † Electronic supplementary information (ESI) available. See DOI: 10.1039/c5ew00179j |
| This journal is © The Royal Society of Chemistry 2016 |

