Acid–base dynamics in seawater reverse osmosis: experimental evaluation of a reactive transport algorithm†
Oded
Nir
 *,
Liron
Ophek
and
Ori
Lahav
Faculty of Civil and Environmental Engineering, Technion – IIT, Haifa, 32000, Israel. E-mail: odednir@campus.technion.ac.il
First published on 29th October 2015
Abstract
Acid–base properties such as pH, alkalinity and boron speciation are essential factors for the design and operation of seawater reverse osmosis desalination, as they influence critical processes such as membrane scaling, biofouling and boron permeation. However, due to the high complexity of acid–base dynamics in both the retentate and permeate streams of reverse osmosis applications, the evolution of acid–base related properties in these streams is not yet completely understood. This often leads to overly simplified models resulting in inaccurate predictions, which may impede optimal design and thus the cost-effectiveness of the process. This paper introduces a unique computerized model dedicated to modeling acid–base dynamics within seawater reverse osmosis processes based on a reactive-transport algorithm, which couples transport and equilibria phenomena. The WATRO (Weak Acid Transport in Reverse Osmosis) simulation program based on this algorithm (freely available in the ESI) is experimentally tested here and shown to extend the predictive capacity and accuracy for these important quantities beyond previous work, and also beyond the capabilities of available commercial software. Implications related to 1st and 2nd pass CaCO3 scaling and boron rejection are exemplified and discussed. From the practical standpoint, the advantages of the suggested approach are particularly prominent for 2nd RO pass modeling and design, mainly due to the passage of hydronium and hydroxide ions through the membrane.
Water impactReverse osmosis technology for seawater desalination is considered by many as the best available solution for water scarcity. Acid–base species naturally occurring in seawater have significant implications on process design; however, while the rejection of salts could be predicted with reasonable accuracy by available simulation algorithms, predicting the behavior of partially ionized acid–base species has been thus far beyond reach. Here, we describe a simulation tool specifically aimed at predicting acid–base dynamics in seawater reverse osmosis. This algorithm is shown to produce considerably improved projections of process parameters related to agricultural uses and chemical scaling, allowing for a more cost-effective process design. Fundamental understanding of pH variations and pH dependent processes during RO filtration is stimulated in this study. |
1. Introduction
Weak acid species appear in seawater at low concentrations relative to major seawater ions. Nevertheless, these species significantly affect the design and cost of most SWRO (seawater reverse osmosis) applications. The two major weak acid systems in seawater are the carbonate system (~2.3 mM) and the borate system (~0.46 mM). The carbonate system is important mainly due to CaCO3 scaling propensity, which may limit the recovery ratio and require the addition of antiscalant chemicals.1–3 The boron system is important due to the detrimental effect of this species on plants, which may limit the use of desalinated water for agriculture and urban gardening.2 Both weak acid systems comprise several species having the propensity for association or dissociation of H+ or OH−. The relative concentration of each species, including H+ and OH−, is a result of the acid–base state of equilibrium, which depends on temperature, pressure and solution composition.Each carbonate and borate species is characterized by a unique protonation state and electric charge within its own weak acid system, resulting in radically different permeation rates through RO (reverse osmosis) membranes for different carbonate- and borate-containing species.4,5 Therefore, the two main challenges in modeling the transport of weak acid species in RO are: (1) determining the feed-side concentration of these species using a suitable speciation model and (2) determining the transmembrane flux of all species using a suitable physical transport model. Simulation of practical RO applications, requiring significant permeate recovery from source water (recovery ratio), is particularly challenging, since concentrating the feed by increasing the permeate recovery invariably changes the acid–base equilibria (indicated by a change in pH) of the rejected solution.6,7
In our previous works, we introduced a coupled modeling approach which takes into account the evolution of pH throughout the passage of brine in the membrane train, by evoking an elaborate chemical speciation model at each infinitesimal permeate recovery increase.8,9 For the purpose of calibration and experimental validation of the coupled approach, a new self-consistent method for measuring pH in SWRO brines was developed.10 Furthermore, the initial model validation experiments described in that study10 revealed the influence of H+ and OH− transport on acid–base dynamics in RO. This issue was addressed in a recent study, in which a semi-analytical equation based on the diffusion–electromigration theory was derived and fitted to the experimental results.11 In the current paper, findings from our previous work are incorporated into a computer code termed WATRO (Weak Acid Transport in Reverse Osmosis), an advanced simulation program for pH, alkalinity and boron dynamics, which can be utilized for the design and operation of the 1st and 2nd RO steps typically employed in SWRO facilities. The predictive capacity of WATRO towards pH, alkalinity and boron concentration in the retentate and permeate streams is tested here by comparing the simulated predictions to the experimental pilot results obtained at realistic recovery ratios and various operating conditions.
2. Description of the simulation code
The simulation code, written in the programming language Python12 (v2.7), executes the membrane transport and mass balance equations required for the model, while the chemical speciation calculations, osmotic coefficients and solution densities are obtained from PHREEQC.13 The two programs are coupled, i.e. information is automatically exchanged between them, enabling detailed and comprehensive chemical equilibrium modeling at each iterative step. Coupling PHREEQC to Python is relatively easy thanks to the efforts made by the creators of PHREEQC in USGS to develop free modules used specifically for this purpose.14 Featuring the numeric engine and thermodynamic database of PHREEQC, these modules (also called COM objects) are operated from within the Python environment using pre-determined keywords. Typically, over a thousand calls are made to the function running the PHREEQC module during a simulation run of a full-scale SWRO process, while the runtime is typically below one minute (processor: Intel®'s i5-3317U, 1.7 GHz; 4 GB RAM). The code was written for SWRO applications; however, it is theoretically valid for the general case of multi-ionic solutions, with NaCl as the dominant salt15 and the carbonate system and borate system as the only weak acid systems apart from the water dissociation products.2.1. Permeate flux and salt concentration
As a preliminary step for the weak acid model, the code initially predicts the permeate volumetric flux (JV) and the salt concentrations in the bulk water, unstirred layer and permeate solutions. These are calculated for each numerical recovery segment, using the solution-diffusion-film model,16,17 and saved in arrays for later use. It is assumed at this stage that the concentration of the weak acid species is relatively small and thus their contribution to the osmotic pressure of the bulk solution can be neglected. Also applied is the common assumption that seawater salt permeation can be modeled via a single permeability coefficient (Ps) without significant loss of accuracy. For modeling purposes, it was assumed that Na+ and Cl− are the only major seawater ions permeating through the membrane – a reasonable assumption for SWRO. A detailed description of this sub-algorithm is shown in the ESI† (section 2). Coupling the transport simulation to PHREEQC has the added value of obtaining the osmotic coefficient for every water composition through the use of the Pitzer18–20 model embedded in the software21,22 (providing that the components are included in the thermochemical database), which enables a more accurate calculation of the osmotic pressure and thus of the permeate flux.23–25 The density of the solution is also calculated by PHREEQC, which is useful for estimating the mass transfer coefficient.22,232.2 Weak acid reactive transport
Once the water flux and the major ion composition in the bulk water, film layer and permeate are known for each numerical recovery segment, the weak acid reactive transport simulation is initiated, following the algorithm described in Fig. 1 and the transport equations shown in Table 1. As seen in Fig. 1, speciation of the bulk by the PHREEQC module is performed once for every recovery step. Subsequently, the acid–base properties of both the film layer and the permeate are determined by an iterative procedure, which converges once the acid–base equilibria in the film layer, i.e. species concentrations received from the speciation made by the PHREEQC module, are in close agreement with the equations for concentration polarization (eqn (1)), proton and species mass balance in the film layer (eqn (2)–(4)) and membrane transport (eqn (6)–(12)). The transport of boric acid, borate and bicarbonate species is described by the solution-diffusion model, while for dissolved carbon dioxide and carbonate ion, rejections of 0%4 and 100% are assumed, respectively. The transport of hydronium and hydroxide ions is described by an approximate analytical solution (eqn (10)–(13) in Table 1) for the phenomenological Nernst–Planck equation. Eqn (10), which was developed and validated in ref. 11, considers both diffusion and electromigration which were found to significantly affect the pH and alkalinity of the solutions both in the permeate10,11 and in the feed side (see the Results section). The parameter θ appearing in eqn (10) and defined in eqn (13) is a function of pH and salt concentration. For modeling purposes, an empirical correlation for θ was derived based on data from ref. 11. A description of the correlation and graphical depiction of the fitting are given in the ESI† (section 5, Fig. S5).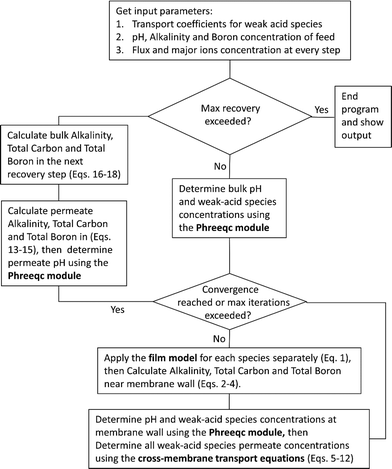 | ||
| Fig. 1 A flow diagram of the reactive transport algorithm underlying the WATRO (weak acid transport in reverse osmosis) simulation code (see the ESI†). | ||
The permeability constant for boric acid (PB), shown in eqn (5), could be either received as direct input (when it is obtained from the literature or determined from independent experiments as done in this work) or estimated based on the manufacturer's published boron rejection performance. The permeability constants for the borate and bicarbonate monovalent ions within the solution-diffusion mechanism were assumed to be equal to the overall salt permeability (Ps). It is noted that electromigration, which is neglected here for these species, also contributes to their transmembrane fluxes; however, for RO, this simplifying assumption is expected to have a negligible effect on the total alkalinity, boron and inorganic carbon fluxes which are (when occurring at significant magnitudes) dominated by H+/OH−, B(OH)3 and CO2, respectively. For charged weak acid species, the mass transfer coefficient (kj) appearing in eqn (1) is assumed to be identical to the average mass transfer coefficient of salt, which can either be provided by the user or estimated by the program (see section 3 of the ESI† for further information). The mass transfer coefficient of the uncharged B(OH)3kB is also provided by the user or estimated to be twice the magnitude of ks (see section 4.1 for explanation).
After all individual species permeate concentrations are determined, the permeate alkalinity, total boron and total inorganic carbon concentrations are computed (eqn (15) and (16)). This enables the calculation of both the permeate pH (by the PHREEQC module) and the bulk alkalinity, as well as the total boron and total inorganic carbon concentrations in the next recovery step (eqn (17)–(19)). The algorithm continues to run until the desired recovery is reached. The pH, alkalinity and boron concentrations in the retentate and permeate streams are recorded for every recovery step, thus the evolution of these acid–base related quantities throughout the desalination can be evaluated and compared to experimental results.
3. Experimental
The RO experiments were carried out using a membrane filtration pilot-scale unit, supporting one 4 × 40′′ membrane module (diameter = 4′′, length = 40′′). A schematic description of the experimental setup is given in Fig. S1 in the ESI.† In all the filtration experiments, feed water was pumped from the feed tank to a high-pressure positive-displacement pump (Hydra-Cell, D/G-10-X), using a centrifugal booster pump (Pedrolo, 2-4CR). The pressurized feed water flowed through the membrane element placed inside a pressure vessel (Bell, ORL4-E-1000), resulting in brine and permeate streams. The working pressure was controlled by a valve at the brine outlet, while the feed flow rate (cross-flow velocity) was independently adjusted using a frequency converter. Both pressure and cross-flow velocity were continuously recorded by digital meters connected to a computer and the values reported here are the averages of the feed and brine streams over 3–5 minutes. The permeate flow rate was measured volumetrically. The brine temperature was maintained at 25 ± 1 °C by a titanium plate heat exchanger and a chiller (capacity: 9000 kcal h−1).The experiments for determining the transport constants (Table 2) were conducted at low recovery (i.e. at full recirculation mode when both brine and permeate streams are circulated back to the feed tank) and low pH (6.2–6.5), where >99% of the dissolved boron is in the form of B(OH)3. The feed was real Mediterranean seawater in the cases where seawater membranes were used and simulated 2nd pass feed water (i.e. 1st pass permeate) when brackish RO membranes were applied. The feed water ionic compositions for these experiments can be found in the ESI.† The transmembrane pressure, flux, salt and total boron concentration were recorded and analyzed as described in the ESI.†
| Membrane | pH | Cl− | Na+ | Mg2+ | SO42− | K+ | Ca2+ | Alkalinity | B T |
|---|---|---|---|---|---|---|---|---|---|
| SWC6 | 9.35 | 20![[thin space (1/6-em)]](https://www.rsc.org/images/entities/char_2009.gif) 106 106 |
11![[thin space (1/6-em)]](https://www.rsc.org/images/entities/char_2009.gif) 432 432 |
1285 | 3248 | 433 | 412 | 36.8 | 4.22 |
| SW30HRLE | 8.59 | 14![[thin space (1/6-em)]](https://www.rsc.org/images/entities/char_2009.gif) 872 872 |
8610 | 934 | 2744 | 311 | 344.5 | 154.8 | 3.62 |
| SW30HRLE | 8.24 | 16![[thin space (1/6-em)]](https://www.rsc.org/images/entities/char_2009.gif) 580.143 580.143 |
9573 | 1044 | 3071 | 367 | 397 | 120 | 3.670 |
| ESPA2 | 9.62 | 447.7 | 292 | 3.33 | 16.5 | — | — | 12.66 | 2.16 |
The model evaluation experiments were conducted at high recovery ratios. The permeate was collected in a different tank until the desired recovery was achieved. Once the desired recovery was attained, the permeate was directed back to the feed tank and allowed to stabilize for 20 minutes before measurements were taken (pressure, flux, pH, temperature) and samples were collected. The samples were taken from all streams at selected recovery points and were measured for pH (the method described in ref. 10 was used for concentrated solutions), alkalinity (using the Gran titration method), boron and major ion concentrations (ICP-AES).The feed compositions for the validation experiments are provided in Table 2.
4. Results and discussion
4.1. Transport parameters
Prior to the model evaluation experiments, the transport constants required by the solution-diffusion-film model were determined via separate filtration experiments for each membrane element used in this work. The permeate flux and solute concentration data (Table S1 in the ESI†) were recorded for varying transmembrane pressures and used to calculate the mass transfer coefficients (k) and the permeability coefficients (P) for boric acid and for the dissolved salt (a single set of coefficients, k and P, was used as an overall effective average for all charged solutes). For boric acid, the transport constants were determined by non-linear optimization, while for the salt, linear regressions were used, following the logic of the osmotic pressure method.26 Detailed information on the calculation of the coefficients is found in the ESI† (section 3).The transport constants shown in Table 3 correspond to the solution-diffusion-film model. It is generally accepted that this model provides a good approximation for salt transport in RO.17 Regarding boric acid, however, several recent publications27,28 used the Spiegler–Kedem film model (see eqn S10 in the ESI†) which couples boric acid permeation to that of water (often viewed as convection). The coupling is expressed by the parameter σ which ranges from 0 (in the case of fully coupled flow) to 1 (in the case of no coupling). In this work, however, when the transport constants were fitted to the results according to the Spiegler–Kedem film model, the optimization yielded σB(OH)3 values which were very close to unity (>0.999), as assumed in the solution-diffusion-film model, while the other model parameters, PB(OH)3 and kB(OH)3 were very similar for both models, suggesting that boric acid transport can be fully explained by the solution-diffusion-film mechanism. This observation is in accord with recent theoretical and empirical evidence which supports the premise of negligible convection for today's extremely thin RO membranes.11,29 The salt permeability (Psalt) was smaller by ~2 orders of magnitude than the boric acid permeability (PB(OH)3) for all the membranes used. As expected, the water permeability was the highest for the ESPA2 brackish water membrane, followed by the SWC6 high-flux seawater membrane, and the lowest for the SW30HRLE seawater membrane. The latter membrane was two years old and deteriorated as a result of demanding lab use, which may explain its higher permeabilities for salt and boric acid, compared to the new SWC6 element.
| P w (m s−1 bar−1) | P salt (m s−1) | k salt (m s−1) | P B(OH)3 (m s−1) | k B(OH)3 (m s−1) | |
|---|---|---|---|---|---|
| a Assumed value due to experimentally insignificant concentration polarization for boric acid (see the text for further explanation). | |||||
| SW30HRLE | 4.89 × 10⁻⁷ | 2.90 × 10⁻⁸ | 1.05 × 10⁻⁵ | 2.06 × 10⁻⁶ | 2.57 × 10⁻⁵ |
| SWC6 | 5.79 × 10⁻⁷ | 1.94 × 10⁻⁸ | 2.32 × 10⁻⁵ | 1.88 × 10⁻⁶ | 1.00 × 10⁻³a |
| ESPA2 | 1.27 × 10⁻⁶ | 9.40 × 10⁻⁸ | 9.40 × 10⁻⁶ | 2.78 × 10⁻⁵ | 1.62 × 10⁻⁵ |
Surprisingly, the mass transfer coefficient obtained for the salt was significantly smaller than the one found for boric acid (kB(OH)3), despite the fact that the diffusion coefficient in water found in the literature is lower for the latter. This implies a higher tendency of charged solutes towards concentration polarization, which may be explained by the electrostatic interactions of ions with the charged membrane surface or with the fouling layer, by ion–ion interactions, or by any combination of the three. Although beyond the scope of this work, this finding calls for further research, aimed at understanding the role of electrostatic interactions in concentration polarization occurring during RO filtration. The kB(OH)3 for the SWC6 membrane converged to a very large number, suggesting negligible concentration polarization for boric acid. Since kB(OH)3 could not be accurately determined by the non-linear fitting method in this case, the value shown in Table 3, which is sufficiently large for making concentration polarization practically insignificant, was used as input for the relevant model run.
4.2. Model evaluation and dominant processes affecting pH, alkalinity and boron permeation
The RO filtration experiments were conducted and compared to model prediction. The operating conditions closely simulated the decrease in permeate flux and the increase in retentate concentration, as encountered in actual SWRO applications. Real seawater or synthetic 1st pass permeate (2nd pass feed) was used as feed water in these experiments. The measured water flux and salt concentration values were reasonably well predicted by the WATRO program for all experiments (see Fig. S4 in the ESI†), with errors typically below 10%. This is critical for the purpose of model evaluation since water flux and salt concentration affect the pH, alkalinity and boric acid values.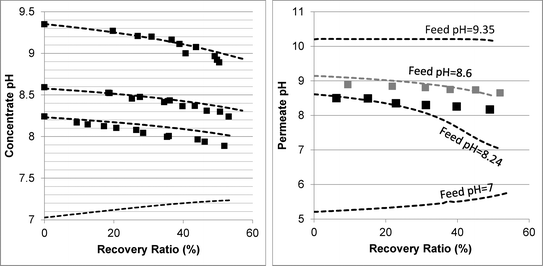 | ||
| Fig. 2 Evolution of concentrate (left graph) and permeate (right graph) pH as a function of the recovery ratio. The square markers represent the experimental results. The dashed lines are the model predictions. The membranes used were Dow's SW30HRLE (for feed pH 8.24 and 8.6) and Hydranautic's SWC6 (for feed pH 9.35). | ||
In order to understand the evolution of pH, alkalinity and boron values within high recovery RO, transport-equilibria processes affecting acid–base dynamics need to be known. These could be classified into processes which increase the concentrate pH and processes which decrease it. pH increase could be induced by permeation of weak acids (i.e. CO2 and B(OH)3 in the case of seawater) and of H+ ions. pH decrease is the result of weak base (HCO3− and B(OH)4−) and OH− permeation (which may be coupled to reverse flux of H+ ions11) and the increase of salt concentration and ionic strength, which reduces the activity of the negatively charged weak bases. By examining the experimental results and by using the model, the dominant transport-equilibria process for every process scenario can be revealed. The decline of retentate pH with recovery at feed pH >8 indicates that pH-increasing processes are overwhelmed by pH-decreasing processes.
Determining which pH-changing process is dominant can be deduced from the measured and modeled alkalinity values shown in Fig. 3. At feed pH 8.24 and 8.6, the alkalinity concentration was doubled at 50% recovery, implying that species having a positive contribution to alkalinity (for an alkalinity equation defined with reference species H2CO3˙ and B(OH)3) were almost fully rejected. Correspondingly, the permeate alkalinity measured and modeled for these experiments was almost two orders of magnitude lower than that of the retentate. Among the pH-decreasing processes, the increased ionic strength in the retentate is the only one which does not involve alkalinity transfer from the retentate to the permeate; therefore, it is most likely the main reason for pH decrease in this case. In contrast, for feed pH 9.35, the permeate alkalinity was higher even though the feed alkalinity was lower due to the decarbonation pretreatment, suggesting that H+/OH− permeation dominantly affects the retentate pH in this case. This is on a par with the high permeate pH predicted for feed pH 9.35 (see Fig. 2), which is the result of H+/OH− electromigration.
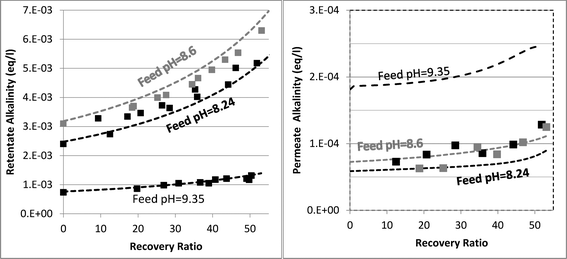 | ||
| Fig. 3 Evolution of retentate (left hand graph) and permeate (right hand graph) alkalinity as a function of recovery ratio. The square markers are the experimental results. The dashed lines are the model predictions. | ||
The mechanisms underlying pH evolution for each case were further inspected by using a modified version of WATRO in which the function adjusting for H+/OH− transport is switched off. When this is performed for the case of feed pH 9.35, the predicted pH of the retentate at 50% recovery becomes pH 9.25, which is higher than the pH 9 value predicted by the fully functional model (and also measured), while the predicted permeate pH was lower (pH 7.5–8 compared to pH 10–10.2). Accordingly, the predicted permeate alkalinity was two orders of magnitude lower, while the retentate alkalinity at 50% recovery was doubled. Applying the same procedure for the case of feed pH 8.24 yielded a predicted pH value of 8.07 at 50% recovery, only slightly higher than the value predicted by the fully functional WATRO (8.03), while the permeate pH in this case dropped to 6.2–6.5 (compared to 8.1–8.6). Accordingly, the alkalinity of the retentate was almost unchanged while the permeate alkalinity dropped by ~50 μeq l−1. These results suggest that for the case of high feed pH and low alkalinity, OH−/H+ electromigration is the dominant mechanism driving pH evolution in both the retentate (although the increase of salt concentration also plays a significant role for the retentate) and the permeate. For the case of seawater feed at ambient pH and alkalinity, pH evolution in the retentate is almost exclusively controlled by the salt concentration, while the pH of the permeate is determined mostly by OH−/H+ electromigration.
As seen in Fig. 4, the model accurately predicted the boron permeate concentrations at a 50% recovery ratio for the three feed pH values and two membranes applied in the experiments (permeate boron concentrations were well predicted for most of the recovery range as shown in Fig. S6 in the ESI†). For the purpose of quantifying the effect of acid–base dynamics and pH evolution on boron permeation in the 1st SWRO step, a modified version of WATRO in which the concentrate pH remained unchanged in the retentate stream from the feed to the final concentrate was used. This assumption is evidently untrue,10 nevertheless it is applied in most full-scale boron transport models published in the scientific literature.34–36
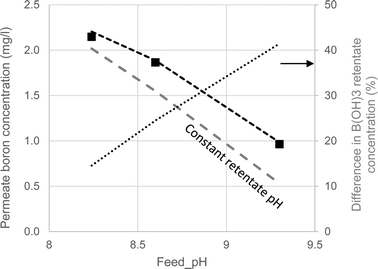 | ||
| Fig. 4 Boron permeate concentrations at 50% recovery at varying feed pH. The symbols represent the experimental results. The dashed lines are the model projections made by the fully functional WATRO (black) and the modified version in which the retentate pH is constant (grey). The dotted line shows the relative difference in B(OH)3 concentrations projected by the two models. | ||
Examining the comparison between the two versions of the model presented in Fig. 4, it can be seen that the predictions made by the modified constant pH model are similar to those made by the fully-functional model at feed pH 8.24. However, as the pH increases, predictions for the constant pH assumption significantly differ from the fully-functional model and the experimental results. The reason for this effect, also depicted in Fig. 4, is the increasing difference in the projections of the B(OH)3 retentate concentration at 50% recovery made by the two versions of WATRO. Although the decline in pH is similar for feed pH 8.24–9.35 (see Fig. 2), the underestimation of the (poorly rejected) B(OH)3 concentration by the constant pH assumption is more apparent when the pH is high and the B(OH)3 concentration is low. Therefore, although SWRO boron-transport models which assume constant pH may produce reasonable predictions at feed pH < 8.3, they are unreliable at higher feed pH. It is therefore recommended that a more generic model, as the one suggested here, be used to explore the interesting prospect of operating the 1st SWRO pass at high pH.30,37
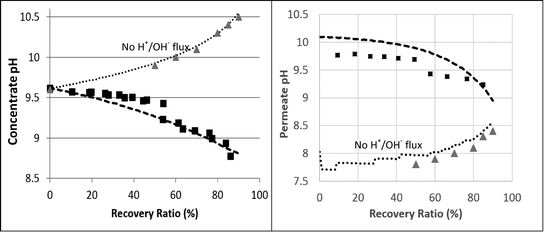 | ||
| Fig. 5 2nd pass SWRO retentate (left hand) and permeate (right hand) pH as a function of recovery ratio. The squares represent the experimental results. The dashed lines are the projections made by the fully functional WATRO model. The dotted lines are the simulation results made by the modified version of WATRO with no H+/OH− flux. The triangle markers are the projections made by the membrane manufacturer's process design software. | ||
The predicted and measured boron concentrations in the 2nd pass permeate are shown in Fig. 6. The results suggest that modeling the pH evolution correctly dramatically improves the accuracy of the model predictions for the boron concentration in the 2nd pass permeate. While the fully functional model accurately predicted the boron permeate concentrations, the simulation run without H+/OH− flux significantly underestimated the boron permeate concentrations, especially at high recovery ratios. This underestimation, which was in agreement with the manufacturer's software, is a result of the over predicted retentate pH leading to an underestimated B(OH)3 retentate concentration. The claim that the manufacturer's software failed due to incorrect treatment of acid–base dynamics at high feed pH is supported by the simulated results at feed pH 7, where changes in the retentate pH (by as much as 1 pH unit, which is normally not expected) do not significantly affect boron speciation. The good agreement between the WATRO code and the manufacturer's design software suggests that B(OH)3 permeability and transport are treated similarly; however, WATRO is more general and may be used for a high feed pH, which is the common practice in the 2nd pass. These results demonstrate the practical significance of the suggested approach towards simulating 2nd pass results, which is often aimed mainly at boron removal.
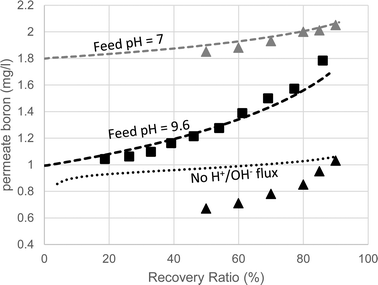 | ||
| Fig. 6 Boron permeate concentrations of the 2nd SWRO pass (feed pH = 9.6) as a function of recovery ratio. The squares are the experimental results. The triangles are the values predicted by the manufacturer's software for feed pH 9.6 (black) and 7 (grey). The dashed lines are the projections made by the fully-functional WATRO model at feed pH 9.6 (black) and 7 (grey). The dotted line represents the simulation results made by the modified version of WATRO with no H+/OH− flux. | ||
4.3. Implications on potential membrane scaling
The improved descriptions of the retentate pH have significant implications for the assessment of membrane scaling potential by minerals whose saturation state and precipitation potentials depend on pH. Table 4 shows the effect of the projected brine pH on the scaling tendency of the most “problematic” minerals. When the pH of seawater brines was assumed to be equal to that of the feed (constant pH assumption), the saturation indices and precipitation potentials were significantly higher compared to the more realistic lower pH prediction made by WATRO. Consequently, the induction time for nucleation is expected to be longer while crystal growth is expected at a lower rate. For the case of the 2nd pass brine (feed pH = 9.6), due to the higher pH projected by the manufacturer's software (pH 10.5) compared to the much lower pH (pH 8.77) projected by WATRO (closely matching the experimental results), the calculated saturation state shifted from supersaturation to undersaturation (for brucite) or close to saturation (for calcite). These results imply that the use of antiscalants can be considerably reduced and even abandoned in certain cases, which is already practiced in many SWRO facilities; however, a sound mechanistic explanation has not been suggested until now.| Feed pH | Brine pH | C T (mmol kgH2O−1) | Alkalinity (meq kgH2O−1) | SI | PP (mgCaCO3 l−1) |
|---|---|---|---|---|---|
| 1st pass 50% recovery | Aragonite | Aragonite | |||
| 8.15 | 8.15 (constant pH) | 4.6 | 5.34 | 1.03 | 86.2 |
| 8.15 | 7.95 (WATRO prediction) | 4.6 | 5.07 | 0.85 | 62.3 |
| 8.6 | 8.6 (constant pH) | 4.6 | 6.27 | 1.38 | 170.5 |
| 8.6 | 8.37 (WATRO prediction) | 4.6 | 5.73 | 1.21 | 121.8 |
| 2nd pass 85% recovery | Calcite/brucite | Calcite/brucite | |||
| 9.6 | 10.5 (manufacturer's software) | 1.13 | 1.94 | 1.03/0.65 | 29.2/18.8 |
| 9.6 | 8.77 (WATRO prediction) | 1.13 | 1.23 | 0.01/−2.77 | 0.1/−42.0 |
5. Conclusions
Overall, the model evaluation results demonstrate the applicability of the WATRO program for predicting pH, alkalinity and boron permeation in SWRO for a range of feed pH values, different membranes and distinct feed compositions and pressure (1st pass versus 2nd pass). It was shown that pH variations in the retentate of the 1st SWRO pass operating at feed pH >8 are governed by the increase in salt concentration, while the permeate pH is mainly determined by the passage of hydronium and hydroxide ions through the membrane. The latter phenomenon was found to have a dramatic effect on both the permeate and retentate pH in the 2nd pass, which explained the large discrepancies between the measured results and the projection made by the manufacturer's software. The mass transfer coefficient for boric acid was found to be significantly higher than that of the background salt, despite having similar diffusion coefficients. This observation calls for additional work focusing on the effect of solute charge on concentration polarization. Applying this modeling approach for SWRO could enable optimized boron removal while avoiding chemical scaling, thus resulting in a more cost-effective desalination process.Acknowledgements
This project was funded by the Israel Science Foundation (#163/14).References
- P. Schausberger, G. M. Mustafa, G. Leslie and A. Friedl, Desalination, 2009, 244, 31–47 CrossRef CAS.
- O. Nir, M. Herzberg, A. Sweity, L. Birnhack and O. Lahav, Chem. Eng. J., 2012, 187, 275–282 CrossRef CAS.
- A. Antony, J. H. Low, S. Gray, A. E. Childress, P. Le-Clech and G. Leslie, J. Membr. Sci., 2011, 383, 1–16 CrossRef CAS.
- C. E. Milstead, A. B. Riedinger and H. K. Lonsdale, Desalination, 1971, 9, 217–223 CrossRef CAS.
- K. L. Tu, L. D. Nghiem and A. R. Chivas, Sep. Purif. Technol., 2010, 75, 87–101 CrossRef CAS.
- J.-J. Qin, M. H. Oo and B. Coniglio, Desalination, 2005, 177, 267–272 CrossRef CAS.
- T. Waly, M. D. Kennedy, G.-J. Witkamp, G. Amy and J. C. Schippers, Desalination, 2011, 280, 27–32 CrossRef CAS.
- O. Nir and O. Lahav, Desalination, 2013, 310, 87–92 CrossRef CAS.
- O. Nir and O. Lahav, Desalination, 2014, 343, 147–153 CrossRef CAS.
- O. Nir, E. Marvin and O. Lahav, Water Res., 2014, 64, 187–195 CrossRef CAS PubMed.
- O. Nir, N. F. Bishop, O. Lahav and V. Freger, Water Res., 2015, 87, 328–335 CrossRef CAS PubMed.
- X. Cai, H. P. Langtangen and H. Moe, Sci. Program., 2005, 13, 31–56 Search PubMed.
- D. L. Parkhurst and C. A. J. Appelo, Description of input and examples for PHREEQC version 3–A computer program for speciation, batch-reaction, one-dimensional transport, and inverse geochemical calculations, U.S. Geological Survey Techniques and Methods, book 6, ch. A43, 2013, http://pubs.usgs.gov/tm/06/a43/ Search PubMed.
- S. R. Charlton and D. L. Parkhurst, Comput. Geosci., 2011, 37, 1653–1663 CrossRef CAS.
- A. Yaroshchuk, X. Martínez-Lladó, L. Llenas, M. Rovira and J. de Pablo, J. Membr. Sci., 2011, 368, 192–201 CrossRef CAS.
- J. G. Wijmans and R. W. Baker, J. Membr. Sci., 1995, 107, 1–21 CrossRef CAS.
- J. Wang, D. S. Dlamini, A. K. Mishra, M. T. M. Pendergast, M. C. Y. Wong, B. B. Mamba, V. Freger, A. R. D. Verliefde and E. M. V. Hoek, J. Membr. Sci., 2014, 454, 516–537 CrossRef CAS.
- K. S. Pitzer, J. Phys. Chem., 1973, 77, 268–277 CrossRef CAS.
- C. E. Harvie and J. H. Weare, Geochim. Cosmochim. Acta, 1980, 44, 981–997 CrossRef CAS.
- C. E. Harvie, N. Møller and J. H. Weare, Geochim. Cosmochim. Acta, 1984, 48, 723–751 CrossRef CAS.
- L. N. Plummer, D. L. Parkhurst, G. W. Flemming and S. A. Dunkle, A computer program incorporating Pitzer's equations for calculation of geochemical reactions in brines, 1988, vol. 88–4153 Search PubMed.
- C. A. J. Appelo, Appl. Geochem., 2015, 55, 62–71 CrossRef CAS.
- M. Azaroual, C. Kervévan, M. N. Durance and P. Durst, Desalin. Strateg. South Mediterr. Ctries., 2004, 165, 409–419 CAS.
- K. H. Mistry, H. A. Hunter and J. H. Lienhard V, Desalination, 2013, 318, 34–47 CrossRef CAS.
- H. Qian, Z. Zhou, L. Zhang, F. Wu, Q. Zhang and Z. Zhang, Desalination, 2013, 320, 73–79 CrossRef CAS.
- T. H. Chong, F. S. Wong and A. G. Fane, J. Membr. Sci., 2007, 287, 198–210 CrossRef CAS.
- M. Fernanda Chillón Arias, L. V. I. Bru, D. P. Rico and P. V. Galvañ, J. Membr. Sci., 2011, 368, 86–94 CrossRef.
- P. P. Mane, P.-K. Park, H. Hyung, J. C. Brown and J.-H. Kim, J. Membr. Sci., 2009, 338, 119–127 CrossRef CAS.
- S. Bason and V. Freger, J. Membr. Sci., 2010, 360, 389–396 CrossRef CAS.
- L. Ophek, L. Birnhack, O. Nir, E. Binshtein and O. Lahav, Water Res., 2015, 85, 185–192 CrossRef CAS PubMed.
- B. Andrews, B. Davé, P. López-Serrano, S.-P.-P. Tsai, R. Frank, M. Wilf and E. Koutsakos, Desalination, 2008, 220, 295–304 CrossRef CAS.
- E. Mitsoyannis and G. D. Saravacos, Desalination, 1977, 21, 235–240 CrossRef CAS.
- S. Oren, L. Birnhack, O. Lehmann and O. Lahav, Sep. Purif. Technol., 2012, 89, 252–260 CrossRef CAS.
- P.-K. Park, S. Lee, J.-S. Cho and J.-H. Kim, Water Res., 2012, 46, 3796–3804 CrossRef CAS PubMed.
- K. M. Sassi and I. M. Mujtaba, J. Membr. Sci., 2013, 440, 29–39 CrossRef CAS.
- S. Y. Alnouri and P. Linke, Desalination, 2014, 345, 112–127 CrossRef CAS.
- O. Nir and O. Lahav, in Boron Separation Processes, ed. N. K. B. Hilal, Elsevier, Amsterdam, 2015, pp. 297–323 Search PubMed.
- J. W. Morse, Q. Wang and M. Y. Tsio, Geology, 1997, 25, 85–87 CrossRef CAS.
- W. Sun, S. Jayaraman, W. Chen, K. A. Persson and G. Ceder, Proc. Natl. Acad. Sci. U. S. A., 2015, 112, 3199–3204 CrossRef CAS PubMed.
Footnote |
| † Electronic supplementary information (ESI) available. See DOI: 10.1039/c5ew00228a |
| This journal is © The Royal Society of Chemistry 2016 |


