A liter-scale microbial capacitive deionization system for the treatment of shale gas wastewater†
Casey
Forrestal
a,
Alexander
Haeger
a,
Louis
Dankovich IV
a,
Tzahi Y.
Cath
b and
Zhiyong Jason
Ren
*a
aDepartment of Civil, Environmental, and Architectural Engineering, University of Colorado Boulder, Boulder, CO 80309, USA. E-mail: zhiyong.ren@colorado.edu; Fax: (303) 492 7317; Tel: (303) 492 4137
bDepartment of Civil and Environmental Engineering, Colorado School of Mines, Golden, CO 80401, USA
First published on 14th January 2016
Abstract
Sustainable wastewater management is among the biggest challenges in shale oil and gas exploration and production. Here we present the first prototype microbial capacitive deionization (MCD) system for both organic carbon and total dissolved solids (TDS) removal from wastewater with simultaneous electricity production. The 2.2 liter spiral wound reactor was operated continuously for nearly 2 years using actual flow back and produced water, and it was equipped with 11 electrical sensors for real time water quality monitoring. The system was capable of generating 89–131 W m−3 power while removing up to 10.2 g TDS L−1 per day and 75% of the chemical oxygen demand (COD). Additionally, the influence of electrical potential applied to a capacitive deionization assembly on microbial electron transfer was characterized for the first time. The MCD system is inexpensive to operate ($0.10 per barrel) with an additional advantage of extra water production due to the use of sodium percarbonate as an electron acceptor. The MCD technology presents a new process for water and energy positive produced water treatment.
Water impactThe billions of gallons of wastewater generated every year in the shale oil and gas industry pose great environmental, safety, and economic challenges. Onsite treatment and reuse technologies are desperately needed to reduce such impacts but the costs have been high. The microbial capacitive deionization system shows a unique feature of simultaneous removal of both organics and salts with positive energy and water production, and reactor scaleup is needed to demonstrate system scalability. |
1. Introduction
The development of unconventional shale oil and gas plays in North America and around the world has had dramatic impacts on economic growth, environmental stewardship, and social consciousness. In the United States wastewater generated from oil and gas exploration and production has been estimated to exceed 21 billion barrels (one barrel equals 42 gallons or 159 liters) and is generally referred to as produced or flowback water.1 Wastewater generated during the first couple of months is commonly referred to as flowback water, while water generated over the wells lifespan is more commonly called produced water. The wastewater generated is highly variable in the concentration of oils, suspended solids, dissolved solids and dissolved organic matter depending upon the age of the well and the geological formation. Total dissolved solid (TDS) concentration can be orders of magnitudes in difference, ranging from 1 g L−1 to 400 g L−1, and dissolved organic carbon (DOC) can range from 10 mg L−1 to 4000 mg L−1.2,3 This makes treating this waste stream costly and difficult, leading to over 90% of the wastewater being injected into class II injection wells.1 However, this practice of deep well injection has been linked to seismic activity and leads to a permanent loss of the water from the hydrologic cycle.4 Additionally, in arid places like the western United States acquisition of water can be a serious problem for the industry. To address the water challenges numerous technologies have been developed, tested, and implemented,5 including new processes like forward osmosis membranes, ozonation, electrocoagulation and low temperature distillation.5–9 However, no technology has been dominant in the industry because none can remove all pollutants at an economically attractive cost over deep well injection.One variable that drives up the cost of the treatment is energy for treatment and transportation.10 Current processes for wastewater treatment are very energy intensive, and that is why a recent technology called microbial capacitive deionization (or desalination as known previously) (MCD) showed good potential.8,10 A typical MCD reactor has three chambers. When microorganisms in the anode chamber oxidize hydrocarbons and other organic substrates during anaerobic respiration, they deliver electrons to the anode electrode. The electrons (i.e. current) flow through an external circuit to specially designed membrane assemblies in the middle chamber and finally combined with protons in the cathode chamber to generate water. The electrical potential generated between the anode and cathode drives charged ion removal through physical and electrochemical adsorption in a middle chamber.11 The ion transfer diagrams in different MCD configurations can be found in Ma et al.19 Lab studies showed that without consuming external energy, more than 85% of organic hydrocarbons and 66% of TDS could be removed in 4 hours and a small amount of electricity could be generated simultaneously.12–14 In this study, we present the first liter-scale microbial capacitive deionization system with automation control, which is different from previous lab configurations and incorporated multiple new advancements to provide modular, mobile, and flexible solutions for oil and gas wastewater treatment. First, the larger system has a spiral wound configuration, which is a commonly used configuration in the water industry.15,16 It allows for high surface area to volume ratios, low internal resistances and therefore demonstrates higher performance. Second, the replacement of widely used but troubled air-cathode to new activated carbon cloth and sodium percarbonate.17 This overcomes the leaking and fouling problems associated with air-cathode and allows larger scale reactor development.18 We also modified membrane configurations within the MCD system to allow for simultaneous desalination of all chambers and increase total salt removal capacity.19 Last but not least, for the first time we incorporated automatic monitoring and control system for the reactor and tested different operational conditions to maximize system performance. This is the first time such control systems being used in pilot bioelectrochemical reactors.
2. Materials and methods
2.1. Flowback and produced water quality
Produced water was collected from a wastewater treatment plant treating shale gas produced water in Piceance Basin, Colorado. Two flowback water samples were collected from a site having just practiced hydraulic fracturing in the Denver Julesburg basin. Sample flowback #1 was collected 2 weeks after fracturing, and flowback #2 was collected 1 month after. The raw produced water was pretreated at the WWTP with initial solids separation and oil removal followed by further solid removal by hydrocyclones and oil–water separation. No pre-treatment was conducted with the flowback water samples #1–2. The TDS concentration of the produced water was 15![[thin space (1/6-em)]](https://www.rsc.org/images/entities/char_2009.gif) 870 ± 290 mg L−1 and the COD concentration of 1100 mg L−1. Flowback water #1 had a TDS concentration of 18
870 ± 290 mg L−1 and the COD concentration of 1100 mg L−1. Flowback water #1 had a TDS concentration of 18![[thin space (1/6-em)]](https://www.rsc.org/images/entities/char_2009.gif) 000 mg L−1 and COD of 2560 mg L−1. Flowback water #2 had a TDS concentration of 21
000 mg L−1 and COD of 2560 mg L−1. Flowback water #2 had a TDS concentration of 21![[thin space (1/6-em)]](https://www.rsc.org/images/entities/char_2009.gif) 000 mg L−1 and COD of 7580 mg L−1.
000 mg L−1 and COD of 7580 mg L−1.
2.2. System configuration and construction
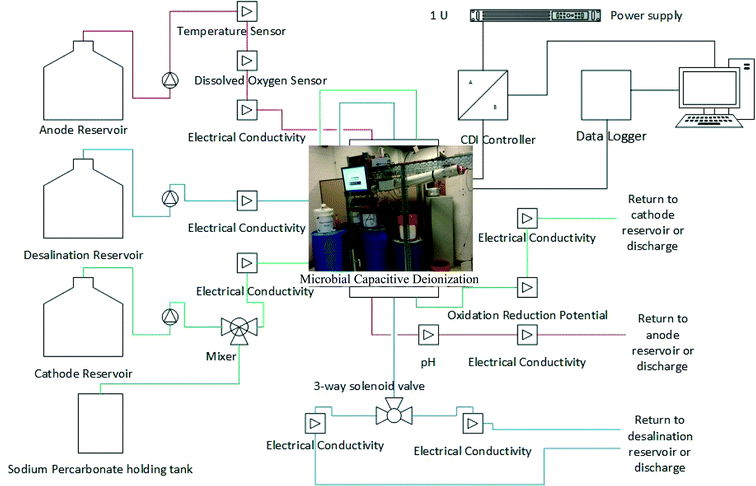
The scaled MCD used was based off previous analysis done on reactor configuration and construction.11,15,19,20 The reactors were constructed in a spiral wound, consisting of a cation exchange membrane (CEM) and an anion exchange membrane (AEM) (Membranes International, NJ), and a capacitive deionization module.20 The anode and cathode electrodes consisted of two pieces of activated carbon cloth (ACC) (Chemviron Carbon, UK) placed on both sides of a stainless steel mesh current collector. A neoprene rubber was used as a barrier for fluid flow inside the anode and cathode chambers. On both ends of the manifold a 1/8 inch national pipe thread tapped adapter was used to make hydraulic connections for influent and effluent flows to the anode, and two pieces of nylon mesh were used as flow channels inside the anode and cathode chambers. The nylon mesh, current collector and ACC were cut into a U shape so that the center neoprene spacer could form a seal with the CEM membrane. The edges of the anode and cathode chambers were sealed with a 1 inch neoprene rubber and glue along the outside edges of the membranes.21 The middle chamber CDI module consisted of two pieces of stainless steel mesh, 4 pieces of ACC and 8 pieces of nylon mesh. Electrical connections were made with a copper wire solder to the stainless steel mesh. The spiral wound layers were constructed using a winding machine with edges sealed by marine glue, and then the module was inserted into a 4 inch × 48 inch PVC pipe. Same sized membranes, electrodes, and spacers were wounded during manufacturing process, and the projected surface area of each material was 44 inch × 28 inch (112 cm × 71 cm). The anode and cathode chambers had a volume of 0.6 L while the desalination chamber formed by the PVC pipe has a volume of 1 L, making a total volume of 2.2 L.The automatic control system for MCD consisted of a computer, a peristaltic pump, two 3-way solenoids, an Arduino Uno microcontroller, and 11 different sensors (Fig. 1). Seven electrical conductivity circuits were used to monitor the influent and effluent salt concentration for each of the three chambers. A pH probe was attached to the effluent of the anode chamber and a dissolved oxygen (DO) probe was connected to the influent of the anode chamber. A temperature probe was placed inside the anode storage reservoir and an oxidation reduction potential sensor (ORP) was connected to the effluent of the cathode chamber. Customized LabView (National Instruments, TX) program was used to control the system.
2.3. System acclimation and operation
The MCD reactor was acclimated with sodium acetate and activated sludge at the beginning till a stable voltage (>600 mV @ 1000 ohms) was obtained before transitioning to 100% produced/flowback water. The initial anolyte contained per liter: 1.6 g NaCH3COO, 0.62 g NH4Cl, 4.9 g NaH2PO4–H2O, 9.2 g Na2HPO4, 0.3 g KCL, and 10 ml trace metals and 10 ml vitamin solution.22 The initial catholyte solution consisted of sodium percarbonate solution (5 g L−1 2Na2CO3–3H2O2, 4.9 g NaH2PO4–H2O, 9.2 g Na2HPO4).17 A 10 g L−1 NaCl salt solution was used in the desalination chamber during acclimation. Following acclimation the anode chamber influent was slowly transitioned by increasing the percentage of produced water over 6 weeks, so the microbes could adapt to the high salt content. In the meantime, the cathode and desalination chamber were directly transitioned to produced water. After acclimation, all three chambers were fed with 100% raw oil and gas wastewater, except that the catholyte contained 4 g L−1 sodium percarbonate, which was mixed in a buffering reservoir before entering to the cathode chamber.The prototype system was operated to investigate the efficacy of a scaled MCD reactor on electricity generation, salt and organic removal. The reactor was operated in continuous flow mode with a flow rate of 280 mL per minute for each chamber. Initially 2 reactors were constructed and installed into a movable cage system, so the voltage generated from one reactor can be used to charge another unit. However during operation, one reactor showed significant leakage and could not be repaired, so an external voltage of 1.2 V was applied to the remaining CDI module with electrical current varying from 0.05 A to 0.5 A to simulate alternative desalination (with voltage) and regeneration operations (without voltage) between 2 units. Desalination and regeneration time were set to be equivalent at 5 minute intervals. Such operation allowed for the investigation of the influence of electrical potential on microbial electrical current generation. For some experiments a positive potential was applied to the CDI electrode next to the anode chamber and a negative potential applied to the electrode next to the cathode, while during other experiments this potential was switched.
2.4. Analytical procedures
Voltage for the reactors and the applied potential to the CDI modules were monitored by a data logger. Temperature, conductivity, DO, pH, and ORP, were recorded at a 100 second interval using LabView program. All sensors were calibrated according to manufacturer's specifications and were recalibrated every week. Linear sweep voltammetry (LSV) tests were performed with a potentiostat (Gamry, PA) at a sweep rate of 1 mV s−1, with a range from 0–0.8 V. Due to the tight configuration, no reference electrode was inserted in the reactor. Electrochemical impedance spectroscopy (EIS) was tested with the anode as the working electrode and the cathode as the counter and reference electrode. EIS was performed using a 105 to 0.01 Hz frequency range and 10 mV amplitude. Samples were taken from the effluent of the three chambers and analyzed for chemical oxygen demand (COD) using HACH kits with dilutions made per manufacture instruction to minimize chloride influence. Turbidity was measured using a Hach 2100N turbidimeter, with reading displayed in nephelometric turbidity units (NTU). Samples were tested for turbidity using unfiltered samples as well as 0.2 micron filtered. Energy used by the prototype system was analyzed by a third party (CU cleanlabs) using a DENT ELITEpro datalogger which recorded minimum and maximum current and voltage drawn from a single outlet which supplied all power to the system. Energy use was recorded continuously for seven days during which the system was operated. Water generation was measured from the sodium percarbonate reaction via the following reaction.| 2Na2CO3·3H2O2 → 2Na2CO3 + 3H2O2 | (1) |
| 2H2O2 → 2H2O + O2 | (2) |
where M is the molecular weight of oxygen (32 g mol−1), I is current (A), integrated between the interval between 0 and time Tb, F is Faraday's constant (96
![[thin space (1/6-em)]](https://www.rsc.org/images/entities/char_2009.gif) 485 C mol−1), b is the number of electrons transferred for every mole of oxygen, VAN is the volume of the anode chamber ΔCOD is the change of COD between the influent and the effluent.23
485 C mol−1), b is the number of electrons transferred for every mole of oxygen, VAN is the volume of the anode chamber ΔCOD is the change of COD between the influent and the effluent.23
3. Results and discussion
3.1. Acclimation of the anode electrode and system performance
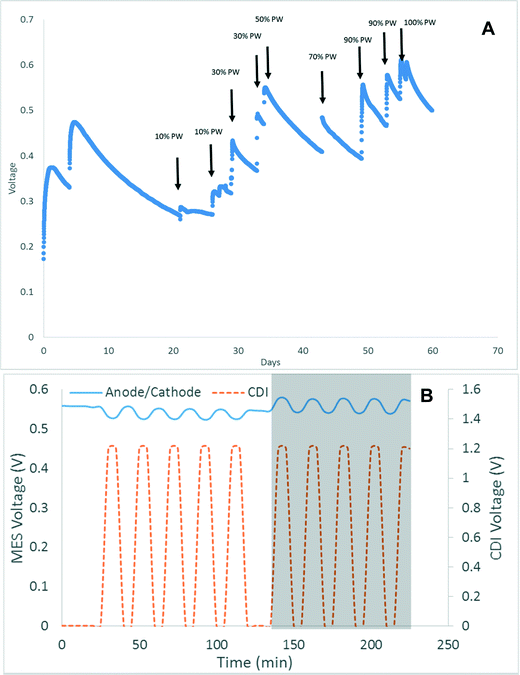
The acclimation of the anode electrode in high salinity wastewater is one the most difficult and timely processes associated with the system. The acclimation of the anode was performed normally as it would be with other microbial fuel cells, however once a stable output was achieved the microbes need to be slowly acclimated to oxidize the produce water and tolerate the high salt content. Fig. 2A shows the effect of adding produced water to the acclimated anode over time. A solution containing 10% produced water caused the voltage to drop from 500 mV to below 300 mV. Over the course of 2 months the percent of produced water was gradually increased until the voltage with 100% produced water exceeded 600 mV. The maximum voltage reached over the 6 months of operation was 680 mV. Interestingly, because of the added conductivity in the produced water, the voltage with produced water was 26% higher than when operating with the sodium acetate. The MCD was operated for nearly 2 years with stable outage output. Between produced water, flowback water #1 and #2, no drastic shifts in voltage were observed after an initial period of adjustment to the higher COD and TDS concentration. Another interesting observation was the influence of applied potential on microbial electrical current generation. It was observed when a negative potential was applied to the CDI module next to the anode the voltage between the anode and cathode increased an average of 30 mV. When a positive potential was applied the voltage decreased an average of 30 mV (Fig. 2B). Because the transfer of electrical current is directly related to the transfer of ions, the negative potential applied next to the anode drew more ions via electrodialysis across the membrane, which then allows for the production of a higher electrical current from the microorganisms. When the potential was switched the ion migration across the membranes were inhibited therefore the current generated by the microorganism was also inhibited.When comparing the MCD prototype system in terms of economics compared to conventional methods published on produced water treatment, the analysis indicates that the MCD system is comparable to other treatment technologies. It has been estimated that disposal cost for produced water ranges from $0.01 per barrel (bbl) to $5 per bbl, with technologies like electrodialysis costing between $0.02–0.64 per bbl.24 The complete capital cost of the MCD system including the materials for the reactors, electronics (pumps, circuits, computers, datalogger, and sensors), structural cage, solenoids, wires, reservoirs is $13![[thin space (1/6-em)]](https://www.rsc.org/images/entities/char_2009.gif) 970 with an operating cost of $0.06 per kW h for electricity and $ 0.05 per gram percarbonate. Not accounting for capital cost, amortization, depreciation, or maintenance, the MCD system is as inexpensive as electrodialysis. However, this is not a representative comparison because the MCD system can also remove turbidity, organic matter as well as TDS making it likely less expensive than many other comparative technologies.
970 with an operating cost of $0.06 per kW h for electricity and $ 0.05 per gram percarbonate. Not accounting for capital cost, amortization, depreciation, or maintenance, the MCD system is as inexpensive as electrodialysis. However, this is not a representative comparison because the MCD system can also remove turbidity, organic matter as well as TDS making it likely less expensive than many other comparative technologies.
3.2 Desalination performance
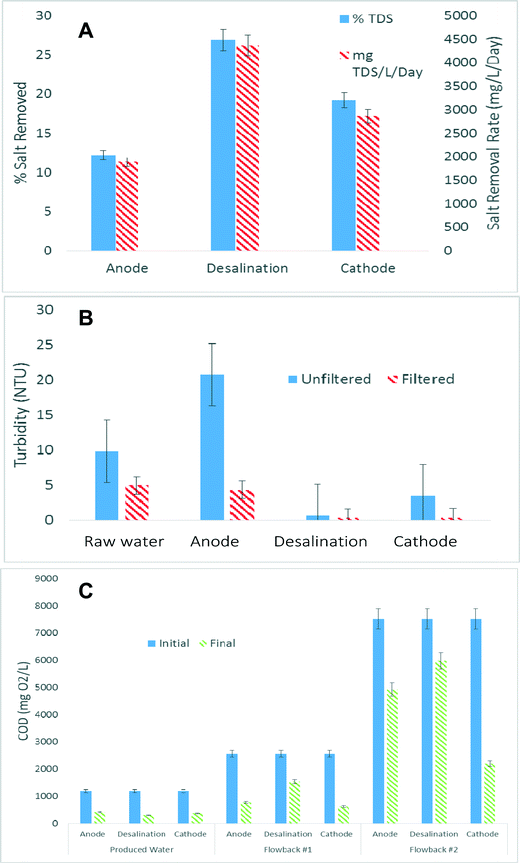
One of the advantages of the MCD system is that it can remove salts and COD simultaneously from all three chambers with energy applied to the system from in situ microbial oxidation. As illustrated in previous studies, in the MCD cations migrate from the anode chamber into the desalination chamber while anions migrate from the cathode chamber into the desalination chamber.19 The capacity of the desalination chamber during desalination allows for salts to be removed from the desalination solution and adsorb ions migrated from the anode and cathode chambers. When the potential is removed the adsorbed ions enter back into the desalination solution creating a concentrate. TDS concentration was determined from the change in electrical conductivity from the influent to the effluent sensors. The three way solenoid valve would switch allowing for the monitoring of distillate and concentrate solutions. Fig. 3A shows over the course of a 24 hour batch period that in average the anode chamber decrease in TDS by 12.1%, the desalination chamber by 26.8% and the cathode chamber by 19.2%, respectively. This correlates to a total salt removal of 10.2 g TDS L−1 per day. For more information on specific changes in conductivity please see ESI† Fig. S1. It was expected that the desalination chamber would have the highest TDS removal, and possible reasons for the lower removal is that there likely an electrical short between the two CDI electrodes due to the carbon fiber contacting each other in the compact spiral wound CDI chamber. It was also anticipated that a larger salt removal capacity would be seen from the cathode chamber rather than the anode. The reason for this is two folds: first because sodium percarbonate is added the produced water the initial TDS concentration in the cathode chamber is higher leading to a greater potential difference between the cathode and the desalination chamber than the anode and desalination chamber, leading to greater flux. Also, because sodium percarbonate reacts in water to generate water, the catholyte inherently becomes diluted. Because of the low TDS removal rates only produced water was investigated for TDS removal.3.3 TSS and COD removal
All three chambers in MCD can be used for TDS, TSS, and COD removal. TSS in the anode chamber almost doubled in 24 hours due to microbial growth in the anode chamber but when the solution was passed through a 0.2 micron filter the turbidity dropped to below 5 NTU (Fig. 3B). The desalination chamber showed high turbidity removal, with turbidity below 1 NTU whether filtered or unfiltered. The cathode chamber also was good at removing particulate due to chemical oxidation of the organic matter. When the unfiltered catholyte solution was tested the turbidity averaged 3.1 NTU but once filtered the turbidity dropped below 1 NTU. This is due the removal of participates formed by the oxidative sodium percarbonate (Fig. 3B). The COD removal in the anode chamber due to microbial oxidation. In the middle chamber, charged organic carbon molecules can be electrically and physically adsorbed to the CDI module. In the cathode chamber, part of the redox potential of the sodium percarbonate is used to oxidize the dissolved carbon as well as serve as the electron acceptor. For the produced water tested in the anode, desalination, and cathode chamber 65%, 75%, and 68% of the COD was removed respectively (Fig. 3C). Using the flowback #1 wastewater the anode, desalination and cathode chambers removed 69%, 40%, 76% of the COD, respectively. With flowback #2 the anode, desalination and cathode chambers removed 34%, 20%, 70% of the COD (Fig. 3C). The type of organic compounds found in water generated during oil and gas production can vary greatly. The variation seen in COD removal between the three waste waters indicate that there are microbial preferred organic constituents. The highest COD removal in the anode chamber was with flowback #1 and the least with flowback #2. This is likely associated with the biodegradability of the organics present in samples #1 and #2, because the crosslinked gel fracturing fluid contains higher concentration of biodegradable sugar contents, which makes earlier samples like #1 more biodegradable than #2, which contains less sugar but higher hydrocarbon. The produced water is obtained from a different operation so data is not comparable. While the specific organics were not characterized in this study, what can be said is that visually the microbial product change between the waste streams. During the use of the produced water and flowback #1 the effluent microbes appeared slightly orange. With flowback #2 the effluent microbes shifted to a black color. The coulombic efficiency (CE) for the reactor using produced water was calculated to be 11.4%. Most likely the cause of the low CE is due to dissolved oxygen being present in the anode chamber which causes microbial oxidation but not necessarily electron transfer. Improvements to system operation, by decreasing the DO value, will increase the CE for the reactor.3.4. Power production and internal resistance
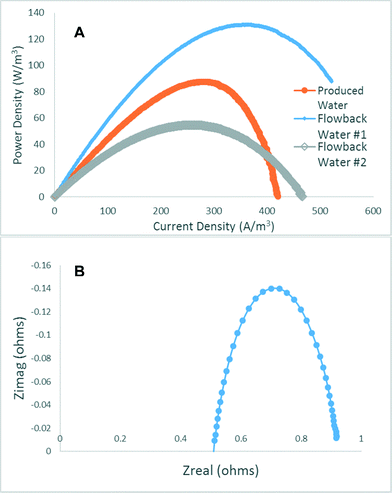
From LSV testing it was determined that the maximum power point for the reactor using produced water was 89 W m−3 (Fig. 4A). With a maximum current for the reactor was recorded at 228 mA. Compared to many small scale reactors this is a drastic improvement to the current output of a bioelectrochemical system. While part of the reason for the high current was due to the high electrical conductivity of produced water, there was also the advantage of the design in that it contained a large projected surface area and shorter travel distance for microbial electron transfer. Because activated carbon was used as the anode and cathode electrodes the actual surface area for electron transfer was on the order of 3600 m2. The maximum power point for the flowback water #1 and #2 was 131 W m−3 and 54 W m−3 (Fig. 4A). The results from the LSV help explain the results observed in COD removal. The highest power was generated with the flowback #1 water which correlates with the highest COD removal. Another reason for the high power densities observed in the MCD has to do with the low internal resistance of the reactor. Electrochemical impedance spectroscopy (EIS) was unable to be tested on the reactor during the initial testing period. However after 2 years of operations EIS was tested and the results were low. The ohmic resistance defined as the intercept of the x-axis on a Nyquist plot was 0.5 ohms, with a polarization resistance of 0.4 ohms. These results are similar to other spiral wound impedance results observed using sodium acetate as the substrate.153.5 Change in temperature pH, DO, and ORP
The temperature of the reactor influent into the anode chamber remained relatively stable between 24–25 °C, as the unit is operated in a lab condition. Fluctuation of temperature was more likely due to building heating and cooling system rather than being a product of experimentation (Fig. 5A). When the same produced water fed into all 3 chambers, the anode chamber had only a minor change in pH value, ranging from 6.8 to 7.3 pH units, but on average only a 0.1 pH value variation was found over the course of a day (Fig. 5B). The desalination chamber and the cathode chamber had much larger pH changes. The desalination chamber increased in pH from 7.2 to 7.7 while the cathode increased to 7.8. This level of change has been observed previously and is one of the challenges with the MCD system.11 The DO at its lowest point reach a value of 10% but averaged 15% during operation. A DO value of 100% would indicate oxygen saturated water. A DO value of 15% is quite high for an anaerobic reactor indicating that improvements need to be made to the system operation to help insure the oxygen concentration is as low as possible. This will help improve the overall system performance and the coulombic efficiency. The oxidation reduction potential (ORP) for the system was monitored on the effluent of the cathode chamber. Because sodium percarbonate was added to the reactor as an electron acceptor and to increase buffering capacity, ORP was a good indicator when additional sodium percarbonate needed to be added to the reactor. Sodium percarbonate added to the produced water yielded an ORP value of a positive 200 ± 20 mV. Over the 24 hour period the ORP would only decrease on average to 180 mV (Fig. 5C).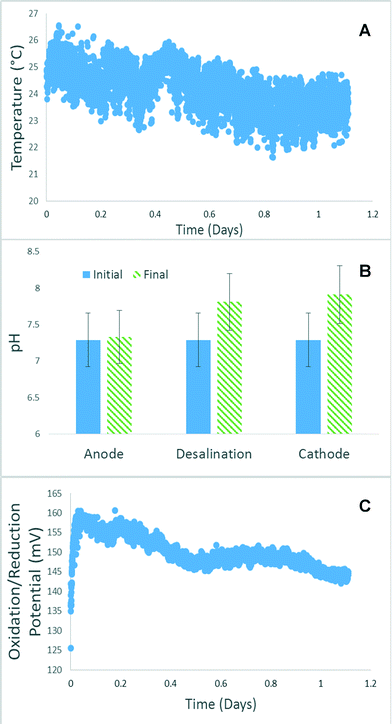 | ||
| Fig. 5 Changes in (A) temperature, (B) pH, and (C) redox potentials in the MCD system in a typical day. | ||
3.6 Water recovery and total water volume
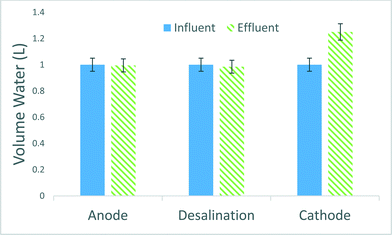
When desalinating salt water, the amount of usable water recovered from the process is an important parameter. The MCD system was operated with a 50% water recovery rate, where 50% of the water was designated for waste and 50% as cleaned desalinated water. Additional investigations are being conducted to convert the concentrate into usable disinfectant for onsite use, and the optimization to increase the product water ratio. One interesting thing about the reactor is the additional water production due to the use of sodium percarbonate. Percarbonate is an oxygen releasing compounds with a molecular structure of hydrogen peroxide bound to sodium carbonate (eqn (1)). When sodium percarbonate is added to water, hydrogen peroxide is released quickly into solution (eqn (1)) and reacts with the cathode as the electron acceptor. The end product after the reaction is water and sodium carbonate species, which has been known as a pH buffer and can be discharged to the environment safely (eqn (2)). The total water volume for the system over a 24 hour period of operation increased 16–25% (Fig. 6). The variation of the amount of water generated in the cathode chamber is likely due to a combination of factors including the amount of oxidant used for chemical oxidation, oxygen reduction and microbial electron transfer. Therefore the prototype system not only removes dissolved salts and organics and produces electricity but also produces water at not insignificant volumes. This could be especially important in arid climates like the western part of the United States of America.4. Conclusion
The spiral wound MCD prototype system demonstrates that energy and water are not mutually exclusive rather closely synergetic. Presented here for the first time is a liter scale (2.2 L) reactor capable of generating energy and water while removing organic contaminates, particulates, and dissolved salts from real wastewater generated during oil and gas production. Similar to many pilot system studies, the system did encounter several challenges including water leaking and short circuiting, but the potential for this technology to solve a major environmental problem of produced water while providing new water and electricity supply makes the MCD technology an attractive solution.Acknowledgements
We appreciate the support from the National Science Foundation (IIP-1445084) and the Office of Naval Research (N000141310901). We thank Drs. Karl Linden and James Rosenblum for providing some flowback water samples.References
- K. Guerra, K. Dahm and S. Dundorf, Oil and gas produced water management and beneficial use in the Western United States, US Department of the Interior, Bureau of Reclamation, 2011 Search PubMed.
- C. E. Clark and J. A. Veil, Produced water volumes and management practices in the United States, Argonne National Laboratory (ANL), 2009 Search PubMed.
- N. Abualfaraj, P. L. Gurian and M. S. Olson, Environ. Eng. Sci., 2014, 31, 514–524 CrossRef CAS
.
- O. Kouznetsov, V. Sidorov, S. Katz and G. Chilingarian, J. Pet. Sci. Eng., 1995, 13, 57–63 CrossRef
.
- A. Fakhru'l-Razi, A. Pendashteh, L. C. Abdullah, D. R. A. Biak, S. S. Madaeni and Z. Z. Abidin, J. Hazard. Mater., 2009, 170, 530–551 CrossRef PubMed
.
- K. L. Hickenbottom, N. T. Hancock, N. R. Hutchings, E. W. Appleton, E. G. Beaudry, P. Xu and T. Y. Cath, Desalination, 2013, 312, 60–66 CrossRef CAS
.
- O. Monzon, Y. Yang, C. Yu, Q. Li and P. J. Alvarez, Environ. Chem., 2014, 12, 293–299 CrossRef
.
- G. Chen, Z. Wang, L. D. Nghiem, X.-M. Li, M. Xie, B. Zhao, M. Zhang, J. Song and T. He, Desalination, 2015, 366, 113–120 CrossRef CAS
.
- X.-M. Li, B. Zhao, Z. Wang, M. Xie, J. Song, L. D. Nghiem, T. He, C. Yang, C. Li and G. Chen, Water Sci. Technol., 2014, 69, 1036–1044 CrossRef CAS PubMed
.
- Technical Assessment of Produced Water Treatment Technologies, Colorado School of Mines, 2009 Search PubMed.
- C. Forrestal, P. Xu and Z. Ren, Energy Environ. Sci., 2012, 5, 7161–7167 CAS
.
- H. Wang and Z. J. Ren, Biotechnol. Adv., 2013, 31, 1796–1807 CrossRef CAS PubMed
.
- C. Forrestal, Z. Stoll, P. Xu and Z. J. Ren, Environ. Sci.: Water Res. Technol., 2015, 1, 47–55 CAS
.
- Z. A. Stoll, C. Forrestal, Z. J. Ren and P. Xu, J. Hazard. Mater., 2015, 283, 847–855 CrossRef CAS PubMed
.
- A. Haeger, C. Forrestal, P. Xu and Z. J. Ren, Bioresour. Technol., 2014, 174, 287–293 CrossRef CAS PubMed
.
- A. Sagiv and R. Semiat, Desalination, 2005, 179, 1–9 CrossRef CAS
.
- C. Forrestal, Z. Huang and Z. J. Ren, Bioresour. Technol., 2014, 172, 429–432 CrossRef CAS PubMed
.
- S. Cheng, H. Liu and B. E. Logan, Electrochem. Commun., 2006, 8, 489–494 CrossRef CAS
.
- D. Ma, C. Forrestal, M. Ji, R. Li, H. Ma and Z. J. Ren, Environ. Sci.: Water Res. Technol., 2015, 1, 348–354 CAS
.
-
Z. Ren, C. Forrestal and X. Pei, US Pat. App. 14345104 2, 2012 Search PubMed
.
- M. A. Anderson, A. L. Cudero and J. Palma, Electrochim. Acta, 2010, 55, 3845–3856 CrossRef CAS
.
- C. Forrestal, P. Xu, P. E. Jenkins and Z. Ren, Bioresour. Technol., 2012, 120, 332–336 CrossRef CAS PubMed
.
- B. E. Logan, B. Hamelers, R. A. Rozendal, U. Schrorder, J. Keller, S. Freguia, P. Aelterman, W. Verstraete and K. Rabaey, Environ. Sci. Technol., 2006, 40, 5181–5192 CrossRef CAS PubMed
.
- A. Fakhru'l-Razi, A. Pendashteh, L. C. Abdullah, D. R. A. Biak, S. S. Madaeni and Z. Z. Abidin, J. Hazard. Mater., 2009, 170, 530–551 CrossRef PubMed
.
Footnote |
| † Electronic supplementary information (ESI) available. See DOI: 10.1039/c5ew00211g |
| This journal is © The Royal Society of Chemistry 2016 |

