Silica fouling in high salinity waters in reverse osmosis desalination (sodium–silica system)
L.
Lunevich
*a,
P.
Sanciolo
a,
L. F.
Dumée
b and
S. R.
Gray
a
aInstitute for Sustainability and Innovation, College of Engineering and Science, Victoria University, Melbourne, Victoria 8001, Australia. E-mail: llunevich@yahoo.co.nz
bInstitute for Frontier Materials, Deakin University, Geelong, Victoria 3216, Australia
First published on 11th April 2016
Abstract
Silica fouling patterns in a sodium–silica system and the effect of pH on residual dissolved silica concentrations are reported. The unique chemical affinity between sodium and silica (SO4) prevented silica scale deposition on the membrane surface during reverse osmosis (RO) desalination. It was found that high concentrations of sodium in solutions depressed silica solubility to 81–84 mg L−1 for a maximum NaCl salinity of 60–65 g L−1. Using a range of membrane examination techniques, it was found that no silica scale formed on the RO membrane surfaces from NaCl solutions free from cations such as Ca, Al and Fe. This was considered to be the result of sodium ions acting as a barrier between polymeric silica and the membrane surface.
Water impactSilica fouling on the RO membrane surface remains challenging and unpredictable for many high water recovery RO desalination plants processing various salinity waters. Further increasing the recovery of water or permeate production significantly reduces the quantity of brine discarded into the natural environment and as a result significantly reduces the environmental impact of salinity. |
1. Introduction
Silica precipitation or silica fouling in reverse osmosis (RO) desalination within the super-saturation zone, like all other precipitation processes, involves two phases: the super-saturation of dissolved silica species in liquid followed by polymerisation of the dissolved silica species and aggregation of polymerised dispersed silica into nano-particles. These physico-chemical processes are most likely to occur near the membrane surface where the silica concentration will be the highest as a result of rejection of ions by the RO membrane. Knowledge of the residual dissolved silica concentrations (solubility limits) for saline waters is vital since the solubility determines whether the solution is saturated or not and what water recovery is possible before silica scaling is likely to occur. The solubility limit is defined as the total amount of solute species that can be retained permanently in solution under a given set of conditions, including the sodium chloride concentration, the bulk temperature, feed pressure and pH, in the presence of an excess of undissolved material of definitively known composition and crystal structure from which the solute is derived.1It is therefore necessary to investigate the “practical solubility” limit, corresponding to the impact of all components within the water matrix on the silica species equilibrium.2,3 The concentration of these species shall, therefore, be recorded during RO runs to provide relevant data for the kinetics of silica precipitation under various salinity and pH conditions. The practical solubility limit is typically derived experimentally using specific water qualities of interest, for which the impact of minor components cannot be predicted or their concentrations evaluated.2 The practical solubility limit is, therefore, specific to an individual water composition, i.e. the anions and cations present. Additionally, the duration of the experimentally determined practical solubility limit is restricted to short time scales over which the experiments are conducted, thus true equilibrium may not be always reached. For RO applications, bench-top laboratory tests are typically carried out to determine the practical solubility limit with either model or original waters.
Silica precipitates when the dissolved silica concentration exceeds the solubility limit; however, due to the rapid increase of the dissolved silica concentration across the membrane surface, silica precipitation may not always occur due to slow precipitation kinetics.3,4 For this reason, the concept of maximum and stable residual silica concentrations was introduced to characterise dissolved silica concentrations leading to silica fouling and scale formation.3 Dissolved silica precipitation originates either from the polymerisation of dissolved silica species or from physico-chemical interactions between various dissolved silica species.5 Silica polymerisation processes occur within the super-saturation zone and depend on many factors such as pH, sodium and silica concentrations.
In this work, silica RO fouling trends were studied in synthetic waters of various salinities in the absence of silica complexing cations (calcium, aluminium, iron, etc.) to precisely record the residual dissolved silica concentrations in sodium chloride solutions. The concept of practical silica solubility was tested by experimentally recording the stable and maximum dissolved silica concentrations under various salinity and pH conditions. The experimental maximum and stable silica concentration data were then correlated with the silica solubility limits obtained from Hamrouni at pH 8 and Gorrepati at pH 3 conditions.2,3,6
2. Experimental
2.1. Bench-scale RO system
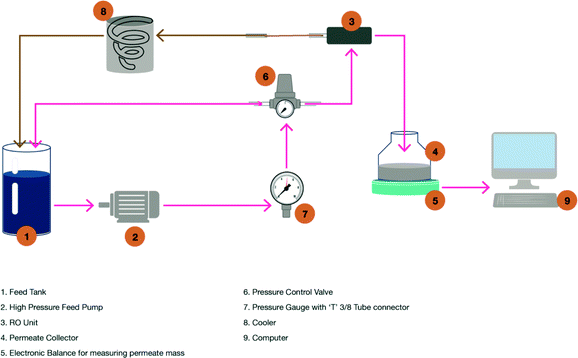
A Sterlitech CF042 laboratory-scale cross-flow membrane filtration unit was used. It was arranged with over 2.0 litres of feed storage. The feed stream was pumped from the feed storage tank to the feed inlet (Fig. 1).The feed inlet was located on the cell bottom. The flow continued through a manifold into the membrane cavity. Once in the cavity, the solution flowed tangentially across the membrane surface. A portion of the solution permeated the membrane and flowed through the permeate carrier, which was located on the top of the cell. The permeate flowed to the centre of the cell top, was collected in a manifold and then flowed out the permeate outlet connection into the permeate collection glassware (Fig. 1, number four). The concentrate stream, which contained the material rejected by the membrane, continued sweeping over the membrane and was collected in the concentrate manifold.
The concentrate then flowed out the concentrate tube via a cooling system (Fig. 1, number eight) into the feed storage. The operational pressure was maintained at 48 bar for all RO experiments using a pressure-regulating valve on the feed line (Fig. 1). The regulating valve allowed a constant pressure feed to be maintained upon an increase in osmotic pressure as a result of an increase in the amount of total dissolved solids (TDS) in the recycled stream. The temperature of the water after the feed pump was controlled to 15.5 °C using a cooling system (Fig. 1 and Table 1).
| Parameters | Working conditions |
|---|---|
| Effective membrane area | 32 cm2 |
| Maximum feed turbidity (the initial feed sample was filtered with a 0.45 μm filter or similar UF filters) | <1 NTU |
| Operating pressure | 48 bar |
| Maximum operating temperature | 15.5 °C |
| pH range, continuous operation | 3–11 |
| Flow range | 1–6 L s−1 |
| Permeate flux range | 10–60 L m−2 h−1 |
A seawater membrane (SW30) was sourced from DOW Chemical Company. The membrane was cut and precisely opened to disassemble the membrane from protective materials. Then, the membrane sheets were cut and wetted with sodium metabisulphate (0.1% concentration) and then stored in plastic bags. The plastic bags were stored in a laboratory refrigerator at approximately 4 °C. Prior to the RO experiment, 4 × 8 cm membrane samples were cut and installed in the base of the RO test cell. The fresh membranes were first compacted for 1 hour with deionised water at the operational pressure of 48 bar prior to performing the RO experiment. To avoid any abrupt pressure or cross-flow variations during start-up and to prevent possible membrane damage, the feed flow was increased gradually over the first 30–60 seconds.
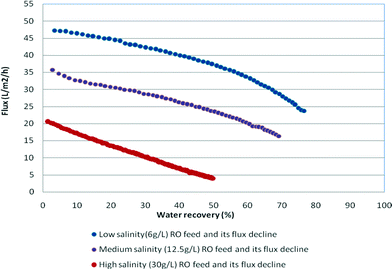
All experiments were conducted in a continuous flow system with concentrate recycling back to the feed and continuous removal of the permeate. A sharp decline in the permeate flow rate denoted that the solubility limit and scaling thresholds were reached. Chemical analysis of the recycled concentrate stream was systematically performed across a series of tests. Analyses of results for flux decline, caused by silica deposition and scaling processes and an increase in osmotic pressure, were based on examination of the decay in permeability at various silica concentrations prevailing on the membrane surface. The onset of silica fouling (polymerisation and precipitation) was determined from the dissolved silica concentrations (decline in dissolved silica concentrations) in the recycled concentrate. ICP spectroscopy and/or the silica molybdenum method (Hatch) were used to analyse for silicon. Scanning electron microscopy (SEM) and energy-dispersive spectroscopy (EDS) were used in the examination of the membranes after completion of the tests. The experimental silica concentration in the recycled concentrate stream was compared to the theoretical silica concentration assuming 100% rejection of silica and no scaling. When the theoretical and experimental values were no longer consistent and the experimental values were lower than the theoretical values, scaling was assumed to occur. The filtration times varied between 8 and 42 hours due to the large variation in osmotic pressure between experiments with low and high salinity feeds that affected the operational flux – as the salinity of the recycled stream gradually increased as a result of permeate withdrawal during operation leading to a decrease in flux. For high salinity feeds, the net operating pressure at the end of the experiments was very small leading to a flux of <5 L m−2 h−1 compared to the final flux values of approximately 25 L m−2 h−1 for low salinity feeds (see Fig. 2).
2.2. RO feed experimental solutions
Ten litre batches of various sodium chloride concentration solutions were prepared by dissolving sodium chloride in deionised water. Deionised water was obtained from a laboratory Milli-Q system (conductivity <1 μS cm−1; Milli-Q, Millipore Corp.). The presence of cations such as Ca, Mg, Al, Fe and Ba in deionised water was determined by ICP and all were at undetectable concentrations. Waters were spiked with silica as-required. Sodium silica (water glass, Na2SiO3, composition ratio – water 62.9% and silicic acid/sodium salt 37.1%) from STAR™ sodium silicate solution (PQ Corporation, US) was used. Analytical grade sodium chloride was obtained from Sigma-Aldrich Chemical Co., China. pH adjustments were made using 0.1% HCl and 0.1% NaOH. The RO feed solution was filtered via a 0.45 μm filter (cellulose acetate; ADVANTEC® membrane filter, Toyo Roshi Kaisha, Ltd., Japan). Water quality for various salinity synthetic waters is summarised in Table 2.| Parameter | Unit | Low salinity (6 g L−1 as NaCl) | Medium salinity (12.5 g L−1 as NaCl) | High salinity (30 g L−1 as NaCl) |
|---|---|---|---|---|
| Turbidity | NTU | <1 | <1 | >1 |
| Conductivity | μS cm−1 | 6800 | 15![[thin space (1/6-em)]](https://www.rsc.org/images/entities/char_2009.gif) 880 880 |
42![[thin space (1/6-em)]](https://www.rsc.org/images/entities/char_2009.gif) 100 100 |
| Salinity (as NaCl) | g L−1 | 6 | 12.5 | 30 |
| Total silica (SiO2) | mg L−1 | 50 | 50–70 | 50–70 |
| Dissolved silica (SinOx−) | mg L−1 | 50 | 50 | 50 |
2.3. ICP sample preparation
After collection, all samples were filtered through 0.2 μm filters (cellulose acetate; ADVANTEC® membrane filter, Toyo Roshi Kaisha, Ltd., Japan) and diluted with deionised water to ensure that the concentrations were within the calibration range of the ICP. Then, the diluted sample was spiked with a drop of HCl (0.1% concentration). ICP analysis was performed with and without HCl addition (0.1% HCl) to compare the results on dissolved silica concentrations determined by ICP.The major limitation of this method was that dilution of samples could introduce an error into a final calculation. To reduce the significance of errors arising from dilution, the samples were analysed with different dilution factors to verify the results. The maximum predicted error was calculated to be ∼2.3%. Therefore, the errors do not affect the trends in the data or the overall conclusions presented.
2.4. Permeate flux variations between salinities
Fig. 2 illustrates the permeate flux decline curves as permeate recovery increases with increasing salinity RO feed. The lower permeate flux that occurred at high salinity impacted the duration of the experiments and silica precipitation kinetics.The data monitored during each run included the weight of the recovered permeate, pressure, temperature, run time, pH, turbidity, conductivity and dissolved silica concentrations in the concentrate. The data calculated include the permeate flow rate, flux, water recovery and salt rejection.
3. Results
3.1. RO residual silica concentration
Fig. 3 and 4 demonstrate the silica fouling results in medium and high salinity waters, where silica fouling is shown for both pH 9 and pH 3 conditions. No silica precipitation was recorded for low salinity waters due to the relatively high net trans-membrane pressure compared to those for the medium and high salinity waters, and therefore the shorter duration of the experiments. These results indicate the slow kinetics of silica precipitation under these RO filtration conditions and slightly higher silica solubility at low salinity.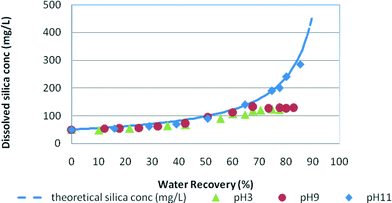 | ||
| Fig. 3 Silica fouling trends in synthetic water at pH 3, pH 9 and pH 11 vs. water recovery in medium salinity feed (NaCl = 12.5 g L−1). Initial RO feed dissolved silica concentration = 50 mg L−1. | ||
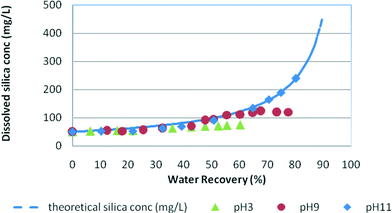 | ||
| Fig. 4 Silica fouling trends in synthetic water at pH 3, pH 9 and pH 11 vs. water recovery in high salinity feed (NaCl = 30 g L−1). Initial RO feed dissolved silica concentration = 50 mg L−1. | ||
In medium salinity synthetic water (Fig. 3), the dissolved silica concentration curve deviates from the theoretical silica line at around 60% water recovery for pH 9 and at about 52% for pH 3 indicating silica precipitation in the solutions. Fig. 4 shows the typical silica fouling trends recorded for high salinity waters. At pH 3 and pH 9, the residual silica concentration deviates from the theoretical concentration at 41% water recovery and 56% water recovery, respectively. No silica precipitation occurred at pH 11 for medium and high salinity waters as was expected because of the higher silica solubility at this pH.
3.2. Stable and maximum silica residual concentrations
Maximum and stable residual concentrations were recorded to capture variations in the residual dissolved silica concentrations during the RO run (Fig. 5).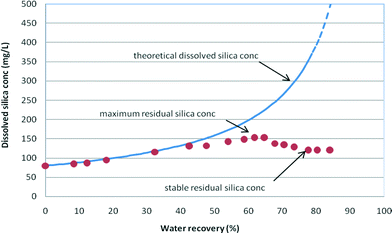 | ||
| Fig. 5 Dissolved silica (as SiO2) concentrations vs. water recovery (wt%) – maximum and stable residual silica concentrations recorded in medium salinity (NaCl = 12.5 g L−1) synthetic waters with an initial silica concentration of 70 mg L−1 at pH 9. The stable and maximum residual silica concentrations recorded are summarised in Table 3. | ||
The maximum residual silica concentration is the maximum concentration reached during the RO experiments and provides an indication of the degree of supersaturation of the solution. This silica concentration is frequently named a “pseudo-solubility” state, as defined by ref. 3 when the silica concentration significantly exceeds the theoretical silica solubility concentration due to the relatively fast increase in dissolved silica concentration with insufficient time for dissolved silica to precipitate. This “pseudo-solubility” dissolved silica concentration indicates a competitive kinetic process between silica hydrolysis and polymerization, since insufficient time was provided to fully equilibrate the different silica species.3,6
Upon silica precipitation, the silica concentration settles at the solubility limit for the particular water composition and conditions as RO filtration proceeds (Fig. 5). As can be seen from the consolidated data in Table 3, the stable residual dissolved silica concentrations decreased with increased salinity. Stable residual silica concentrations were identified when the silica concentration deviates from the theoretical concentration curve for the experimental (calculated) rejection of silica in solution and remains at a stable silica concentration for the remainder of the RO filtration (Fig. 3–5).
| RO feed conditions | Silica fouling salinity (NaCl, g L−1) | Stable residual dissolved silica conc. (mg L−1) | Maximum residual dissolved silica conc. (mg L−1) | Permeate recovery (%) | ||
|---|---|---|---|---|---|---|
| Salinity (as NaCl, g L−1) | Silica conc. (as SiO2, mg L−1) | pH | ||||
| NF = non-fouling conditions. | ||||||
| 6 | 50 | 3, 9, 11 | NF | NF | NF | 87 |
| 12.5 | 50 | 3 | 51.2 | 123 | 148 | 75 |
| 12.5 | 50 | 9 | 52.0 | 125 | 142 | 76 |
| 12.5 | 50 | 11 | NF | NF | NF | 76 |
| 30 | 50 | 3 | 65.9 | 81 | 103 | 62 |
| 30 | 50 | 9 | 65.0 | 84 | 105 | 63 |
| 30 | 50 | 11 | NF | NF | NF | 67 |
The results obtained for the medium and high salinity synthetic waters showed a spread of the maximum and stable silica concentrations that varied from 81 to 148 mg L−1 (Table 3). Relatively low residual dissolved silica concentrations such as 81–84 mg L−1, recorded in high salinity waters (60–65 g L−1 as NaCl), were due to the low silica solubility compared to those in medium salinity (8–12.5 g L−1 as NaCl) waters where the dissolved silica concentrations were 138–148 mg L−1. The normalised flux for medium salinity water was 1.7 times higher than that for high salinity water (Fig. 2) and, as a result, the duration of the RO run was nearly 2.5 times shorter than that for high salinity water. It is likely that residual dissolved silica concentrations in the range 120–148 mg L−1 indicated that silica solubility was much higher in medium salinity waters than that in high salinity water. Secondly, slow kinetics of precipitation allowed residual silica concentrations to reach higher values than the silica solubility level (practical silica solubility in specific water matrix).
The spread of stable concentrations was insignificant for variations in pH at a given salinity, and the maximum concentrations were also very similar for runs with the same salinity. The exception is at pH 11, where there was no fouling. Kinetics may explain the lower maximum silica concentration for high salinity waters, as the filtration was conducted over a longer timeframe and the rate of increase in water recovery was slower (Fig. 2). No silica precipitation was recorded at pH 3, 9 and 11 for low salinity water as a result of the relatively short RO run of ∼8 hours and the higher silica solubilities at lower salinity.
3.3. Effect of salinity
Fig. 6 demonstrates the effect of salinity on stable residual silica concentrations. As can be seen, silica solubility decreased as the salinity of water increased. For salinity at about 59–60 g L−1 (NaCl) or 1 mol of NaCl, the stable residual concentrations were 84–88 mg L−1. These were slightly higher than the silica solubility limits recorded by Hamrouni.2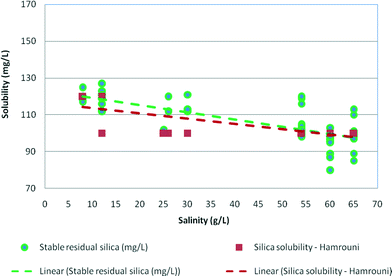 | ||
| Fig. 6 Effect of salinity on stable residual silica concentrations plotted against silica solubility recorded by Hamrouni (2001) in synthetic waters at pH 8–9. | ||
The effect of salinity on the experimental maximum silica values is plotted in Fig. 7 illustrating that maximum silica concentrations were also affected by sodium chloride concentrations and decreased from 150 mg L−1 for medium salinity waters (12.5 g L−1) to 100 mg L−1 for high salinity samples (65 g L−1). Overall, the maximum residual silica concentrations were 10–12% higher than the stable residual silica concentrations and about 12–15% higher than the silica solubility recorded by Hamrouni.2,5,6
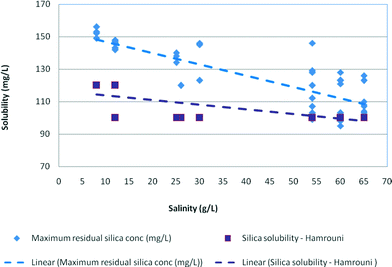 | ||
| Fig. 7 Effect of salinity on maximum residual silica concentrations plotted against silica solubility recorded by Hamrouni (2001) in synthetic waters at pH 8–9. | ||
3.4. Effect of pH
Fig. 8 illustrates the effect of low pH conditions on stable and maximum residual silica concentrations. The results in both graphs are plotted against the results obtained by Gorrepati at pH 3 in medium and high salinity waters. As can be seen, the stable residual silica concentration of 81 mg L−1 at high salinity was slightly lower than the silica concentrations (98–102 mg L−1) recorded by Gorrepati.4,6 According to Gorrepati, at pH 2–3, dissolved silica forms small nuclei, which initiate gelling or precipitation of silica. These very small nuclei, normally un-ionised polymeric silica groups, catalyse the aggregation of dissolved silica leading to polymerisation followed by precipitation.6,8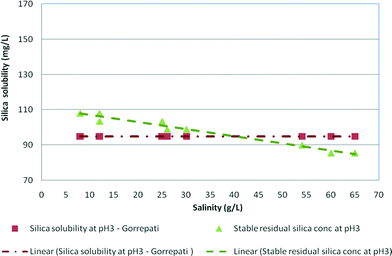 | ||
| Fig. 8 Stable residual silica concentrations for medium and high salinity synthetic waters at pH 3 and silica solubility at pH 3 (Gorrepati, 2010) vs. salinity. | ||
The maximum residual silica concentrations at pH 3 recorded in this research were slightly higher (103–148 mg L−1) than the silica solubility (98–102 mg L−1) recorded by Gorrepati at pH 3 probably due to the analytical technique used.6 Gorrepati used dissolved silica minerals in acid solutions over time periods of about 5–7 hours, while in the current experiments, silica glass was dissolved and then silica precipitated as the concentration increased due to RO filtration for a period of >8 hours.
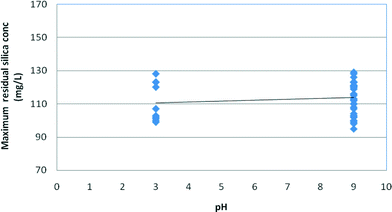
Fig. 9 and 10 illustrate the effect of pH on the stable and maximum residual silica concentrations. Slightly lower stable and maximum residual silica concentrations were recorded at pH 3; however, a minor increase in solubility at high pH is possible but this trend is within the variation of the experimental results. The spread of the experimental data at pH 9 for both medium and high salinity waters illustrates the higher impact of salinity on silica fouling at pH 9 compared to that at pH 3, as shown in Fig. 9 and 10. It appears, however, that at pH 9 silica solubilities are a stronger function of salinity than those at pH 3 (Fig. 9 and 10).
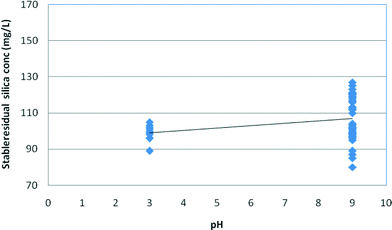 | ||
| Fig. 9 Effect of pH on stable residual silica concentrations in medium (12.5 g L−1) and high (30 g L−1) salinity synthetic waters. | ||
As can be seen from Fig. 9 and 10, the effect of salinity is much greater than the effect of pH so the spread of values at each pH masks the minor effect of pH. According to Gorrepati6 and others,3,4,10,20,22 silica precipitation at low pH follows a two-step process – formation of 5 nm primary particles followed by particle flocculation – which became exponentially faster with increasing HCl concentration and higher salt concentrations.6 At pH 3, the stable silica concentration was recorded at 81 mg L−1 at high salinity compared to 84 mg L−1 at pH 9 (Table 3). Furthermore, the majority of the research completed on silica scale formation in RO desalination recognises that silica precipitation is not a simple function of pH.8,9,11 At relatively high silica concentrations, silica could skip a precipitation step to form a gel, which could be perceived as a monomeric silicic acid.12–14 On the other hand, the kinetics of silica precipitation gradually increases with increasing pH up to pH 9.1 According to Smolin, at low pH (1–3), silica polymerisation proceeds via proton-initiated gelling and, as a result, silica sol agglomeration via –O–Si–O– bonds may occur spontaneously upon reaching a pH window of 3–3.2 prior to gelling.11–16
3.5. Membrane surface examination
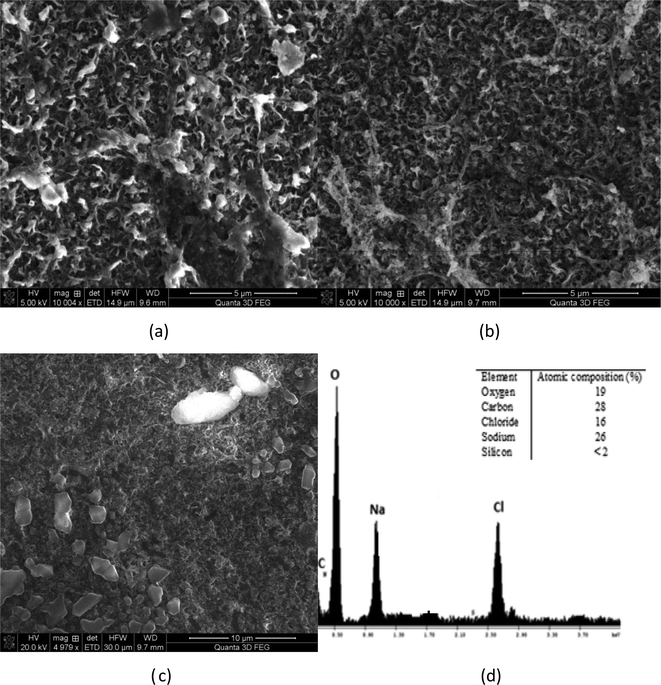
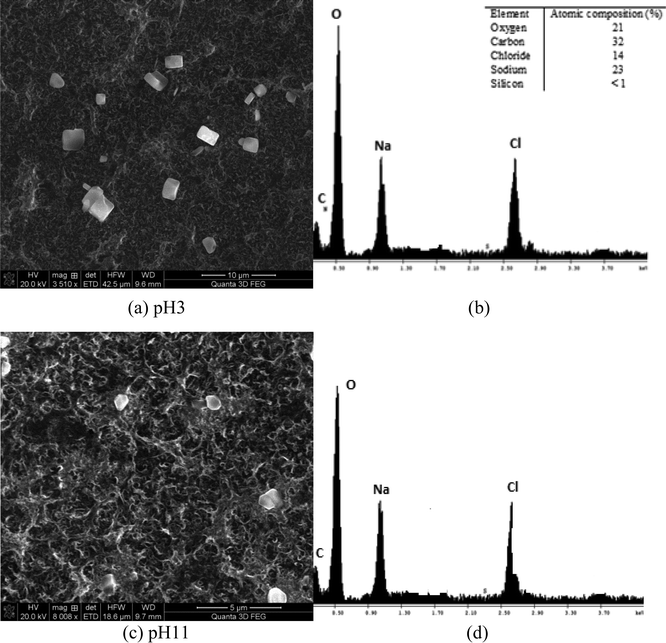
Membrane autopsies were performed in order to determine the nature of the deposits on RO membranes following desalination experiments (Fig. 11 and 12). The images of the membrane surface obtained using SEM at different magnifications indicated that the surface particles were occasionally sodium chloride crystals, probably formed after the membrane was removed from the RO unit. No silica deposits were detected on the RO membrane surfaces in medium and high salinity waters where silica precipitation occurred (Fig. 11(a)–(d)).EDS elemental analysis of each membrane showed non-detectable silica concentrations on the membrane surface for each water studied. This result suggests that sodium ions prevented precipitated silica from bonding to the membrane surface. It is likely that silica aggregated into colloidal structures as the turbidity in the initial RO feed increased from 0.1 NTU to 0.7 NTU, which remained in the recycled stream until the experiment terminated. These results are consistent with the hypothesis proposed by Healy.3,7,17 They suggest that when the sodium concentration in the solution exceeds 8 g L−1, sodium ions create binding layers around silica (polymeric, monomeric, colloidal) preventing silica from attack by water molecules and especially –OH groups, which link silica deposits to membrane surfaces.
Fig. 12(a) and (b) illustrate the membrane surface following filtration at pH 3 and the EDS spectrum of the deposited particles. At pH 3, slightly less sodium chloride particles were detected. EDS elemental analysis also confirmed that the silicon content was <1% (undetectable level) on the membrane surface (Fig. 11(b)). This is probably due to slight contamination of the membrane surface upon drying, but not due to silica scaling. It should be noted that the concentration of carbon in both cases, pH 3 and pH 9, was high due to the polyamide RO membrane, which contains substantial amounts of carbon and oxygen functional groups (carboxylic groups across the poly(amide) material). Fig. 12(c) and (d) show the membrane surface at pH 11 conditions for similar high salinity waters. No silicon was observed at pH 11. As can be seen, single chloride particles were observed likely formed during drying of the membrane samples.
4. Discussion
Silica fouling on the RO membrane surface remains challenging and unpredictable for many RO desalination plants processing various salinity waters. The results recorded for residual dissolved silica concentrations in medium and high salinity synthetic waters confirmed a significant decrease of silica solubility limits to 81–84 mg L−1 for approximately 1 M sodium chloride solutions. The experimental and calculated data indicate that, in medium to high salinity waters, silica can precipitate at much lower residual concentrations than the theoretical silica solubility limits of 120–130 mg L−1 currently recommended for the RO industry.18,19Practical silica solubility, empirically determined, is a key for prevention of silica scaling in RO desalination systems.3,23,24 What has been done in this study is to better define what this means for RO processes and how salinity affects silica fouling. Dissolved silica contains different dissolved silica species25 such as monomers, dimers, trimers and other polymers of silicic acid in solution.3,17 These dissolved silica species can be present in various ionisation states,1 which depend on the pH of solutions and the silica concentrations. Physico-chemical interactions between dissolved silica species and cations on the RO membrane surface (super-saturation conditions) commonly lead to irreversible silica scale formation and silicate scale deposition on the membrane surface. However, not all highly supersaturated silica streams lead to scaling of membrane surfaces as was shown in this research. Specifically, in sodium–silica systems free of multi-valent cations, sodium ions prevent silica deposition on RO membrane surfaces acting as a barrier between silica (monomeric and polymerised structures) and the membrane surface (Fig. 13). This has also been supported by the silicon-29 NMR (Nuclei Magnetic Resonance) study recently published by Lunevich.3,5
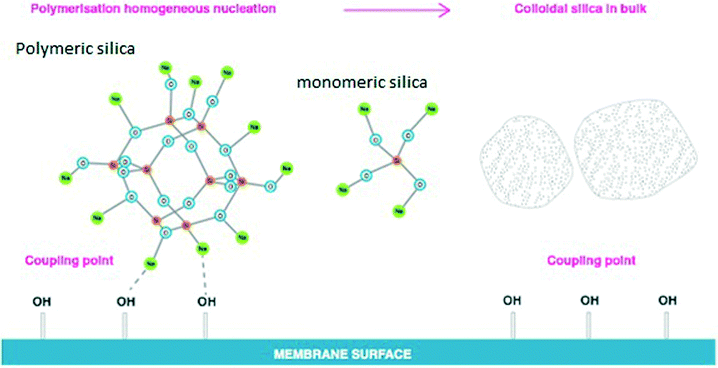 | ||
| Fig. 13 Silica precipitation in medium to high salinity synthetic waters, adopted from the PhD thesis “Silica fouling in coal seam gas water in reverse osmosis desalination”.3 | ||
Fig. 13 illustrates the effect of sodium ions on silica polymerisation under RO supersaturated conditions. In the absence of metal cations such as iron, barium, calcium, magnesium and aluminium, sodium ions tend to create a binding layer surrounding the silica polymeric species, preventing silica deposition on the membrane.7,17 For these layers to stabilise the sol under these conditions, they must extend further than 2 nm.7,21,23,25 It is anticipated that when the sodium chloride concentration increases in accordance with water recovery during RO separation, the increasing concentration of sodium ions leads to further binding of Na+ to the stabilising layer, preventing silica deposition on the RO membrane surface as was found in this work and is illustrated in Fig. 13.
5. Conclusions
The results can be summarised as follows:i. The results obtained in this research show that NaCl at relatively high concentrations (30–65 g L−1) depressed silica solubility limits, leading to silica precipitation at silica residual concentrations of 81–84 mg L−1.
ii. No silica bonding to the membrane surface was found on the membrane surface for the sodium–silica matrix solutions used here in all RO experiments, illustrating that polymerised and precipitated silica remained in the recycled stream.
iii. The maximum and stable residual silica concentration concepts were introduced to highlight deviations in silica solubility and superstaturation conditions for different water matrices. Residual silica concentrations can increase above the silica solubility limit, to form supersaturated solutions, especially for low salinity and high flux conditions where silica concentrations increase rapidly in accordance with the RO concentration factor. The kinetics of precipitation is slow due to the requirements for nucleation to occur and the relatively short time of the desalination experiments.
iv. Silica precipitation occurred at pH 3 conditions in medium and high salinity synthetic waters. The maximum residual silica concentration for medium salinity water was higher at pH 3 than that at pH 9. Overall, little effect of pH (between 3 and 9) was observed on silica fouling trends for the waters considered.
References
- W. Stumm and J. J. Morgan, Aquatic chemistry - Chemical equilibria and rates in natural waters, Wiley-Interscience, New York, 3rd edn, 1996, p. 1022 Search PubMed.
- B. Hamrouni and M. Dhahbi, Analytical aspect of silica in saline waters – application to desalination of brackish waters, Desalination, 2001, 136, 225–232 CrossRef CAS.
- L. Lunevich, Silica fouling in coal seam gas water in reverse osmosis desalination, PhD thesis, Institute for Sustainability and Innovation, Victoria University, Melbourne, Australia, 2015 Search PubMed.
- S. Sjöberg, Silica in aqueous environments, J. Non-Cryst. Solids, 1996, 196, 51–57 CrossRef.
- L. Lunevich, P. Sanciolo, A. Smallridge and S. Gray, Silica scale formation and effect of sodium and aluminium ions – 29Si NMR study, Environ. Sci.: Water Res. Technol., 2016, 2, 174–185 CAS.
- E. Gorrepati, P. Wongthahan, R. Sasanka and H. S. Fogler, Silica Precipitation in Acidic Solutions: Mechanism, pH Effect, and Salt Effect, Department of Chemical Engineering, University of Michigan, American Chemical Society, Langmuir, 2010, 26(13), 10467–10474 CrossRef CAS PubMed.
- T. Healy, Stability of Aqueous Silica Sols, School of Chemistry, The University of Melbourne, Australia, 1994 Search PubMed.
- R. Semiat, I. Sutskover and D. Hasson, Scaling of RO membranes from silica supersaturated solutions, Desalination, 2003, 157, 169–191 CrossRef CAS.
- R. Semiat, I. Sutskover and D. Hasson, Technique for evaluating scaling and its inhibition in RO desalinating, Desalination, 2001, 140, 181–193 CrossRef CAS.
- K. Demadis and A. Stathoulopoulou, Solubility enhancement of silicate with polyamine/polyammonium cationic macromolecules: relevance to silica-laden process waters, Ind. Eng. Chem. Res., 2006, 45 Search PubMed.
- Y. Smolin, Structure of water soluble silicates with complex cations, Institute of Silicate Chemistry of the USSR Academia of Science, Leningrad, 1967 Search PubMed.
- J. Depasse and A. Watillion, The stability of amorphous colloidal silica, J. Colloid Interface Sci., 1970, 33, 430–438 CrossRef.
- M. Dietzel, Depolymerisation von hochpolymerer kieselsaure in waBriger Losung, Dissertation, Universitat Gottingen, Germany, 1993, p. 93 Search PubMed.
- M. Dietzel, Geloste polymere und monomere Kieselsauren und die Wechselwirkung mit Gibbsit und Fe-O-OH-Festphasen. Habilitations - Schrift, Universitat Gottingen, Germany, 1998, p. 93 Search PubMed.
- M. Dietzel, Dissolution of silicates and the stability of polysilicic acid, Geochim. Cosmochim. Acta, 2000, 64(19), 3275–3281 CrossRef CAS.
- M. Dietzel and G. Bohme, Adsorption und Stabilitat von polymerer Kieselsaure, Chem. Erde, 1997, 57, 189–203 CAS.
- L. Lunevich, P. Sanciolo, A. Smallridge and S. Gray, On Silica the Edge: Silica fouling in Reverse Osmosis Desalination, 2nd International Conference in Singapore, 26 – 29 July 2015 Search PubMed.
- AWWA (American Water Works Association), 2001, Reverse Osmosis and Nano-filtration, American Water Works Association, viewed 20 June 2014 Search PubMed.
- ASTM (American Society for Testing and Materials), 1989, Standards Practice for Calculation and Adjustment of Silica (SiO2), Scaling for Reverse Osmosis. ASTM Designation D 4993–89, ASTM, Philadelphia, viewed 23 January 2013 Search PubMed.
- M. Baoxia and M. Elimelech, Silica scaling and scaling reversibility in forward osmosis, Desalination, 2013, 312, 75–81 CrossRef.
- H. Bergna and P. Roberts, Colloidal Silica: Fundamentals and Applications, CRC Press, 2006, vol. 131, p. 128 Search PubMed.
- H. Bergna, The Colloid Chemistry of Silica, American Chemical Society, Washington, DC, 1994 Search PubMed.
- I. Bremere, M. Kennedy, S. Mhyio, A. Jaljuli and S. J. Witkamp, Prevention of silica scale in membrane system: removal of monomeric and polymeric silica, Desalination, 2000, 132, 89–110 CrossRef CAS.
- S. Cob, C. Beaupin, M. Nederlof, D. Harmsen, E. Cornelissen, G. Zwijnenburg and G. Witkamp, Silica and silicate precipitation as limiting factors in high-recovery reverse osmosis operations, J. Membr. Sci., 2012, 423–424, 1–10 Search PubMed.
- R. K. Iler, The chemistry of silica - Solubility, Polymerization, Colloid and Surface Properties, and Biochemistry, Wiley-Interscience, New York, 1976, p. 866 Search PubMed.
| This journal is © The Royal Society of Chemistry 2016 |

