Inhibition effects of tanshinone on the aggregation of α-synuclein
Kaige
Ji†
a,
Yudan
Zhao†
a,
Tianhong
Yu
a,
Zhuoyi
Wang
a,
Hao
Gong
a,
Xin
Yang
a,
Yang
Liu
b and
Kun
Huang
*ac
aTongji School of Pharmacy, Huazhong University of Science and Technology, Wuhan, 430030, China. E-mail: kunhunag2008@hotmail.com
bSynergy Innovation Center of Biological Peptide Antidiabetics of Hubei Province, School of Life Science, Wuchang University of Technology, Wuhan, 430223, China
cCenter for Biomedicine Research, Wuhan Institute of Biotechnology, Wuhan, 430075, China
First published on 25th September 2015
Abstract
Parkinson's disease (PD) is one of the most common neurodegenerative diseases. Lewy bodies that are formed by the aggregated α-synuclein are a major pathological feature of PD. Salvia miltiorrhiza has been used as food and as a traditional medicine for centuries in China, with tanshinone I (TAN I) and tanshinone IIA (TAN IIA) as its major bioactive ingredients. Here, we investigated the effects of TAN I and TAN IIA on α-synuclein aggregation both in vitro and in a transgenic Caenorhabditis elegans PD model (NL5901). We demonstrated that TAN I and TAN IIA inhibited the aggregation of α-synuclein as demonstrated by the prolonged lag time and the reduced thioflavin-T fluorescence intensity; TAN I and TAN IIA also disaggregated preformed mature fibrils in vitro. Moreover, the presence of TAN I or TAN IIA affected the secondary structural transformation of α-synuclein from unstructured coils to β-sheets, and alleviated the membrane disruption caused by aggregated α-synuclein in vitro. Besides, the immuno-dot-blot assay indicated that TAN I and TAN IIA reduce the formation of oligomers and fibrils. We further found that TAN I and TAN IIA extended the life span of NL5901, a strain of transgenic C. elegans that expresses human α-synuclein, possibly by attenuating the aggregation of α-synuclein. Taken together, our results suggested that TAN I and TAN IIA may be explored further as potential candidates for the prevention and treatment of PD.
1. Introduction
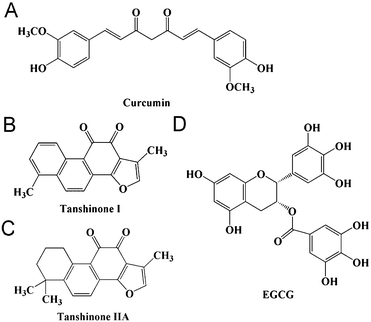
Parkinson's disease (PD) is a major neurodegenerative disease; the morbidity in people over 60 years of age can reach 1%, second only to Alzheimer's disease (AD).1 The main pathological features of PD are apoptosis of dopamine neurons and the formation of intracellular Lewy bodies in substantia nigra,2 which further cause bradykinesia, muscular rigidity, resting tremor and mental abnormality.1,3 Lewy bodies have been found to be composed of deposition of abnormally aggregated α-synuclein.4 Native α-synuclein is an unstructured soluble protein that plays a role in memory, recognition, regulation of dopamine and presynaptic vesicle trafficking.5,6 Under pathological conditions, unfolded α-synuclein forms β-structures, leading to the formation of toxic oligomers, which further aggregate into protofibrils and mature fibrils and cause cell dysfunction.7,8 The discovery of inhibitors that restrain α-synuclein abnormal aggregation has been an important research direction for PD treatment.9Many small molecular inhibitors originating from traditional herbal medicine have been demonstrated to have inhibitory effects on α-synuclein aggregation, such as curcumin, gallic acid and epigallocatechin gallate (Fig. 1A and D).10–12Salvia miltiorrhiza (also known as Danshen) is a medicinal food herb, which was used as a food auxiliary,13 and is widely used in traditional Chinese medicine for cancer, cardiovascular and cerebrovascular diseases.14 TAN I and TAN IIA (Fig. 1B and C) are the main liposoluble phenanthrenequinonic compounds from Salvia miltiorrhiza. We have recently shown that phenanthrenequinone can inhibit insulin aggregation.15 In addition, TAN I and TAN IIA share similar structures with curcumin by having two ketone groups and aromatic groups, which has been reported to inhibit α-synuclein aggregation both in vitro and in a Drosophila PD model.16–18 Recently, there have been reports supporting that TAN IIA can prevent the loss of nigrostriatal dopaminergic neurons based on its anti-oxidative and anti-inflammatory properties in the MPTP model of Parkinson's disease and that TAN I and TAN IIA can inhibit amyloid aggregation of amyloid-β peptide.19,20 All these results suggest that TAN I and TAN IIA may have inhibitory effects on α-synuclein aggregation.
To test this hypothesis, we performed a set of experiments in vitro and in vivo. Our results suggested that TAN I and TAN IIA not only effectively inhibited the toxic aggregation of α-synuclein in vitro, but also extended the life span of a transgenic Caenorhabditis elegans strain NL5901 which expresses human α-synuclein.
2. Materials and methods
2.1. Materials
A plasmid expressing human α-synuclein PT7-7 was obtained from Addgene (Cambridge, MA, USA). Tanshinone I (TAN I, ≥98%), tanshinone IIA (TAN IIA, ≥98%) and (−)-epigallocatechingallate (EGCG, ≥98%) were purchased from Aladdin-Reagent Inc. (Shanghai, China). An anti-amyloid oligomer polyclonal antibody (A11, cat. # AB9234) and an anti-amyloid fibril polyclonal antibody (OC, cat. # AB2286) were obtained from Merck Millipore (Billerica, USA). The goat anti-rabbit IgG–HRP conjugate was from Bio-Rad Laboratories, Inc. (Hercules, USA). Thioflavin-T (ThT), 2-oleoyl-1-palmitoyl-sn-glycerol-3-phospho-rac-(1-glycerol) sodium salt (POPG) and carboxyfluorescein were purchased from Sigma-Aldrich (St. Louis, USA). Transgenic Caenorhabditis elegans strain NL5901 [unc-54p::alphasynuclein::YFP+unc-119(+)] was obtained from the Caenorhabditis Genetics Center (University of Minnesota, Minneapolis, MN). Other chemicals used were of the highest grade available.2.2. Expression and purification of human α-synuclein
Human α-synuclein was expressed in E. coli BL21 (DE3) and induced by 0.7 mM IPTG for 4 h. For each purification batch, 12 L of the induced E. coli was centrifuged at 4 °C (10![[thin space (1/6-em)]](https://www.rsc.org/images/entities/char_2009.gif) 000 rpm, 15 min) and the pellets were resuspended in 200 mL TEN buffer (10 mM Tris-HCl, pH 8.0, 1 mM EDTA, 100 mM NaCl) and boiled for 10 min. Then the solution was centrifuged, followed by addition of 136 μL 10% (w/v) streptomycin sulfate and 222 μL glacial acetic acid per 1 mL supernatant. The solution was then centrifuged, and the supernatant was mixed with the same volume of saturated ammonium sulfate, followed by standing at 4 °C for 30 min. After centrifugation at 4 °C (10
000 rpm, 15 min) and the pellets were resuspended in 200 mL TEN buffer (10 mM Tris-HCl, pH 8.0, 1 mM EDTA, 100 mM NaCl) and boiled for 10 min. Then the solution was centrifuged, followed by addition of 136 μL 10% (w/v) streptomycin sulfate and 222 μL glacial acetic acid per 1 mL supernatant. The solution was then centrifuged, and the supernatant was mixed with the same volume of saturated ammonium sulfate, followed by standing at 4 °C for 30 min. After centrifugation at 4 °C (10![[thin space (1/6-em)]](https://www.rsc.org/images/entities/char_2009.gif) 000 rpm, 15 min), the precipitate was washed with 1
000 rpm, 15 min), the precipitate was washed with 1![[thin space (1/6-em)]](https://www.rsc.org/images/entities/char_2009.gif) :
:![[thin space (1/6-em)]](https://www.rsc.org/images/entities/char_2009.gif) 1 (v/v) saturated ammonium sulfate and H2O and then centrifuged again. The obtained precipitate was then washed with 1
1 (v/v) saturated ammonium sulfate and H2O and then centrifuged again. The obtained precipitate was then washed with 1![[thin space (1/6-em)]](https://www.rsc.org/images/entities/char_2009.gif) :
:![[thin space (1/6-em)]](https://www.rsc.org/images/entities/char_2009.gif) 1 (v/v) 100 mM ammonium acetate and ethanol three times. A Hitachi L-2000 high performance liquid chromatography system (Tokyo, Japan) was then applied with a semi-preparative Apollo C18 column (Grace, USA) to purify the α-synuclein as we have previously described.21 The mobile phases contain 0.1% TFA, with a 10% to 30% acetonitrile gradient for the first 5 min, and then a 30% to 80% gradient in the next 22 min, at a flow rate of 4 mL min−1 and a detection wavelength of 280 nm. The collected peak was lyophilized, and quantified by using a U-2900 UV spectrophotometer (Hitachi, Tokyo, Japan). α-Synuclein expression was verified by SDS-PAGE and Coomassie blue staining. After semi-preparative HPLC purification, 5.42 mg α-synuclein (>95% pure, determined by HPLC) was obtained per 1 L E. coli culture.
1 (v/v) 100 mM ammonium acetate and ethanol three times. A Hitachi L-2000 high performance liquid chromatography system (Tokyo, Japan) was then applied with a semi-preparative Apollo C18 column (Grace, USA) to purify the α-synuclein as we have previously described.21 The mobile phases contain 0.1% TFA, with a 10% to 30% acetonitrile gradient for the first 5 min, and then a 30% to 80% gradient in the next 22 min, at a flow rate of 4 mL min−1 and a detection wavelength of 280 nm. The collected peak was lyophilized, and quantified by using a U-2900 UV spectrophotometer (Hitachi, Tokyo, Japan). α-Synuclein expression was verified by SDS-PAGE and Coomassie blue staining. After semi-preparative HPLC purification, 5.42 mg α-synuclein (>95% pure, determined by HPLC) was obtained per 1 L E. coli culture.
2.3. α-Synuclein aggregation by protein misfolding cyclic amplification
The amyloid formation of α-synuclein was performed with a protein misfolding cyclic amplification (PMCA) approach as previously reported.22,23 Briefly, α-synuclein was dissolved in 50 mM PBS buffer (containing 100 mM NaCl, pH 7.4) to a final concentration of 50 μM. The solution was sonicated for 2 min with a SB25-12DTD sonicator (Scientz Biotechnology, China). TAN I and TAN IIA were freshly dissolved in DMSO to saturation (2.67 and 6.85 mM, respectively, as determined by their UV-absorptions at 270 nm), and EGCG was dissolved in DMSO to 6 mM as stock solutions. 100 μL α-synuclein (50 μM) in the presence or absence of different compounds was incubated in eppendorf tubes at 37 °C with three 1.0 mm zirconia/silica beads (37.9 ± 0.7 mg; Gong Tao Inc., Shanghai, China) inside. Samples were sonicated for 30 s per 1 h with an output power setting at 90%. For α-synuclein aggregation, 35 cycles of PMCA were needed and aliquots were removed at time points of 0 h, 6 h, 11 h, 14 h, 17 h, 20 h, 22 h, 29 h, and 35 h.2.4. Thioflavin-T (ThT) fluorescence assay
During incubation, 3 μL of samples were removed at designated points for the ThT fluorescence assay on a Hitachi FL-2700 fluorometer (Tokyo, Japan) as we have previously reported.24 The assay solution includes 50 mM PBS (containing 100 mM NaCl, pH 7.4) and ThT with a final concentration of 20 μM, with excitation and emission wavelengths set at 450 nm and 482 nm, respectively. Each experiment was repeated at least three times. 1% DMSO was presented in every group (blank control and TAN I, TAN IIA, EGCG treated groups), and the control study suggested that at this concentration, DMSO only showed a minor effect on α-synuclein aggregation (data not shown).2.5. Disaggregation of α-synuclein fibrils
Mature α-synuclein fibrils were prepared (50 μM and 24 h incubation) as described above. Mature fibrils were further incubated at 37 °C for another 9 h in the presence or absence of TAN I, TAN IIA, or EGCG. Aliquots were removed during incubation for the ThT fluorescence assay.25 The experiment was repeated at least three times.2.6. Transmission electron microscopy (TEM)
As we have previously described,26 5 μL of the sample for TEM was dropped onto the center of a 300-mesh formvar-carbon coated copper grid (Shanghai, China) for 5 min, followed by staining with 1% uranyl formate for another 5 min, and air dried followed by analysis under an H-8100 transmission electron microscope (Hitachi, Tokyo, Japan).2.7. Far-UV circular dichroism (CD) and data analysis
Far-UV CD was performed to study the secondary structure. Samples were detected by using a JASCO-810 circular dichroism spectropolarimeter (JASCO, Japan) under continuous N2 flow. The data were recorded from 190 nm to 260 nm with a 2 nm bandwidth and a scanning speed of 50 nm min−1. All results were repeated three times. The spectra of different compounds alone were subtracted from the respective spectra of α-synuclein in the presence of different compounds. The data obtained were converted into the mean residue ellipticity [θ].272.8. Immuno-dot-blot assay
50 μM α-synuclein was incubated in the presence or absence of TAN I, TAN IIA or EGCG as described above. 2 μL of the sample removed at designed intervals were dropped on a nitrocellulose membrane (Bio-Rad, USA) and air dried. Then the membrane was blocked using 5% skimmed milk (Becton Dickinson, NJ, USA) for 2 h at room temperature, and incubated at 4 °C overnight with an A11 or OC antibody (1![[thin space (1/6-em)]](https://www.rsc.org/images/entities/char_2009.gif) :
:![[thin space (1/6-em)]](https://www.rsc.org/images/entities/char_2009.gif) 2500, Millipore, Billerica, USA), which specifically recognizes oligomers and fibrils, respectively.28 After washing with TBST, anti-rabbit IgG (1
2500, Millipore, Billerica, USA), which specifically recognizes oligomers and fibrils, respectively.28 After washing with TBST, anti-rabbit IgG (1![[thin space (1/6-em)]](https://www.rsc.org/images/entities/char_2009.gif) :
:![[thin space (1/6-em)]](https://www.rsc.org/images/entities/char_2009.gif) 5000) was added and incubated for 2 h at room temperature. The membrane was washed again, and developed with an ECL chemiluminescence kit (Millipore, Billerica, USA) for further analysis.15 Densitometry analysis was performed using the software Quantity One 4.6.2 (Bio-Rad, Hercules, USA).
5000) was added and incubated for 2 h at room temperature. The membrane was washed again, and developed with an ECL chemiluminescence kit (Millipore, Billerica, USA) for further analysis.15 Densitometry analysis was performed using the software Quantity One 4.6.2 (Bio-Rad, Hercules, USA).
2.9. Dye leakage assay
50 μM α-synuclein incubated alone with DMSO or co-incubated for 35 h with TAN I, TAN IIA, or EGCG was prepared as described above. The POPG vesicles were prepared as we have previously described.29 Briefly, 20 mg 1-palmitoyl-2-oleoyl-sn-glycero-3-phospho-(1′-rac-glycerol) (POPG) was dissolved in 1 mL CHCl3, dried with nitrogen into a lipid film and lyophilized overnight. 15 mg carboxyfluorescein dissolved in 1 mL 50 mM PBS buffer (containing 100 mM NaCl, pH 7.4) was added into POPG to form POPG vesicles, and then purified with a PD-10 column (Sangon Biotech., Shanghai). The obtained POPG vesicles were diluted with 50 mM PBS buffer (containing 100 mM NaCl, pH 7.4), and then the samples were added to a final concentration of 5 μM α-synuclein for fluorescence measurements. The excitation and emission were set at 493 nm and 518 nm, separately. The scanning time for each sample was 60 s and the mean value of fluorescence intensity during 60 s is shown. POPG vesicles treated with 0.2% (v/v) Triton X-100 were used as the control of complete leakage, while POPG vesicles alone were used as the blank control.302.10. Analysis of C. elegans NL5901 life span
TAN I, TAN IIA and EGCG were diluted in DMSO to 30 mM (supersaturated solution) as stock solutions. 100 μL OP50 containing 1% (v/v) DMSO or the respective compound stock solution was added onto nematode growth medium (NGM) spread in a 35 mm dish. Transgenic C. elegans NL5901 (expressing a fusion of α-synuclein with yellow fluorescence protein, YFP) was synchronized with a bleach buffer (1 M NaOH, 1.2 M NaClO) for three minutes with gentle shaking.31 After three days, L3 larvae were washed with M9 buffer (22 mM KH2PO4, 42.3 mM Na2HPO4, 85.5 mM NaCl, 1 mM MgSO4) and centrifuged (3.2 × 10³ rpm), and then transferred onto NGM. Each group (blank control and TAN I, TAN IIA, EGCG treated groups) contains 100 larvae in five plates and incubated at 20 °C. The C. elegans were transferred onto newly treated NGM plates every two or three days; at the same time, the number of C. elegans was counted under a ZSA 302 digital stereo microscope (COOC, Chongqing, China) and analyzed by using the software GraphPad Prism.2.11. Analysis of α-synuclein expression in C. elegans
99 μL suspension of OP50 E. coli together with 1 μL DMSO or stock solution of the compound per well was added into 96-well plates. Twenty synchronized L3 larvae per well were added into 96-well plates, and incubated at 20 °C for three days. Nematodes were then washed with M9 buffer, dropped onto slides and fixed with 25% (v/v) glycerin, and then followed by covered with coverslips for image analysis using an Olympus IX71 inverted fluorescence microscope (Tokyo, Japan).32,332.12. Dot-blot assay of protein extracted from C. elegans
Synchronized L3 C. elegans were transferred into E. coli OP50 in 96-well plates, which contained 1% (v/v) DMSO or the compound stock solution, at a density of about 20 larvae per well. After three days incubation at 20 °C, C. elegans were washed three times with M9 buffer and centrifuged. Then lysis buffer (50 mM Tris-HCl, 2 mM EDTA, 100 mM NaCl, 0.5% (v/v) Triton X-100, pH 8.5) was added and sonicated. The obtained solutions were quantified by using a BCA Protein Assay kit (Beyotime Biotechnology, Shanghai, China), and equal amounts of protein were blotted onto a nitrocellulose membrane for the dot-blot assay as described above. Because the number of C. elegans needed for successful immuno-dot-blot detection was large, we had to pool five parallel experimental groups (100 worms) to obtain enough amount of sample for C. elegans immuno-dot-blot analysis, and thus the results represent the average intensity.2.13. Statistical analysis
All data (except for the analysis of C. elegans life span) were shown as means ± SD and analyzed by the nonparametric Kruskal–Wallis test and the Mann–Whitney test. p < 0.05 was considered statistically significant.3. Results
3.1. TAN I and TAN IIA inhibit the amyloid formation of α-synuclein and depolymerize preformed α-synuclein fibrils
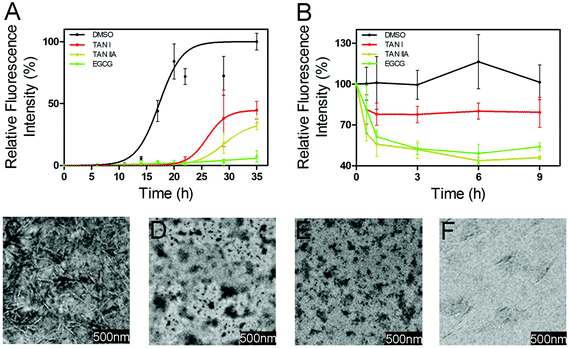
To study the effects of TAN I and TAN IIA on the amyloid formation of α-synuclein, a ThT fluorescence assay was performed. In a control study, we found that DMSO (1% v/v), TAN I, TAN IIA and EGCG alone showed no interference on the blank ThT fluorescence intensity (data not shown). α-Synuclein (50 μM) showed a short lag time of 13.2 ± 2.9 h (Fig. 2A and Table 1). In the presence of 26.7 μM TAN I (1% of saturated TAN I stock solution), the lag time was prolonged to 24.4 ± 3.3 h (p < 0.05, Fig. 2A and Table 1) with the relative intensity reduced to 48.0 ± 2.6% of that of α-synuclein (p < 0.01). On the other hand, in the presence of 68.5 μM TAN IIA (1% of saturated TAN IIA solution), a lag time of 25.8 ± 2.6 h (p < 0.01) with a decreased relative fluorescence intensity of 29.0 ± 1.7% of that of control was observed (p < 0.01, Fig. 2A and Table 1). Consistent with a previous report,11 the presence of 60 μM EGCG almost abolished the amyloid formation (Fig. 2A and Table 1). Then we tested these compounds at lower concentrations, and found that in the presence of 25 μM TAN I, TAN IIA or EGCG, the lag time of α-synuclein aggregation was 18.2 ± 0.9, 18.5 ± 1.2 and 22.4 ± 1.0 h, with the relative fluorescence intensity of 64.6 ± 5.9%, 76.8 ± 12.4%, and 65.0 ± 10.1%, respectively (Table 1).| Fibril formationc | Amyloidogenice | |||
|---|---|---|---|---|
| Lag time (h) |
T
50![[thin space (1/6-em)]](https://www.rsc.org/images/entities/char_2009.gif) d (h) d (h) |
Relative intensity (%) | ||
| a Compounds were prepared for stock solutions, and added 1% (v/v) into reaction solutions. b Each assay was repeated at least three times. c All compounds were incubated with 50 μM α-synuclein. d T 50 represents the time for reaching half of maximum intensity. e The relative fluorescence of α-synuclein incubated with DMSO alone was recorded as 100%. The degree of aggregation is shown as follows: “+++” stands for the relative fluorescence above 75%, “++”stands for the relative fluorescence between 50% and 75%, “+” stands for the relative fluorescence above 10% and below 50%, and “−” mean that the relative fluorescence was below 10%. f “N” represents the lag time and T50 are too long for calculation. | ||||
| DMSO | 13.2 ± 2.9 | 18.2 ± 0.6 | 100.0 ± 6.8 | +++ |
| TAN I (25 μM) | 18.2 ± 0.9 | 20.1 ± 0.6 | 64.6 ± 5.9 | ++ |
| TAN I (26.7 μM) | 24.4 ± 3.3 | 26.7 ± 2.9 | 48.0 ± 2.6 | + |
| TAN IIA (25 μM) | 18.5 ± 1.2 | 21.8 ± 1.5 | 76.8 ± 12.4 | +++ |
| TAN IIA (68.5 μM) | 25.8 ± 2.6 | 29.0 ± 1.7 | 33.1 ± 6.6 | + |
| EGCG (25 μM) | 22.4 ± 1.0 | 23.9 ± 1.2 | 65.0 ± 10.1 | + |
| EGCG (60 μM) | Nf | N | 7.1 ± 4.7 | − |
TEM was performed to study the morphology of α-synuclein incubated in the presence or absence of TAN I, TAN IIA or EGCG. Consistent with previous reports,34 the TEM image of α-synuclein incubated alone showed extensive mature fibrils. In contrast, the TEM images of α-synuclein co-incubated with TAN I, TAN IIA or EGCG showed no obvious fibrils, which is consistent with the ThT fluorescence results (Fig. 2A and C–F).35
We further tested whether TAN I and TAN IIA can depolymerize preformed α-synuclein fibrils. In the presence of TAN I, TAN IIA or EGCG, after 6 h incubation, the relative fluorescence intensities decreased by 19.9%, 56.2%, and 50.9%, respectively (Fig. 2B).
3.2. TAN I and TAN IIA delay the secondary structural transition of α-synuclein
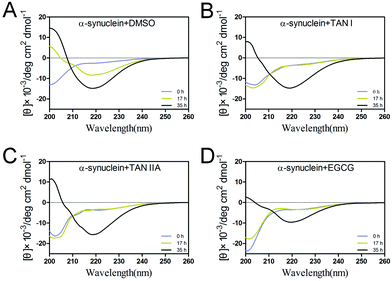
To study the secondary structural transition of α-synuclein during incubation, far-UV circular dichroism was performed. At the beginning of incubation, the spectrum of α-synuclein showed characteristics of random coil, as manifested by the negative peak at 205 nm (Fig. 3). After 17 h incubation, the control group showed a significant increase at 200 nm and the formation of a negative peak at 215–220 nm, suggesting conversion from random coils to α-helices and β-sheets, respectively (Fig. 3A). In the presence of TAN I, TAN IIA or EGCG, the native-like structure remained in random coil at 17 h, whereas notable β-sheet structures were observed at 35 h in all sample groups (Fig. 3B and C).353.3. TAN I and TAN IIA alleviate the oligomerization and fibrillation of α-synuclein
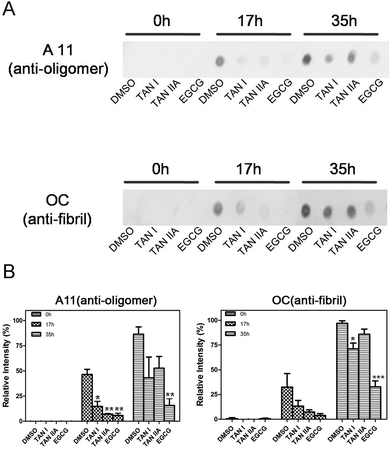
The contents of oligomers and fibrils at different incubation points were assessed by immuno-dot-blot and densitometry analysis. All groups showed no oligomers or fibrils at 0 h, which is consistent with the results of ThT fluorescence and CD assays (Fig. 4A). A11- and OC-positive blots were visible in α-synuclein incubated for 17 h, suggesting the emergence of oligomers and fibrils, while TAN I, TAN IIA and EGCG treated groups showed no such positive blots, which is complementarily proven by densitometry analysis (Fig. 4B). Although there were oligomers and fibrils observed in experimental groups after 35 h incubation, the blots of treated groups were obviously lighter compared with the control, especially for the EGCG group (Fig. 4A).3.4. TAN I and TAN IIA attenuate α-synuclein amyloid formation induced membrane damage
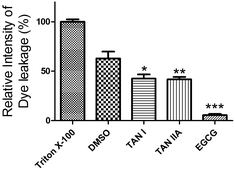
We next studied the effects of TAN I and TAN IIA on membrane damage induced by aggregated α-synuclein. POPG vesicles were damaged by 62.9 ± 6.9% (p < 0.05) when treated with pre-incubated α-synuclein, compared to Triton X-100, which was set as 100% (Fig. 5). However, when treated with α-synuclein co-incubated with TAN I or TAN IIA, the damage was decreased to 42.6 ± 4.2% (p < 0.05) and 41.8 ± 2.3% (p < 0.05), respectively, whereas the control EGCG group almost completely inhibited membrane damage (Fig. 5). In a control study, we found that TAN I, TAN IIA or EGCG alone in the concentrations we tested showed no damage to the membrane (data not shown).3.5. TAN I and TAN IIA extend the life span of C. elegans
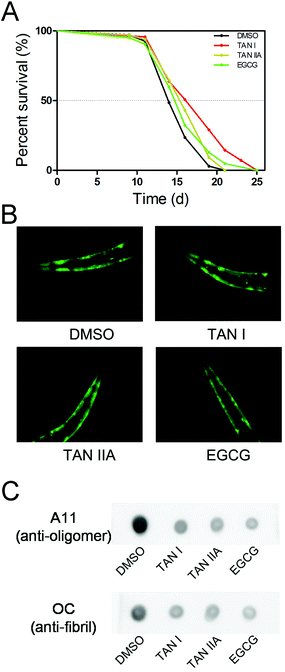
The effects of TAN I and TAN IIA on the life span of transgenic C. elegans (NL5901, α-synuclein co-expressed with YFP) were measured with EGCG as a positive control. The T50 (time for percent survival reaching 50%) of C. elegans NL5901 treated with DMSO was 14.0 d, while the T50 of TAN I, TAN IIA and EGCG treated NL5901 were 16.2 d, 15.5 d and 14.9 d, respectively (Fig. 6A).3.6. TAN I and TAN IIA reduce the aggregation of α-synuclein in a C. elegans NL5901
The apparent intensities of fluorescence were similar among groups of untreated and treated C. elegans, indicating similar expression levels of α-synuclein (Fig. 6B). We then detected the degree of α-synuclein aggregation with an immuno-dot-blot. For the group treated with DMSO, it exhibited strong A11- and OC-positive dots (oligomers and fibrils, respectively); when treated with TAN I, TAN IIA or EGCG, the amounts of both oligomers and fibrils were reduced significantly; interestingly, no detectable differences were observed between TAN I, TAN IIA and EGCG treatments (Fig. 6C).4. Discussion
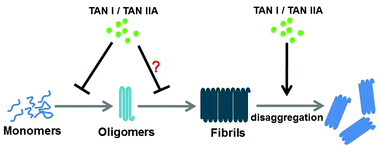
Dopamine apoptosis and α-synuclein aggregation both exist in patients undergoing PD.36 Under pathological conditions, the native non-toxic α-synuclein turned into toxic aggregated α-synuclein, and induced a series of cytotoxicity.37Here, we found that TAN I and TAN IIA not only inhibited the aggregation of α-synuclein by significantly prolonging the lag time of α-synuclein aggregation, with an obvious decrease in the fluorescence intensity, which was further morphologically confirmed by TEM (Fig. 2A and C–F), but also disaggregated the preformed α-synuclein fibrils (Fig. 2B). We further found that TAN I and TAN IIA delayed the secondary structural change to β-sheets and reduced oligomerization, which was demonstrated by CD and the immuno-dot-blot assay, respectively (Fig. 3 and 4). Aggregated α-synuclein, especially oligomers, has been reported to interact with the cell membrane and lead to membrane depolarization, intracellular oxidative stress and even cell apoptosis.7,38 Dye leakage assay results suggested that TAN I and TAN IIA could protect POPG vesicles from the damage caused by α-synuclein aggregation (Fig. 5), so they may have a protective effect on the cell membrane against α-synuclein aggregation. TAN I and TAN IIA treatment prolonged the transgenic C. elegans NL5901 life span by reducing the aggregation of α-synuclein without affecting its expression level (Fig. 6). Although EGCG showed higher efficacy in inhibiting α-synuclein aggregation than TAN I and TAN IIA in vitro, no obvious difference in life span and immuno-dot-blot assays was observed in transgenic C. elegans NL5901, suggesting that TAN I, TAN IIA and EGCG may have comparable effects on amyloid aggregation in vivo. The possible mechanism of TAN I and TAN IIA in inhibiting α-synuclein aggregation may be similar to their effects on Aβ,19 which may involve binding to α-synuclein monomers and oligomers via hydrophobic interaction with β-structures, which leads to delay of the nucleation process and further assembly of oligomers (Fig. 7).
TAN I and TAN IIA have been reported to have neuroprotective effects in a rat model, based on their anti-oxidative and anti-inflammatory properties,20,39 which are closely associated with PD.40,41 Moreover, water-soluble sodium TAN IIA sulfonate derived from TAN IIA has been used in the clinic for unstable angina.42,43 TAN I and TAN IIA are liposoluble compounds, so their molar ratios for the assays performed in aqueous solution here are limited. It has been reported that the concentration of α-synuclein in cerebrospinal fluid of normal people and PD falls in the range of 2.7–2.9 × 10⁻⁵ μM,44 which is orders lower than that used in this study (50 μM), whereas the concentration of TAN IIA could reach 10−1 μM in plasma and 10−4 μmol μg−1 in brain at 6 h after intravenous injection in rat.45 Furthermore, advanced delivery measures such as lipid nanoparticles or PEGylated nanoparticles can also be used to increase their effective concentrations in brain, which have been proven to prolong circulation of TAN IIA and increase its accumulation in brain;45,46 for example, a study performed on Sprague-Dawley rats showed that the concentration of TAN IIA loaded PEGylated nanoparticles in brain was ca. threefold that of free TAN IIA at 6 h after intravenous administration.46
In summary, our results suggest the potential of TAN I and TAN IIA as anti-PD candidates; however, their exact working mechanism still awaits further investigation.
Conflict of interest
The authors declare no conflict of interest associated with this work.Abbreviations
| PD | Parkinson's disease |
| TAN I | Tanshinone I |
| TAN IIA | Tanshinone IIA |
| EGCG | (−)-Epigallocatechingallate |
| AD | Alzheimer's disease |
| ThT | Thioflavin-T |
| CD | Circular dichroism |
| TEM | Transmission electron microscopy |
| POPG | 2-Oleoyl-1-palmitoyl-sn-glycerol-3-phospho-rac-(1-glycerol) sodium salt |
| HPLC | High performance liquid chromatography |
Acknowledgements
This work was supported by the Natural Science Foundation of China (no. 81172971, 81222043 and 31471208), the Municipal Key Technology Program of Wuhan (Wuhan Bureau of Science & Technology, no. 201260523174) and the Natural Science Foundation of Hubei Province (2014CF021).References
- M. E. Herva and M. G. Spillantini, Virus Res., 2015, 207, 38–46 CrossRef CAS PubMed.
- P. Jiang, M. Gan, W. L. Lin and S. H. Yen, Front. Aging Neurosci., 2014, 6, 268, DOI:10.3389/fnagi.2014.00268.
- S. C. Drew, Chemistry, 2015, 21, 7111–7118 CrossRef CAS PubMed.
- V. Sanchez-Guajardo, N. Tentillier and M. Romero-Ramos, Neuroscience, 2015, 302, 47–58 CrossRef CAS PubMed.
- A. Recasens and B. Dehay, Front. Neuroanat., 2014, 8, 159, DOI:10.3389/fnana.2014.00159.
- H. E. Allen Reish and D. G. Standaert, J. Parkinson's Dis., 2015, 5, 1–19 CAS.
- M. Andreasen, N. Lorenzen and D. Otzen, Biochim. Biophys. Acta, 2015, 1848, 1897–1907 CrossRef CAS PubMed.
- C. Pain, J. Dumont and M. Dumoulin, Biochimie, 2015, 111, 82–106 CrossRef CAS PubMed.
- H. Cheruvara, V. L. Allen-Baume, N. M. Kad and J. M. Mason, J. Biol. Chem., 2015, 290, 7426–7435 CrossRef CAS PubMed.
- M. T. Ardah, K. E. Paleologou, G. Lv, S. B. Abul Khair, A. S. Kazim, S. T. Minhas, T. H. Al-Tel, A. A. Al-Hayani, M. E. Haque, D. Eliezer and O. M. El-Agnaf, Front. Aging Neurosci., 2014, 6, 197, DOI:10.3389/fnagi.2014.00197.
- X. Meng, L. A. Munishkina, A. L. Fink and V. N. Uversky, J. Parkinson's Dis., 2010, 2010, 650794, DOI:10.4061/2010/650794.
- J. Bieschke, J. Russ, R. P. Friedrich, D. E. Ehrnhoefer, H. Wobst, K. Neugebauer and E. E. Wanker, Proc. Natl. Acad. Sci. U. S. A., 2010, 107, 7710–7715 CrossRef CAS PubMed.
- Y. Wang, H. Peng, Y. Shen, R. Zhao and L. Huang, Microsc. Res. Tech., 2013, 76, 947–954 CrossRef CAS PubMed.
- L. Zhou, Z. Zuo and M. S. Chow, J. Clin. Pharmacol., 2005, 45, 1345–1359 CrossRef CAS PubMed.
- H. Gong, Z. He, A. Peng, X. Zhang, B. Cheng, Y. Sun, L. Zheng and K. Huang, Sci. Rep., 2014, 4, 5648, DOI:10.1038/srep05648.
- T. Masuda, T. Maekawa, K. Hidaka, H. Bando, Y. Takeda and H. Yamaguchi, J. Agric. Food Chem., 2001, 49, 2539–2547 CrossRef CAS PubMed.
- H. F. Ji and L. Shen, CNS Neurol. Disord.: Drug Targets, 2014, 13, 369–373 CAS.
- Y. H. Siddique, F. Naz and S. Jyoti, Biomed. Res. Int., 2014, 2014, 606928, DOI:10.1155/2014/606928.
- Q. Wang, X. Yu, K. Patal, R. Hu, S. Chuang, G. Zhang and J. Zheng, ACS Chem. Neurosci., 2013, 4, 1004–1015 CrossRef CAS PubMed.
- B. Ren, Y. X. Zhang, H. X. Zhou, F. W. Sun, Z. F. Zhang, Z. Wei, C. Y. Zhang and D. W. Si, J. Neurol. Sci., 2015, 348, 142–152 CrossRef CAS PubMed.
- L. Huang, X. Yang, A. Peng, H. Wang, X. Lei, L. Zheng and K. Huang, Food Funct., 2015, 6, 584–589 CAS.
- G. P. Saborio, B. Permanne and C. Soto, Nature, 2001, 411, 810–813 CrossRef CAS PubMed.
- C. Guo, L. Ma, Y. Zhao, A. Peng, B. Cheng, Q. Zhou, L. Zheng and K. Huang, Sci. Rep., 2015, 5, 13556 CrossRef PubMed.
- B. Cheng, X. Liu, H. Gong, L. Huang, H. Chen, X. Zhang, C. Li, M. Yang, B. Ma, L. Jiao, L. Zheng and K. Huang, J. Agric. Food Chem., 2011, 59, 13147–13155 CrossRef CAS PubMed.
- B. Cheng, H. Gong, X. Li, Y. Sun, X. Zhang, H. Chen, X. Liu, L. Zheng and K. Huang, Biochem. Biophys. Res. Commun., 2012, 419, 495–499 CrossRef CAS PubMed.
- H. Gong, X. Zhang, B. Cheng, Y. Sun, C. Li, T. Li, L. Zheng and K. Huang, PLoS One, 2013, 8, e54198 CAS.
- X. Zhang, B. Cheng, H. Gong, C. Li, H. Chen, L. Zheng and K. Huang, FEBS Lett., 2011, 585, 71–77 CrossRef CAS PubMed.
- R. Kayed, E. Head, F. Sarsoza, T. Saing, C. W. Cotman, M. Necula, L. Margol, J. Wu, L. Breydo, J. L. Thompson, S. Rasool, T. Gurlo, P. Butler and C. G. Glabe, Mol. Neurodegener., 2007, 2, 18 CrossRef PubMed.
- B. Cheng, H. Gong, X. Li, Y. Sun, H. Chen, X. Zhang, Q. Wu, L. Zheng and K. Huang, Proteins, 2013, 81, 613–621 CrossRef CAS PubMed.
- L. Jiao, X. Zhang, L. Huang, H. Gong, B. Cheng, Y. Sun, Y. Li, Q. Liu, L. Zheng and K. Huang, Food Chem. Toxicol., 2013, 56, 398–405 CrossRef CAS PubMed.
- D. J. Deusing, S. Winter, A. Kler, E. Kriesl, B. Bonnlander, U. Wenzel and E. Fitzenberger, Fitoterapia, 2015, 102, 163–170 CrossRef CAS PubMed.
- C. Voisine, H. Varma, N. Walker, E. A. Bates, B. R. Stockwell and A. C. Hart, PLoS One, 2007, 2, e504 Search PubMed.
- R. H. Fu, Y. C. Wang, C. S. Chen, R. T. Tsai, S. P. Liu, W. L. Chang, H. L. Lin, C. H. Lu, J. R. Wei, Z. W. Wang, W. C. Shyu and S. Z. Lin, Neuropharmacology, 2014, 82, 108–120 CrossRef CAS PubMed.
- T. Abeywardana and M. R. Pratt, Biochemistry, 2015, 54, 959–961 CrossRef CAS PubMed.
- D. E. Ehrnhoefer, J. Bieschke, A. Boeddrich, M. Herbst, L. Masino, R. Lurz, S. Engemann, A. Pastore and E. E. Wanker, Nat. Struct. Mol. Biol., 2008, 15, 558–566 CAS.
- M. Shah, J. Seibyl, A. Cartier, R. Bhatt and A. M. Catafau, J. Nucl. Med., 2014, 55, 1397–1400 CrossRef CAS PubMed.
- P. Z. Jiang, M. Gan and S. H. C. Yen, Front. Cell. Neurosci., 2013, 7, DOI:10.3389/fncel.2013.00081.
- S. Azeredo da Silveira, B. L. Schneider, C. Cifuentes-Diaz, D. Sage, T. Abbas-Terki, T. Iwatsubo, M. Unser and P. Aebischer, Hum. Mol. Genet., 2009, 18, 872–887 CAS.
- J. H. Park, O. Park, J. H. Cho, B. H. Chen, I. H. Kim, J. H. Ahn, J. C. Lee, B. C. Yan, K. Y. Yoo, C. H. Lee, I. K. Hwang, S. H. Kwon, Y. L. Lee, M. H. Won and J. H. Choi, Neurochem. Res., 2014, 39, 1300–1312 CrossRef CAS PubMed.
- B. Macchi, D. R. Paola, F. Marino-Merlo, M. R. Felice, S. Cuzzocrea and A. Mastino, CNS Neurol. Disord.: Drug Targets, 2015, 14, 313–324 CAS.
- D. Kim, J. H. Paik, D. W. Shin, H. S. Kim, C. S. Park and J. H. Kang, Exp. Neurobiol., 2014, 23, 352–364 CrossRef PubMed.
- S. E. Chan, H. W. Lai, C. C. Su, S. J. Kuo, S. Y. Chien, H. Y. Lin and D. R. Chen, J. Evidence-Based Complementary Altern. Med., 2011, 2011, 841564, DOI:10.1155/2011/841564.
- X. Qiu, A. Miles, X. Jiang, X. Sun and N. Yang, J. Evidence-Based Complementary Altern. Med., 2012, 2012, 715790, DOI:10.1155/2012/715790.
- A. Ohrfelt, P. Grognet, N. Andreasen, A. Wallin, E. Vanmechelen, K. Blennow and H. Zetterberg, Neurosci. Lett., 2009, 450, 332–335 CrossRef PubMed.
- X. Liu, C. An, P. Jin and L. Wang, Biomaterials, 2013, 34, 817–830 CrossRef CAS PubMed.
- J. Liu, J. Zhu, Z. Du and B. Qin, Drug Dev. Ind. Pharm., 2005, 31, 551–556 CrossRef CAS PubMed.
Footnote |
| † These authors contributed equally to this work. |
| This journal is © The Royal Society of Chemistry 2016 |

