Purple carrot anthocyanins suppress lipopolysaccharide-induced inflammation in the co-culture of intestinal Caco-2 and macrophage RAW264.7 cells
Anna
Olejnik
*a,
Katarzyna
Kowalska
a,
Marcin
Kidoń
b,
Janusz
Czapski
b,
Joanna
Rychlik
a,
Mariola
Olkowicz
a and
Radosław
Dembczyński
a
aDepartment of Biotechnology and Food Microbiology, Poznań University of Life Sciences, Wojska Polskiego 48, 60-627 Poznań, Poland. E-mail: aolejnik@up.poznan.pl; kaskakow@up.poznan.pl; joanna.rychlik@up.poznan.pl; mariola.olkowicz@up.poznan.pl; rdembcz@up.poznan.pl; Fax: +48 61 8466003; Tel: +48 61 8466008
bInstitute of Food Technology of Plant Origin, Poznań University of Life Sciences, Wojska Polskiego 31, Poznan 60-624, Poland. E-mail: kidon@up.poznan.pl; czapski@up.poznan.pl
First published on 18th November 2015
Abstract
This study was designed to evaluate the anti-inflammatory effects of purple carrot anthocyanins (PCA) with respect to gut inflammation, simulated in a co-culture system consisting of intestinal epithelial Caco-2 cells and RAW264.7 macrophages. The obtained results indicated that PCA extract down-regulates the mRNA expression of proinflammatory interleukins Il-1β (↓91%) and Il-6 (↓69%) as well as inflammatory mediators, such as cyclooxygenase-2 (Cox-2) and inducible nitric oxide synthase (iNos), in lipopolysaccharide-activated RAW264.7 cells. The decrease in the generation of prostaglandin E2 (↓48%) and nitric oxide (↓26%) was observed as a result of the inhibition of Cox-2 (↓25%) and iNos (↓12%) mRNA expressions, respectively. Moreover, the PCA reduced mRNA expression (↓40%) and production (↓17%) of IL-8 in intestinal cells. The anti-inflammatory effect of PCA was contributed to the protection of the intestinal barrier, which was disrupted upon the stimulation of macrophages. These findings may provide preliminary justification for the use of PCA in further studies focused on the prevention and therapy supporting the conventional treatment of inflammatory bowel diseases.
Introduction
The inflammatory bowel diseases (IBD), primarily including Crohn's disease and ulcerative colitis, are chronic recurrent inflammatory disorders of the gastrointestinal tract, which are pathologically characterized by intestinal inflammation and epithelial injury.1 The inflamed tissue has been reported to be infiltrated by neutrophils and T cells in lesions accompanied by epithelial cell necrosis and ulceration. A defect in the epithelial barrier and altered mucus production leads to an increase in intestinal permeability and excessive exposure of the mucosal immune system to the external luminal content, and results in excessive production of proinflammatory cytokines.1Recently, much attention has been focused on functional nutrition therapy, involving the use of nutrients to support and enhance metabolic pathways and reduce or reverse inflammation. The scientific community has recognized the importance of the use of dietary bioactive compounds with proven anti-inflammatory potential in the treatment and prevention of IBD.2 The experiments presented in this study were focused on the use of purple carrot (PC) as a valuable source of anthocyanins, which are distinguished for their role in health promotion and prevention of civilization-related diseases, as well as those associated with inflammation.3,4
It has been suggested that PC polyphenol compounds, including anthocyanins, which are able to survive upper gastrointestinal tract digestion and reach the colon (e.g. by being bound to plant material) may be important for maintaining good intestinal health.5,6 The PC anthocyanin-rich extract has been found to modulate the level of reactive oxygen species (ROS) in the gastrointestinal tract as well as protect colonic mucosal cells against the adverse effects of oxidative stress.6 Considering that enhanced ROS generation is crucial for the initiation and progression of many inflammatory disorders,7 the PC anthocyanin extract, which has the ability to reduce oxidative stress in the intestinal epithelial cells,6 could contribute to the suppression of proinflammatory pathways and control gut inflammation.
The purple carrot anthocyanins (PCA) have effectively reversed inflammation and metabolic alterations in animal models, through the potential inhibition of inflammatory pathways. The anti-inflammatory capacity of PCA has been associated with the inhibition of cytokines, the cyclooxygenase-2 (Cox-2) inflammatory pathway in a mouse model of asthma and the metabolic syndrome in an obese rat model.8,9 The in vitro studies of RAW264.7 macrophages and porcine aortic endothelial cells have demonstrated that PC polyacetylenes down-regulate the expression of inducible nitric oxide synthase (iNos), interleukin-6 (Il-6) and 1β (Il-1β), and tumor necrosis factor-α (TNF-α).10 However, an anti-inflammatory effect of dried PC on inflammatory markers in overweight and obese adults has not been observed after 4 weeks of treatment.11
The health-promoting effects of bioactive PC compounds are highly dependent on their bioavailability. These effects are especially notable in the case of anthocyanins, which have been defined to be poorly absorbed through gastric mucosa as well as intestinal epithelium. In addition, approximately 76% of the total anthocyanins in the PC roots are acylated and less bioavailable than the non-acylated anthocyanins, therefore the concentration of the non-acylated anthocyanins in human plasma may be 4-times higher.12 Due to this reason, the permeability of PCA across the intestinal epithelial Caco-2 cell monolayer was estimated at the first stage of experiments presented in this study.
In order to determine the anti-inflammatory potential of PCA, the co-culture model constructed with Caco-2 monolayers (mimicking the intestinal barrier) and lipopolysaccharide-stimulated RAW264.7 macrophages was used to imitate gut inflammation. The mRNA expression of cytokines and mediators as well as production of inflammatory markers typical for IBD was investigated upon activation of the macrophages with the PCA anti-inflammatory protection.
Materials and methods
Preparation of the anthocyanin extract
Purple carrot roots (Daucus carota ssp. sativus var. atrorubens Alef.) Deep Purple cv. were obtained from Bejo Zaden Poland (Ożarów Mazowiecki, Poland). The roots were washed, peeled, sliced, blanched, ground and pressed to obtain the juice. The juice was centrifuged (10![[thin space (1/6-em)]](https://www.rsc.org/images/entities/char_2009.gif) 000g, 10 min) and purified using Sep-Pak C18 cartridges (Waters Corp., Milford, MA, USA) according to the procedure described by Rodriguez-Saona and Wrolstad.13 The anthocyanin fraction was collected and evaporated to dryness under reduced pressure. The purity of the obtained PCA preparation exceeded 93%.
000g, 10 min) and purified using Sep-Pak C18 cartridges (Waters Corp., Milford, MA, USA) according to the procedure described by Rodriguez-Saona and Wrolstad.13 The anthocyanin fraction was collected and evaporated to dryness under reduced pressure. The purity of the obtained PCA preparation exceeded 93%.
Prior to the experiment, it was re-dissolved in the medium appropriate for transport or anti-inflammatory studies.
HPLC-DAD coupled with ESI/MS analysis
Analyses of PC anthocyanins were performed using an Agilent 1200 series HPLC system (Agilent Technologies, Inc., Santa Clara, CA, USA) comprising a G1312A binary pump, a G1329 autosampler, a G1316A thermostat column and a G1315D photodiode array detector followed by a time of flight mass spectrometer with an electrospray interface. The LC system consisted of a G1312A binary pump, a G1329 autosampler, a G1316A temperature-controlled column compartment and a G1315D photodiode array detector, coupled with an Agilent 6224 time-of-flight MS system with an electrospray ionization (ESI) interface. Both systems were controlled by MassHunter 2.0 software (Agilent Technologies, Inc.). Chromatographic separations were carried out on a 250 mm × 4.6 mm, 5 μm SunFire (Waters Corp.) C18 column. The mobile phase consisted of two solvents: 10% (v/v) formic acid in water (A) and 10% formic acid (v/v) in methanol (B). A gradient elution program was performed as follows: 13–16% B, 0–14 min; 16–18% B, 14–30 min; 18% B, 30–40 min. The flow rate was 1.0 mL min−1 and the injection volume was 20 μL. Monitoring of the anthocyanin compounds was performed at 520 nm, their quantification was based on standard cyanidin-3-O-glucoside (LGC Standards, Teddington, UK). The mass spectrometer was operated with an ESI interface in positive ion mode. Major mass spectrometer parameters were as follows: capillary voltage −4 kV, scan acquisition – from 50 to 1700 m/z, fragmentor voltage −214 V, pressure of the nebulizing gas −20 psi, flow rate and temperature of the desolvation gas: 11 L min−1 and 325 °C, respectively. Identities of the compounds were obtained by matching their molecular ions m/z values with literature data.14Cell cultures
Caco-2 and RAW264.7 cell lines were obtained from the European Collection of Cell Cultures and supplied by Sigma-Aldrich (Steinheim, Germany). They were cultured at 37 °C under a 5% CO2 atmosphere using Dulbecco's Modified Eagle's Medium (DMEM; Sigma-Aldrich), supplemented with 10% (v/v) fetal bovine serum (Gibco, Grand Island, NE, USA), 10 mL L−1 of non-essential amino acids (Sigma-Aldrich) and 50 mg L−1 of gentamycin (Gibco). For experiments, the RAW264.7 cells were seeded at a density of 5 × 10⁵ cells per cm2 onto 24-well plates, while the Caco-2 cells were plated at a density of 4.4 × 10⁵ cells per cm2 on polycarbonate membranes (Millicell™ Culture Plate Inserts, 12 mm diameter) with a pore size of 0.4 μm (Millipore; Merck KGaA, Darmstadt, Germany). The growth medium of Caco-2 cultures was replaced every 2–3 days. All experiments were performed on differentiated Caco-2 cell monolayers, 21 days post-seeding. In order to check the integrity of the Caco-2 monolayer, transepithelial electrical resistance (TEER) was measured by employing the Millicell Electrical Resistance System (Millipore, Merck KGaA). Only monolayers with TEER values beyond 800 Ω cm2 were used in the experiments. Moreover, fluorescein-5-(and-6)-sulfonic acid (Life Technologies, Carlsbad, CA, USA) was used as a transport marker and was added to the apical side of the Caco-2 cultures at a concentration of 200 μg mL−1. Fluoresceinated sulfonic acid, with a molecular weight of 478 Da, is a hydrophilic, charged molecule at physiological pH and, accordingly, is considered to be cell impermeable.15 The samples taken from the basolateral side of the Caco-2 cultures were analysed in 96-well plates using a Tecan M200 Infinite microplate reader, at 495/538 nm (Tecan Group Ltd, Männedorf, Switzerland).Lactate dehydrogenase cytotoxicity assay
In order to detect the cytotoxic effect of the PCA extract, LPS and budesonide on the RAW264.7 and Caco-2 cells under experimental conditions, the release of lactate dehydrogenase (LDH) was determined using the CytoTox-One™ Homogeneous Membrane Integrity Assay, according to the manufacturer's protocol (Promega GmbH, Mannheim, Germany).Transepithelial transport experiment
The PCA extract at a concentration of 486 μg mL−1 was prepared in transport medium (Hank's balanced salt solution – HBSS, Sigma-Aldrich). Prior to the experiments, the Caco-2 monolayers were washed twice with HBSS and pre-incubated at 37 °C for 30 min. Transport was initiated by adding HBSS to the acceptor side (basolateral side) and the solution of PCA to the donor side (apical side). The Caco-2 cell cultures were placed in the incubator (37 °C) and agitated using a plate shaker (120 rpm). At 20 min intervals, a sample was taken from the acceptor compartment and the concentration of the transported anthocyanins was analyzed by HPLC. Each sample volume was replaced with fresh pre-heated (37 °C) HBSS. To quantify the transport of anthocyanins across the Caco-2 cell monolayer, the apparent permeability coefficient (Papp) was determined according to the protocol previously described by Tavelin et al.16Anti-inflammatory experiment procedure
A co-culture model consisting of differentiated Caco-2 cell monolayers (located on the apical side) and 24-hour culture of RAW264.7 macrophages (adhered to the surface of the plate on the basolateral side of the bicameral chamber) was used to determine the anti-inflammatory potential of the PCA extract with respect to IBD. This co-culture system is considered to be useful as an in vivo gut inflammation model.17 The experiment was initiated by addition of the PCA extract (50 μg mL−1) or budesonide (1 μM) to the apical side of the co-culture system. The Caco-2/RAW264.7 cultures were maintained in the incubator (37 °C) on the plate shaker (120 rpm) for 2 hours. After incubation, the RAW264.7 cells were stimulated by the addition of 5 ng mL−1 of lipopolysaccharides (LPS) from E. coli O127 (Sigma-Aldrich) to the basolateral side of the co-culture models. After an additional 3-hour incubation, both apical and basolateral culture media were collected for measurement of TNF-α, Il-6, prostaglandin E2 (Pge2) and IL-8. The Caco-2 and RAW264.7 cells were used for total RNA isolation and pro-inflammatory gene expression analysis by the real-time PCR method.Quantification of proinflammatory gene expression using real-time PCR
Total RNA was isolated from the cells using TRI Reagent® (Sigma-Aldrich) according to the manufacturer's instructions. The RNA samples were subjected to DNase treatment by incubation at 37 °C for 15 min with the reaction buffer and RNase-free DNase I recombinant (both from Roche Diagnostics GmbH, Mannheim, Germany). RNA was quantified using the NanoDrop 1000 spectrophotometer (Thermo Fisher Scientific, Wilmington, USA). Equal amounts of total RNA (0.5 μg) from each sample were reverse-transcribed to cDNA using the Transcriptor First Strand cDNA Synthesis Kit (Roche Diagnostics GmbH, Poland), following the manufacturer's protocol. Real-time PCR was performed in a final volume of 25 μL including 10 ng of sample cDNA, 5 μM of specific forward and reverse primers and 12.5 μL of SYBR® Select Master Mix (Life Technologies, Carlsbad, CA, USA). The sequences of the used primers are listed in Table 1. The reaction mixtures were incubated for an initial denaturation at 94 °C for 10 min, followed by 40 PCR cycles: 40 s at 95 °C, 30 s at 59 °C and 30 s at 72 °C. The purity of the PCR products was determined on the basis of melting curve analysis.| Primer | NCBI reference | Primer sequences (5′ → 3′) | Product size (bp) |
|---|---|---|---|
| Mm Il1a | NM 010554.4 | TTGGTTAAATGACCTGCAACA GAGCGCTCACGAACAGTTG | 122 |
| Mm Il1b | NM 008361.3 | AGGTCAAAGGTTTGGAAGCA TGAAGCAGCTATGGCAACTG | 129 |
| Mm Il6 | NM 031168.1 | TCTGAAGGACTCTGGCTTTG GATGGATGCTACCAAACTGGA | 142 |
| Mm Nos2 | NM 010927.3 | TGAAGAAAACCCCTTGTGCT TTCTGTGCTGTCCCAGTGAG | 100 |
| Mm Ptgs2 | NM 011198.3 | GGCGCAGTTTATGTTGTCTGT CAAGACAGATCATAAGCGAGGA | 107 |
| Mm TNF-α | NM 001278601.1 | AGGGTCTGGGCCATAGAACT CCACCACGCTCTTCTGTCTAC | 103 |
| Mm Act-β | NM 007393.3 | ATGGAGGGGAATACAGCCC TTCTTTGCAGCTCCTTCGTT | 149 |
| Hs IL8 | NM 000584.3 | AGCACTCCTTGGCAAAACTG CGGAAGGAACCATCTCACTG | 116 |
| Hs GAPDH | NM 002046.4 | AATGAAGGGGTCATTGATGG AAGGTGAAGGTCGGAGTCAA | 108 |
The levels of transcripts Il-1β, Il-6, TNF-α, prostaglandin-endoperoxide synthase 2 (Ptgs2), commonly referred to as Cox-2, iNos (Nos2) and IL-8, were normalized to that of β-actin and glyceraldehyde-3-phosphate dehydrogenase (GAPDH), respectively. The relative amount of each gene was calculated using the 2−ΔΔCT method.18
The levels of each different mRNA in the control cells (treated only with LPS) were designated as 1 and the relative levels of the gene transcripts in the samples were expressed as the fold change. A value of <1 indicates transcriptional down-regulation (inhibition of gene expression) compared with LPS, which shows maximum genetic induction. Values > 1 imply overexpression of the particular gene in an excess of LPS stimulation. All reactions were performed in triplicate.
Quantification of the production of proinflammatory mediators
The levels of Il-6, IL-8, TNF-α and Pge2 were quantified with the ELISA kits (R&D Systems, Inc, Minneapolis, MN, USA) according to the manufacturer's instructions. Quantitation was performed by calibration of the standards. All standards and samples were assayed in triplicate. Protein concentrations were expressed in pg mL−1 of the culture supernatant, which was equivalent to the amount of protein per 1 × 10⁶ cells.Nitric oxide determination
The quantity of nitrite accumulated in the culture medium, which is considered as an indicator of nitric oxide (NO) production, was determined using the Griess reagent (Sigma-Aldrich). Equal volumes of the Griess reagent and RAW264.7 culture supernatant were mixed and incubated at room temperature for 15 min. The absorbance was measured at 540 nm using a Tecan M200 Infinite microplate reader. A standard sodium nitrite curve was used to calculate the amount of NO.Statistical analysis
Statistical analysis was performed using STATISTICA version 10.0 software (Statsoft, Inc., Tulsa, OK, USA). One-way analysis of variance (ANOVA) was conducted to determine the significance of the main effects. The equality of variances assumption was verified with the Levene's test. Differences between the mean values of multiple groups were analyzed by parametric Tukey's post hoc test. Data obtained from three independent replicates were used for each statistical analysis. Statistical significance was considered at P < 0.05.Results and discussion
Identification of anthocyanins in PCA extract
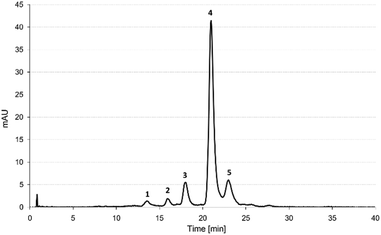
Five anthocyanin components were identified in the PCA extract, including cyanidin-3-xylosyl(glucosyl)galactoside (cyn-xyl-glu-gal) (1) cyanidin-3-xylosylgalactoside (cyn-xyl-gal) (2), cyanidin-3-xylosyl(sinapoylglucosyl)galactoside (cyn-xyl-sin-glu-gal) (3), cyanidin-3-xylosyl(feruloylglucosyl)galactoside (cyn-xyl-fer-glu-gal) (4) and cyanidin-3-xylosyl (coumaroylglucosyl)galactoside (cyn-xyl-cou-glu-gal) (5). The chromatographic profile and mass spectrometric properties of the separated anthocyanin compounds are shown in Fig. 1 and Table 2, respectively.| Peak | m/z | Tentative ID | Relative concentration (%) | |
|---|---|---|---|---|
| M+ | Aglycon | |||
| a Peak number according to Fig. 1. | ||||
| 1a | 743.21 | 287.0577 | Cyanidin-3-xylosyl (glucosyl)galactoside | 4.8 |
| 2a | 581.15 | 287.0589 | Cyanidin-3-xylosylgalactoside | 4.3 |
| 3a | 949.27 | 287.0574 | Cyanidin-3-xylosyl (sinapoylglucosyl)galactoside | 7.2 |
| 4a | 919.26 | 287.0572 | Cyanidin-3-xylosyl (feruloylglucosyl)galactoside | 77.5 |
| 5a | 889.24 | 287.0576 | Cyanidin-3-xylosyl (coumaroylglucosyl)galactoside | 6.2 |
The cyanidin-based acylated derivatives accounted for 90.9% of the total cyanidin-based anthocyanins identified in the PCA extract. The major anthocyanin component was found to be cyn-xyl-glu-gal acylated with ferulic acid (4), which accounted for 77.5% of the total amounts of cyanidin-based derivatives. The anthocyanin profile of the PCA extract was considered typical for the PC variety Deep Purple, based on the results, which have already been reported in the literature.6,19
Permeability of PCA across intestinal epithelium
The Caco-2 cell culture model was used in order to determine the permeability of the PCA across the intestinal barrier. The Caco-2 cells spontaneously differentiate to enterocyte-like cells and form an integral monolayer of cells expressing many brush border enzymes, some cytochrome P-450 isoenzymes, phase II enzymes and many active transport systems, which are found in human enterocytes in vivo.16 The Caco-2 model of human intestinal absorption has proven to be a good alternative to animal studies for predicting intestinal transport of various substances. The expected good correlation between permeability in vitro and oral drug absorption in the human body was based on previous studies with this cell culture.16,20Prior to carrying out a transport study, the effect of the tested compounds on Caco-2 cell membrane permeability as well as Caco-2 monolayer integrity and intestinal barrier properties was examined. No cytotoxicity of the PCA extract at a concentration of 486 μg mL−1 was observed after 3 hours of exposure. The TEER measurement indicated a high integrity of the Caco-2 monolayer in both cultures, before and after the transport experiment (data not shown). The transport of the anthocyanin compounds was evaluated at a target concentration of 486 μg mL−1 and was initiated by the addition of the anthocyanin solution to the apical compartment for absorptive transport determination. The results indicated that PC anthocyanins were able to cross the Caco-2 cell monolayer and their cumulative transported fraction (CTF) in the basolateral compartment increased linearly with time (Fig. 2A). Following the 3-hour transport experiment, approx. 1% of the total amount of the PCA was transported through the Caco-2 monolayer and cumulated in the acceptor compartment. The apical-to-basolateral permeability coefficient of the PCA was determined to be 1.63 ± 0.26 × 10⁻⁶ cm s−1, suggesting moderate oral availability. The drug substances with Papp values ranging from 1 to 10 × 10−6 cm s−1 can be classified as moderately (20–70%) absorbed compounds.20
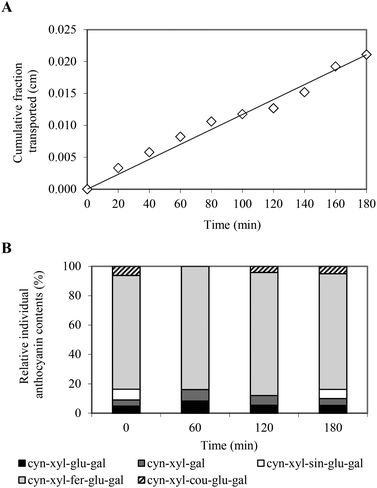 | ||
| Fig. 2 Time course of total PC anthocyanins (A) and individual PC anthocyanin contents (B) in the cumulative fraction transported across the intestinal epithelial Caco-2 cell monolayer. | ||
The time-course experiment revealed that the absorption rate of the anthocyanins was different, depending on their structure. Following the 1-hour transport experiment, three anthocyanin compounds were identified in the CTF, including cyn-xyl-glu-gal, cyn-xyl-gal and cyn-xyl-fer-glu-gal (Fig. 2B). In the basolateral compartment, anthocyanin acylated with coumaric acid (cyn-xyl-cou-glu-gal) appeared in the next hour, whereas an anthocyanin profile typical for the PCA extract was attained during the final stage of the transport experiment (Fig. 2B). These findings, which indicate the lower intestinal permeability of the acylated anthocyanins compared to the non-acylated anthocyanins, are consistent with the data reported in the literature.21,22
The data obtained in the framework of this study indicate that the acylated cyanidin-based anthocyanins derived from the PC roots have the ability to penetrate the intestinal barrier and may potentially contribute to health-beneficial effects in specific tissues or organs of the human body.
Anti-inflammatory effects of PC anthocyanins
A co-culture model consisting of intestinal epithelial Caco-2 cells (apical side) and macrophage RAW264.7 cells (basolateral side) was applied for assessment of the gut anti-inflammatory effects of the PCA extract. In this co-culture system, the RAW264.7 macrophages were stimulated with LPS to induce an inflammatory response, while the Caco-2 cells were exposed to PCA extract at a dose of 50 μg mL−1. The anti-inflammatory effects of the PCA extract were assessed based on Pge2 and NO measurement, determination of inflammation-related proteins as well as analysis of proinflammatory gene expression.Prior to the assessment of the ability of the PCA extract to inhibit LPS-induced inflammatory mediators, an LDH assay was performed to exclude the possibility of inhibitory effects caused by cytotoxicity. The obtained results indicated that the PCA extract was not cytotoxic to both Caco-2 and RAW264.7 cells at the tested concentration (data not shown).
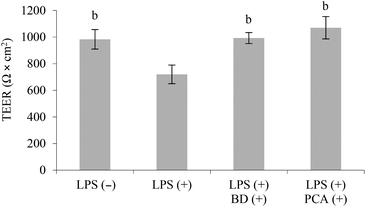
In this co-culture system, the stimulation of the RAW264.7 cells with LPS was followed by a 26.8% decrease in TEER (P < 0.05), which is a marker of Caco-2 monolayer integrity. Treatment with budesonide (glucocorticoid steroid used in the therapy of IBD) or PCA extract protected the Caco-2 cell monolayer against injury induced by LPS. The TEER values in co-culture systems concurrently treated with budesonide or the PCA extract and LPS were similar to those determined in the control system, which was not treated with LPS (Fig. 3).
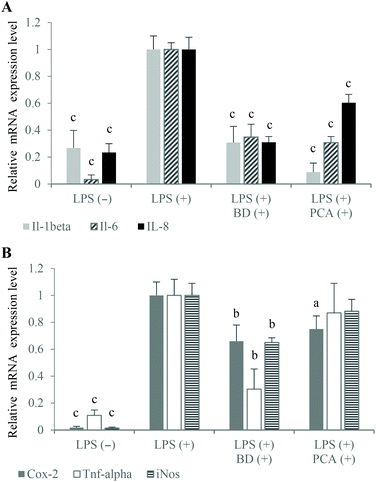
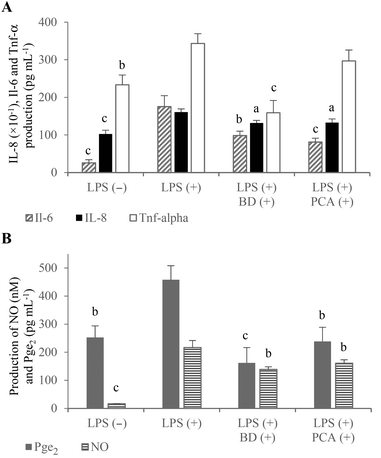
The large amount of proinflammatory cytokines produced by the activated macrophages is one of the reasons for the increased permeability of the intestinal epithelium.1,15 In the experimental co-culture model, which imitated gut inflammation, the expression of proinflammatory cytokine genes (which play a key role in IBD) was analyzed using the real-time PCR method to investigate the potential anti-inflammatory properties of the PCA extract. The mRNA levels of Il-1β and Il-6 as well as TNF-α were measured after the stimulation of inflammation in the RAW264.7 cells, in the presence of budesonide or the PCA extract. The results indicated that the PCA extract down-regulated the expression of Il-1β (↓91.2%) and Il-6 (↓69.2%) compared to the control macrophages activated in the co-culture model without PCA extract supplementation. However, the expression of TNF-α mRNA was not significantly decreased (↓12.9%; P > 0.05) upon exposure to the PCA extract (Fig. 4A). Similarly, the production of TNF-α by LPS-stimulated RAW264.7 cells treated with the transported PCA extract was only slightly lower than that determined in the medium collected from the culture of the control macrophages (Fig. 5A). The reduction of Il-6 mRNA expression (Fig. 4A), caused by the PCA extract, was reflected by the reduced production of this cytokine by the activated RAW264.7 cells (↓77.9%) (Fig. 5A).
NO and Pge2 (generated by activated iNos and Cox-2, respectively) are considered to be important inflammatory mediators, which are characteristic for the pathology of IBD. NO plays a pivotal role in the regulation of many physiological functions of the human body, but its overproduction (by macrophages in particular) can lead to cytotoxicity, inflammation and autoimmune disorders.23 Thus, inhibitors of excessive production of NO are essential for the prevention and therapy of IBD. The obtained results indicated an inhibitory effect of the PCA extract on NO production (Fig. 5B), although significant down-regulation of iNos mRNA expression has not been demonstrated in LPS-activated macrophages (Fig. 4B). NO concentration in the basolateral medium of the Caco-2/RAW264.7 model supplemented with the PCA extract was decreased by 25.7% compared to the control co-culture system (Fig. 5B). A slight decrease in the iNos expression level, estimated at 11.7%, has proven to be statistically insignificant (Fig. 4B).
It has been reported that NO production affects the induction of Cox-2 activity and, in consequence, the generation of Pge2.24 An inducible form of Cox-2, which is rapidly induced in response to the stimulation of inflammation, is responsible for the conversion of arachidonic acid to prostaglandins. The production of large amounts of prostaglandins, especially Pge2, causes acute and chronic inflammation, including IBD.25 Therefore, natural selective Cox-2 inhibitors are considered to be valuable compounds, which effectively suppress inflammation without the induction of side effects and gastrointestinal toxicity in comparison with conventional nonsteroidal anti-inflammatory drugs. The tested PCA extract down-regulated Cox-2 expression (↓25.0%) (Fig. 4B) and reduced Pge2 formation in the activated RAW264.7 macrophages (↓47.9%) (Fig. 5B). The anti-inflammatory capacity of the PCA extract and budesonide was comparable, considering the inhibition of Cox-2 mRNA expression and Pge2 production.
Inflammation stimulated in the co-culture Caco-2/RAW264.7 model caused an increase in the mRNA expression level (Fig. 4A) and production of IL-8 in the Caco-2 cells (Fig. 5A). It has been reported that TNF-α induces IL-8 expression in virtually all types of cells, including intestinal epithelial cells.26 Budesonide treatment of the apical compartment significantly down-regulated the IL-8 mRNA expression (↓69.0%) as well as TNF-α expression (↓69.6%) and TNF-α production (↓53.7%) compared to control (Fig. 4A, B and 5A). Tanoue et al. reported that the down-regulating effects of budesonide on IL-8 expression in the Caco-2 cells was due to the suppression of TNF-α production by the RAW264.7 cells stimulated with LPS.17 The described relationships between the expression of IL-8 and TNF-α were not observed in the co-culture model, in which the PCA extract was added to the apical compartment instead of budesonide. Following the treatment of Caco-2 cells with the PCA extract, the IL-8 mRNA expression was inhibited by 39.6% without a significant effect on the expression and production of TNF-α in the RAW264.7 macrophages (Fig. 4A and 5A). However, the down-regulated IL-8 mRNA expression was reflected by a significantly reduced IL-8 production in the Caco-2 cells (↓17.4%, P < 0.05) (Fig. 5A).
Conclusions
The obtained results may provide preliminary justification for the use of PCA as natural bioactive compounds in the prevention and therapy supporting the conventional treatment of inflammatory-related diseases. To our knowledge, this study is the first to point out the anti-inflammatory properties of PCA with respect to gut inflammation. Moreover, the data obtained from these in vitro intestinal transport studies indicate that bioavailability of PC anthocyanins, the acylated forms in particular, may be sufficient to induce health promoting effects in other tissues. Consequently, the anti-inflammatory potential of PC anthocyanins may not be limited to gut inflammation, but can also be extended to other tissues and organs of the human body. Further in vivo studies will be undertaken to confirm the anti-inflammatory effects of PCA found in experiments performed using in vitro models.Conflict of interest
The authors have no conflict of interest to declare.Acknowledgements
This work was financially supported by the Ministry of Science and Higher Education, Poland (Grant NN312211338).References
- D. K. Podolsky, N. Engl. J. Med., 2002, 347, 417–429 CrossRef CAS PubMed.
- T. Debnath, D. H. Kim and B. O. Lim, Molecules, 2013, 18, 7253–7270 CrossRef CAS PubMed.
- T. Tsuda, Food Sci. Technol. Res., 2012, 18, 315–324 CrossRef CAS.
- F. Folmer, U. Basavaraju, M. Jaspars, G. Hold, E. El-Omar, M. Dicato and M. Diederich, Phytochem. Rev., 2014, 13, 295–322 CrossRef CAS.
- A. Padayachee, G. Netzel, M. Netzel, L. Day, D. Mikkelsen and M. J. Gidley, Food Funct., 2013, 4, 906–916 CAS.
- A. Olejnik, J. Rychlik, M. Kidoń, J. Czapski, K. Kowalska, W. Juzwa, M. Olkowicz, R. Dembczyński and M. P. Moyer, Food Chem., 2016, 190, 1069–1077 CrossRef CAS PubMed.
- M. Mittal, M. R. Siddiqui, K. Tran, S. P. Reddy and A. B. Malik, Antioxid. Redox Signaling, 2014, 20, 1126–1167 CrossRef CAS PubMed.
- S. J. Park, W. H. Shin, J. W. Seo and E. J. Kim, Food Chem. Toxicol., 2007, 45, 1459–1467 CrossRef CAS PubMed.
- H. Poudyal, S. Panchal and L. Brown, Br. J. Nutr., 2010, 104, 1322–1332 CrossRef CAS PubMed.
- B. T. Metzger, D. M. Barnes and J. D. Reed, J. Agric. Food Chem., 2008, 56, 3554–3560 CrossRef CAS PubMed.
- O. R. L. Wright, G. A. Netzel and A. R. Sakzewski, Can. J. Physiol. Pharmacol., 2013, 91, 480–488 CrossRef CAS PubMed.
- C. S. Charron, A. C. Kurilich, B. A. Clevidence, P. W. Simon, D. J. Harrison, S. J. Britz, D. J. Baer and J. A. Novotny, J. Agric. Food Chem., 2009, 57, 1226–1230 CrossRef CAS PubMed.
- L. E. Rodriguez-Saona and R. E. Wrolstad, in Current Protocols in Food Analytical Chemistry, ed. S. King, M. Gates and L. Scalettar, Wiley, New York, 2001, pp. F1.1.1–F1.1.11 Search PubMed.
- E. C. Montilla, M. R. Arzaba, S. Hillebrand and P. Winterhalter, J. Agric. Food Chem., 2011, 59, 3385–3390 CrossRef CAS PubMed.
- M. F. Fredin, E. Ulfhammer, M. Rhedin, S. Melgar, B. Mellgård and A. Peterson, Pharmacol. Res., 2005, 52, 422–428 CrossRef CAS PubMed.
- S. Tavelin, J. Gråsjö, J. Taipalensuu, G. Ocklind and P. Artursson, in Methods in Molecular Biology, Epithelial Cell Culture Protocols, ed. C. Wise, Humana Press Inc., Totowa, New Jersey, 2002, vol. 188, pp. 233–272 Search PubMed.
- T. Tanoue, Y. Nishitani, K. Kanazawa, T. Hashimoto and M. Mizuno, Biochem. Biophys. Res. Commun., 2008, 374, 565–569 CrossRef CAS PubMed.
- K. J. Livak and T. D. Schmittgen, Methods, 2001, 25, 402–408 CrossRef CAS PubMed.
- S. Suzme, D. Boyacioglu, G. Toydemir and E. Capanoglu, Int. J. Food Sci. Technol., 2014, 49, 819–829 CrossRef CAS.
- S. Yee, Pharm. Res., 1997, 14, 763–766 CrossRef CAS.
- M. Netzel, G. Netzel, D. R. Kammerer, A. Schieber, R. Carle, L. Simons, I. Bitsch, R. Bitsch and I. Konczak, Innov. Food Sci. Emerg., 2007, 8, 365–372 CrossRef CAS.
- J. A. Novotny, B. A. Clevidence and A. C. Kurilich, Br. J. Nutr., 2012, 107, 504–509 CrossRef CAS PubMed.
- N. Ahmad, L. C. Chen, M. A. Gordon, J. D. Laskin and D. L. Laskin, J. Leukoc. Biol., 2002, 71, 1005–1011 CAS.
- Y. C. Chang, P. C. Li, B. C. Chen, M. S. Chang, J. L. Wang, W. T. Chiu and C. H. Lin, Cell Signalling, 2006, 18, 1235–1243 CrossRef CAS PubMed.
- R. Fux, M. Schwab and K. P. Thon, Clin. Cancer Res., 2005, 11, 4754–4760 CrossRef CAS PubMed.
- M. Baggiolini, P. Loetscher and B. Moser, Int. J. Immunopharmacol., 1995, 17, 103–108 CrossRef CAS PubMed.
| This journal is © The Royal Society of Chemistry 2016 |

