Design of block copolymer membranes using segregation strength trend lines
Burhannudin
Sutisna
a,
Georgios
Polymeropoulos
b,
Valentina
Musteata
c,
Klaus-Viktor
Peinemann
d,
Apostolos
Avgeropoulos
be,
Detlef-M.
Smilgies
f,
Nikos
Hadjichristidis
*b and
Suzana P.
Nunes
*c
aPhysical Science and Engineering Division (PSE), King Abdullah University of Science and Technology (KAUST), 23955-6900 Thuwal, Saudi Arabia
bCatalysis Center (KCC), Physical Science and Engineering Division (PSE), King Abdullah University of Science and Technology (KAUST), 23955-6900 Thuwal, Saudi Arabia. E-mail: nikolaos.hadjichristidis@kaust.edu.sa
cBiological and Environmental Science and Engineering Division (BESE), King Abdullah University of Science and Technology (KAUST), 23955-6900 Thuwal, Saudi Arabia. E-mail: suzana.nunes@kaust.edu.sa
dAdvanced Membranes and Porous Materials Center (AMPMC), Physical Science and Engineering Division (PSE), King Abdullah University of Science and Technology (KAUST), 23955-6900 Thuwal, Saudi Arabia
eDepartment of Materials Science Engineering, University of Ioannina, University Campus-Dourouti, 45110 Ioannina, Greece
fCornell High Energy Synchrotron Source, Wilson Laboratory, Cornell University, Ithaca, New York 14853, USA
First published on 18th May 2016
Abstract
Block copolymer self-assembly and non-solvent induced phase separation are now being combined to fabricate membranes with narrow pore size distribution and high porosity. The method has the potential to be used with a broad range of tailor-made block copolymers to control functionality and selectivity for specific separations. However, the extension of this process to any new copolymer is challenging and time consuming, due to the complex interplay of influencing parameters, such as solvent composition, polymer molecular weights, casting solution concentration, and evaporation time. We propose here an effective method for designing new block copolymer membranes. The method consists of predetermining a trend line for the preparation of isoporous membranes, obtained by computing solvent properties, interactions and copolymer block sizes for a set of successful systems and using it as a guide to select the preparation conditions for new membranes. We applied the method to membranes based on poly(styrene-b-ethylene oxide) diblocks and extended it to newly synthesized poly(styrene-b-2-vinyl pyridine-b-ethylene oxide) (PS-b-P2VP-b-PEO) terpolymers. The trend line method can be generally applied to other new systems and is expected to dramatically shorten the path of isoporous membrane manufacture. The PS-b-P2VP-b-PEO membrane formation was investigated by in situ Grazing Incident Small Angle X-ray Scattering (GISAXS), which revealed a hexagonal micelle order with domain spacing clearly correlated to the membrane interpore distances.
Design, System, ApplicationMembranes with exceptionally high porosity and regular pore size can be formed by block copolymer self-assembly in selective solvents and phase separation induced by precipitation in a non-solvent. The final pore morphology depends on a number of parameters, including composition of the solvent mixture and copolymer concentration, block chemistry and ratio, and molecular weight. We propose a method to identify the best solvent composition to obtain isoporous membranes, based on a segregation strength trend line. The important parameters to determine this function are the interaction parameters between the solvent mixture and the polymer blocks and the volume ratio of the polymer blocks. The molar volume of the solvent mixture has to be known as well as the difference between the Hansen solubility parameters for the solvents and the polymer blocks. The calculated trend line is then an elegant tool to predict the best solvent composition for a given block copolymer. This design tool substantially simplifies the development process to manufacture isoporous block copolymer membranes. Membranes with this level of uniformity allow challenging separations, which are hardly achieved by other strategies. Potential applications include protein separation, virus filtration and in general filtration processes, which require sharp molecular separation, e.g. haemodialysis. |
1. Introduction
The ability of block copolymers to self-assemble has enabled application in many fields, such as drug delivery,1–3 catalysis,4,5 and electronics.6 Guided by thermodynamic interactions and entropic constraints, a rich variety of morphologies can be obtained in the melt and in solutions of diblock and triblock copolymers.7–13 The equilibrium morphology in the melt, achieved after long periods of annealing, can be predicted by considering the Flory–Huggins interactions between blocks, the molecular weight and the block ratio following excellent theoretical work in the field and applying, for instance, self-consistent field simulations.14–16 The morphology in solution is strongly influenced by the interfacial energy between blocks, block–solvent interactions, block copolymer architectures, the polymerization degree of each block and copolymer concentration. Solid work has been reported particularly in diluted systems, adapting the concept of packing factors used initially for low molecular weight surfactants in solution to predict the morphology, which might be in the form of spherical micelles, wormlike rods and vesicles.17,18 In the high concentration range, self-consistent field has been used to understand the changes in morphology promoted by solvent annealing.19 The semi-diluted concentration range has been less investigated and might be even more complex. In addition to the factors influencing the geometry of single assemblies in diluted solutions, in this concentration range the micelles themselves might strongly interact with each other and self-organize in quasi-crystalline structures, either hexagonal, body-centered cubic (bcc) or face-centered cubic (fcc) arrangements.20–22 A high concentration promotes inter-micelle entanglement with additional elastic considerations. The core rigidity and the friction between segments of different micelle coronas can influence the adopted morphology and promote the existence of metastable structures. Fast solvent evaporation, solvent–non-solvent exchange and in situ polymerization can kinetically trap morphologies far from equilibrium.23–26 These strategies are being used to stabilize morphologies, which might be more convenient for specific applications than equilibrium ones. An important example is the development of membranes for selective separation. Membranes cast from block copolymer solutions have a remarkable advantage over commercial homopolymer membranes prepared by phase inversion. By combining self-assembly and non-solvent induced phase separation, membranes can be manufactured with narrow pore size distribution and exceptionally high porosity.27–29 The pore formation is highly sensitive to the solvent composition and reflects self-assembly in the bulk of the casting solution. Membranes based on polystyrene-b-poly(4-vinyl pyridine) (PS-b-P4VP),30,31 poly(isoprene-b-styrene-b-4-vinyl pyridine) (PI-b-PS-b-P4VP)32 and polystyrene-b-poly(ethylene oxide) (PS-b-PEO)33,34 have been demonstrated and optimized to achieve long-range pore order. We have used dissipative particle dynamics to understand the effect of solvent composition, concentration and molecular weight on copolymer self-assembly in the semi-dilute regime, close to conditions used for membrane preparation.35,36 The synthesis of copolymers with different molecular architectures and functionalization could extend the application of self-assembly and non-solvent induced phase separation membranes with exact tuned porosity and functional properties. However, each time a new molecular weight combination or a new copolymer is explored for membrane fabrication, strenuous optimization is required. A practical method is needed to simplify the selection of the best solution composition for a membrane starting from a new copolymer. We have been investigating the correlation between the different parameters, looking for practical semi-empirical procedures to drastically shorten the path of membrane manufacture. We propose here a simple semi-empirical selection method, which identifies a trend line or master curve for block copolymer membrane manufacture. The curve calculation takes into consideration block volume ratios and the different interactions between blocks and solvent mixtures. We demonstrated the method by first comparing data published for previously reported copolymer systems. We synthesized then a new triblock copolymer and optimized the morphology, by using the proposed method. We followed the membrane formation by SAXS, time-resolved GISAXS experiments and electron microscopy, demonstrating the efficiency of the method. We believe the proposed approach will substantially facilitate new developments in the field.2. Materials and methods
2.1. Materials
Poly(styrene-b-ethylene oxide) copolymers, PS195k-b-PEO45k (PDI = 1.18), were purchased from Polymer Source, Inc., Canada. Tetrahydrofuran (THF), 1,4-dioxane (DOX), N,N-dimethylformamide (DMF), and pyridine (Pyr) were supplied by Sigma-Aldrich and used as received. MilliQ water was used as a non-solvent bath.For the synthesis of PS80.5k-b-P2VP64.4k-b-PEO16.1k the following chemicals were used after purification. THF (Sigma Aldrich, 99.9%) was refluxed over sodium, stirred in the presence of CaH2 overnight and distilled over a Na/K alloy. sec-Butyllithium (Sigma-Aldrich, 1.4 M in cyclohexane) was diluted to the appropriate concentration in purified hexane, in a specific glass apparatus under high vacuum. Styrene (Sigma Aldrich, 99%) was purified by distillation over CaH2 and dibutyl-magnesium (Sigma-Aldrich, 1 M solution in heptane) and stored in pre-calibrated ampoules. 2-Vinylpyridine (Sigma Aldrich, 97%) was distilled twice over CaH2 and once over a sodium mirror, stirred in the presence of trimethyl-aluminum (Sigma Aldrich, 97%) at 0 °C and used directly for the polymerization. Ethylene oxide (Sigma-Aldrich, 99.5%) was purified by consecutive distillations over CaH2 and n-BuLi at 0 °C, prior to distillation in the polymerization reactor. The phosphazene superbase, 1-tert-butyl-4,4,4-tris(dimethylamino)-2,2-bis[tris(dimethylamino)-phosphoranylidenamino]-2λ5,4λ5-catena-di(phosphazene) (P4-tBu) (Sigma-Aldrich, 0.8 M in hexane), was diluted in purified hexane and stored at pre-calibrated ampoules. Acetic acid (terminating agent) was stored under high vacuum and used as received.
2.2. Triblock terpolymer synthesis and chemical characterization
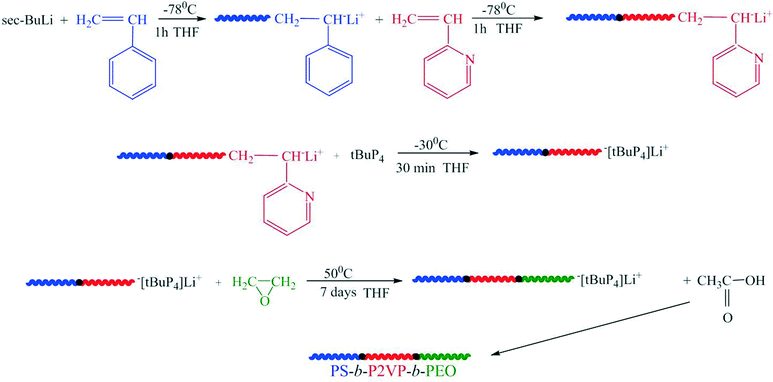
The linear triblock terpolymer PS80.5k-b-P2VP64.4k-b-PEO16.1k (PS: polystyrene; P2VP: poly(2-vinylpyridine); PEO: poly(ethylene oxide) was synthesized via sequential anionic polymerization high vacuum techniques.37 The synthesis (Scheme 1) by sequential addition of the monomers according to their reactivity involves the anionic polymerization of styrene (5 g, −78 °C, THF) with 0.062 mmol of sec-butyllithium as initiator. After completion of the polymerization of the first block (one hour), an aliquot was taken for size exclusion chromatography (SEC) analysis, followed by transfer through distillation of the appropriate amount of 2-VP (4 g) under vigorous stirring at −78 °C. After 1 h, another aliquot was taken for SEC analysis. Finally, 0.056 mmol of the P4-tBu superbase was added, followed by distillation of 1 g of EO and the polymerization solution was left under stirring at 50 °C.38–41 After 7 days, the polymerization was quenched by acetic acid and the polymer was precipitated in cold hexane. The final product was dried in a vacuum oven for 48 h at 40 °C (colorless powder).The number-average molecular weight (Mn) and polydispersity index (PDI) of the PS, the diblock copolymer PS-b-P2VP and the final triblock terpolymer PS-b-P2VP-b-PEO were determined using a SEC, equipped with an isocratic pump (Spectra system P1000), three columns in series (PLgel 5 μm Mixed-C, 300 × 7.5 mm), and a refractive index (RI, Shodex RI-101) detector in THF with a flow rate of 1 mL min−1 at 45 °C in order to prevent crystallization of the PEO block. Polystyrene standards (Mp: 4300 to 3![[thin space (1/6-em)]](https://www.rsc.org/images/entities/char_2009.gif) 000
000![[thin space (1/6-em)]](https://www.rsc.org/images/entities/char_2009.gif) 000 g mol−1) were used for the calibration of the instrument. The chemical nature of the different blocks and the composition of the terpolymer were determined by using a Bruker AV-500 1H-NMR spectrometer in CDCl3 (Acros 99.6%) in the presence of tetramethylsilane (TMS) as internal standard. It should be noted that the molecular weights determined by the SEC calibrated with PS standards are apparent. Nevertheless, in this case since PS and P2VP have similar hydrodynamic characteristics (key parameter in SEC) its molecular weight is very close to the real one.
000 g mol−1) were used for the calibration of the instrument. The chemical nature of the different blocks and the composition of the terpolymer were determined by using a Bruker AV-500 1H-NMR spectrometer in CDCl3 (Acros 99.6%) in the presence of tetramethylsilane (TMS) as internal standard. It should be noted that the molecular weights determined by the SEC calibrated with PS standards are apparent. Nevertheless, in this case since PS and P2VP have similar hydrodynamic characteristics (key parameter in SEC) its molecular weight is very close to the real one.
2.3. Membrane preparation
Block copolymers were dissolved in a mixture of solvents with a polymer concentration of 18–25 wt%. The solution was cast on a glass plate using a casting knife with a 200 μm air gap. The solvent was then allowed to evaporate for 10–20 s before precipitation in water at room temperature. The resulting membrane was dried under atmospheric conditions.2.4. Field emission scanning electron microscopy (FESEM)
FESEM micrographs of the membranes were obtained by using an FEI Quanta 200 or a Novanano microscope at an accelerating voltage of 5 kV and working distances of 5–7 mm. The samples were mounted on an aluminum stub using aluminum tape and sputter coated with 3 nm Pt before imaging.2.5. Transmission electron microscopy (TEM)
TEM of the membrane cross-sections and determination of the micelle morphology of the copolymers in diluted solutions were performed using a FEI Tecnai 12 microscope operating at 120 kV. The membranes were first stained with ruthenium tetroxide (RuO4) for better contrast in TEM. The stained membranes were embedded in epoxy resin and cured at 60 °C for 24 h. Ultrathin sections of the membranes with a thickness of 80 nm were prepared using an ultramicrotome (Leica EM UC6) with a diamond knife and placed on a copper grid before imaging. For micelle characterization, block copolymers were dissolved in a mixture of solvents with a polymer concentration of 1 g L−1 followed by stirring overnight. The solution was dropped onto a carbon-coated copper grid, and the solvent was immediately blotted using filter paper followed by drying at room temperature for about 5 min.2.6. Dynamic light scattering (DLS)
DLS measurements were performed using a Malvern Zetasizer with a 173° backscatter measurement angle and a glass cuvette with a square aperture. The samples were prepared by dissolving the copolymers in solvents with a polymer concentration of about 1 g L−1 followed by stirring overnight. The solutions were filtered through a 0.2 μm syringe filter before measurements.2.7. Small angle X-ray scattering (SAXS)
SAXS of the copolymer solutions were measured at the SAXS1 beam line of the Brazilian Synchrotron Facility (LNLS) with a fixed energy of 8.0 keV and an X-ray wavelength of 1.55 Å. The solution was injected into a vacuum cell with mica windows using a syringe. The detector used was a PILATUS 300k with a pixel size of (172 μm)2 and the sample-to-detector distance was 3.057 m. For each measurement, 30 s exposure time and beam area of 1 mm2 were used. Data were obtained as the average of azimuthal integrated scattering patterns after normalization to the incident beam intensity and subtraction of the background.2.8. Grazing incident small angle X-ray scattering (GISAXS)
In situ GISAXS experiments of the film casting were performed at the beam line D1 of the Cornell High Energy Synchrotron Source (CHESS) as described previously.42 An in situ doctor blading system43 installed at the beam line was used with a controlled coating gap of 200 μm and a casting speed of 1500 μm s−1. A beam energy of 10.6 keV and an X-ray wavelength of 1.162 Å were used with an incident angle of 0.13°. The copolymer solution was initially transferred with the use of a pipette onto a glass substrate positioned on the sample goniometer. A sample-to-detector distance of 1.82 m was used throughout the experiments. The automatic casting system allowed the blade to pass through the cast solution and form a film with 200 μm thickness. The GISAXS measurements of the film were started immediately after the blade reached its final position. The 2D scattering patterns were acquired every 3.3 s, which was composed of a 0.3 s exposure time and a 3 s detector read-out time. The X-ray detector used was a MedOptics CCD camera of (1024)2 pixels with a pixel size of (46.9 μm)2. Integrations of the horizontal cuts of the 2D patterns were performed using Fit2D software. A set of scattering peaks can be attributed to a certain order after normalizing with the value of the first peak (q*). The corresponding domain spacing (d-spacing) was calculated as 2π/q*.3. Results and discussion
We propose a simple method to guide the solvent selection for membrane manufacture by self-assembly and non-solvent induced phase separation (SNIPS). The method is expected to substantially shorten the manufacture process of isoporous membranes when new copolymers are explored. The method is demonstrated by using PS-b-PEO diblock copolymers and a newly synthesized PS-b-P2VP-b-PEO triblock copolymer. The motivation for exploring the ternary block copolymers is the following. Compared to PS-b-PEO membranes, PS-b-P2VP-b-PEO membranes could exhibit pH-responsiveness due to the presence of a pyridine block as demonstrated previously.44 Meanwhile, compared to PS-b-P2VP membranes, the addition of PEO could potentially increase the membrane resistance to fouling and biocompatibility due to the hydrophilicity of PEO.45,463.1. PS-b-P2VP-b-PEO copolymer synthesis and characterization
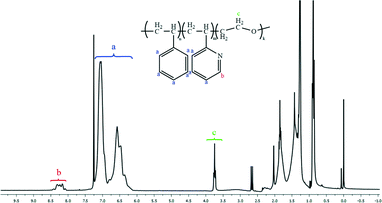
Fig. 1 and 2 and Table 1 show the characterization of the synthesized triblock copolymer. This includes the SEC traces (Fig. 1) and the molecular characterization (Table 1) results for different intermediary and final copolymerization products (PS, PS-b-P2VP and PS-b-P2VP-b-PEO) and the 1H-NMR spectrum of the linear triblock terpolymer PS-b-P2VP-b-PEO (Fig. 2). The triblock copolymer structure is very well defined and is considered as a model polymeric material for this work.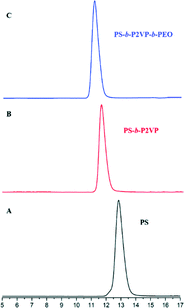 | ||
| Fig. 1 SE chromatographs of the (A) PS homopolymer, (B) PS-b-P2VP diblock copolymer and (C) final PS-b-P2VP-b-PEO terpolymer. | ||
3.2. Trend line for isoporous membrane preparation
The proposed method for solvent selection to guide self-assembly and lead to effective membrane manufacture is based on the values of segregation strengths estimated from the Flory–Huggins interaction parameters (χ) multiplied by the degree of polymerization (N). We analyzed the χ and N values for different copolymer systems, for which isoporous membranes have been previously reported. A trend line was plotted with a suitable ratio of parameters and used for further solvent selection for new systems. The method is explained in detail in this section.Table 2 summarizes the diblock copolymers and solvent mixtures, which led to ordered isoporous membranes in previous reports. Three segregation strengths were calculated for the polymer–solvent systems in Table 2:
| ID | Copolymer | Solventa | Solvent ratio (wt%) | V A/VB | χ sB N A | χ sB N B | χ AB N |
|---|---|---|---|---|---|---|---|
| a THF = tetrahydrofuran; Ac = acetone; DOX = 1,4-dioxane; DMF = N,N-dimethylformamide; DMAc = N,N-dimethyl acetamide; Sulf = sulfolane. b Flory–Huggins interaction parameters, χAB, of PS-P4VP and PS-PEO were 0.35 and 0.08, respectively.51,52 | |||||||
| P1 | PS175k-b-P4VP65k47 | THF/DOX/DMF | 1/1/1 | 2.8 | 779 | 141 | 804 |
| P2 | PS188k-b-P4VP64k48 | Ac/DOX/DMF | 20/51/29 | 3.1 | 831 | 144 | 845 |
| P3 | PS182.4k-b-P4VP57.6k49 | THF/DOX/DMF | 1/1/1 | 3.3 | 812 | 125 | 805 |
| P4 | PS138k-b-P4VP41k50 | THF/DOX/DMF | 1/1/1 | 3.6 | 614 | 89 | 600 |
| P5 | PS162.4k-b-P4VP28.7k30 | THF/DMF | 30/70 | 6.0 | 1313 | 82 | 641 |
| P6 | PS138k-b-PEO18k33 | THF/DMAc/Sulf | 48/29/23 | 8.2 | 839 | 158 | 139 |
1) Solvent mixture and the less soluble block (A): χsANA
2) Solvent mixture and the most soluble block (B): χsBNB
3) Less soluble block and the most soluble block (B): χABN where χsi is the Flory–Huggins interaction parameter between the solvent mixture and the polymer block i; Ni is the degree of polymerization of polymer block i, and N is the total degree of polymerization (N = NA + NB).
The Flory–Huggins interaction parameters between the solvent mixture and the polymer blocks (χsi) were calculated using eqn (1):
 | (1) |
| Asi = (δDs − δDi)2 + 0.25(δPs − δPi)2 + 0.25(δHs − δHi)2 | (2) |
Table 2 shows the calculated segregation strengths for the previously reported polymer–solvent systems. The copolymers (P1–P6) are listed in increasing order of VA/VB, which is the molar volume ratio of the less soluble block (A) to the most soluble block (B). The χsANA values are higher than χsBNB in all of the mixtures, implying that the A blocks (i.e. PS) should form the micelle core, while the B blocks (P4VP or PEO) form the corona due to their better compatibility with the solvent mixtures.
The segregation strengths vary with the copolymer and influence the form and deformability of micelles in solution. The micelle assembly affects the final membrane morphology. Previous observations indicate that the micelle arrangement in the casting solution bulk can directly reflect the pore order on the membrane surface.27 The rigidity can affect the micelle arrangement in solution.53 Furthermore, additives, which increase the micelle rigidity, or reduce their deformability, lead to a more ordered pore morphology.54 A motivation in this paper is to find a general parameter or set of parameters to predict which solvent combination would lead to effective segregation into spherical micelles and coronas with low deformability. A strong amphiphilic character favors aggregation into micelles. Core segments with low interaction with the solvent should have a positive effect on the ordered pore formation. But this is only a first requirement. The corona characteristics are at least as important. Favorable corona interactions with the solvent are a key requirement for the micelle formation. However the right combination of block length and corona–solvent interactions seems to be necessary to achieve an ordered pore morphology. Long corona segments with too strong interaction with the solvent mixture might lead to excessively deformable assemblies and less order.
We propose here to use the segregation strength, the dimensionless parameter ![[small chi, Greek, macron]](https://www.rsc.org/images/entities/i_char_e0d8.gif) , to choose the most convenient solvent composition. Its calculation should follow eqn (3):
, to choose the most convenient solvent composition. Its calculation should follow eqn (3):
 | (3) |
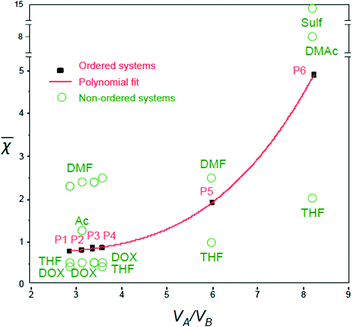
Remarkably, the ![[small chi, Greek, macron]](https://www.rsc.org/images/entities/i_char_e0d8.gif) values for the polymer–solvent mixtures listed in Table 2 could be fitted very well into a third-order polynomial trend line (with an R-square of 0.9999), when plotted against VA/VB (Fig. 3):
values for the polymer–solvent mixtures listed in Table 2 could be fitted very well into a third-order polynomial trend line (with an R-square of 0.9999), when plotted against VA/VB (Fig. 3):
![[small chi, Greek, macron]](https://www.rsc.org/images/entities/i_char_e0d8.gif) = 0.02 (VA/VB)3 + 0.12 (VA/VB)2 + 0.35 (VA/VB) + 0.37 = 0.02 (VA/VB)3 + 0.12 (VA/VB)2 + 0.35 (VA/VB) + 0.37 | (4) |
The ![[small chi, Greek, macron]](https://www.rsc.org/images/entities/i_char_e0d8.gif) values increase with VA/VB for the polymer–solvent systems that led to isoporous membranes.
values increase with VA/VB for the polymer–solvent systems that led to isoporous membranes.
As far as the thermodynamic meaning of ![[small chi, Greek, macron]](https://www.rsc.org/images/entities/i_char_e0d8.gif) is concerned, it could be correlated to the difference (Δg) between the free energy per unit volume for the ordered micelle state and that of the random state, described by Noolandi and Hong.55 The contribution of the interaction energies to Δg can be estimated as Δgint from eqn (5):
is concerned, it could be correlated to the difference (Δg) between the free energy per unit volume for the ordered micelle state and that of the random state, described by Noolandi and Hong.55 The contribution of the interaction energies to Δg can be estimated as Δgint from eqn (5):
 | (5) |
The term ![[small chi, Greek, macron]](https://www.rsc.org/images/entities/i_char_e0d8.gif) , used in this work, is a simplified and semi-empirical ratio, estimated only from the solubility parameters and the polymerization degree. This information is easily available for the copolymers and solvents and should be used a fast indicator of the most suitable cast solution composition.
, used in this work, is a simplified and semi-empirical ratio, estimated only from the solubility parameters and the polymerization degree. This information is easily available for the copolymers and solvents and should be used a fast indicator of the most suitable cast solution composition.
Plotting ![[small chi, Greek, macron]](https://www.rsc.org/images/entities/i_char_e0d8.gif) against VA/VB for different successful ordered systems gives a polynomial trend line as shown in Fig. 3. For the final ordered membrane morphology, the
against VA/VB for different successful ordered systems gives a polynomial trend line as shown in Fig. 3. For the final ordered membrane morphology, the ![[small chi, Greek, macron]](https://www.rsc.org/images/entities/i_char_e0d8.gif) values should be as close as possible to the line.
values should be as close as possible to the line.
Fig. 3 shows the ![[small chi, Greek, macron]](https://www.rsc.org/images/entities/i_char_e0d8.gif) values for single solvents. In general, the solvents leading to
values for single solvents. In general, the solvents leading to ![[small chi, Greek, macron]](https://www.rsc.org/images/entities/i_char_e0d8.gif) values above the trend line (e.g. DMF,
values above the trend line (e.g. DMF, ![[small chi, Greek, macron]](https://www.rsc.org/images/entities/i_char_e0d8.gif) = 2.4 for PS138k-b-P4VP41k, and DMAc,
= 2.4 for PS138k-b-P4VP41k, and DMAc, ![[small chi, Greek, macron]](https://www.rsc.org/images/entities/i_char_e0d8.gif) = 8.2 for PS138k-b-PEO18k) were good solvents for the most soluble blocks (P4VP or PEO), which form the corona. This favors micelle formation, but is not a sufficient condition for an ordered membrane morphology. On the other hand, the solvents with
= 8.2 for PS138k-b-PEO18k) were good solvents for the most soluble blocks (P4VP or PEO), which form the corona. This favors micelle formation, but is not a sufficient condition for an ordered membrane morphology. On the other hand, the solvents with ![[small chi, Greek, macron]](https://www.rsc.org/images/entities/i_char_e0d8.gif) below the trend line (i.e. THF,
below the trend line (i.e. THF, ![[small chi, Greek, macron]](https://www.rsc.org/images/entities/i_char_e0d8.gif) = 0.5, and DOX,
= 0.5, and DOX, ![[small chi, Greek, macron]](https://www.rsc.org/images/entities/i_char_e0d8.gif) = 0.5 for PS138k-b-P4VP41k) were good solvents for both blocks. The χsBNB and χsBNA values are closer for systems below the trend line (e.g. for PS138k-b-P4VP41k, THF, χsBNB = 108, χsANA = 428) than above the trend line (e.g. for PS138k-b-P4VP41k, DMF, χsBNB = 193, χsBNA = 1658). THF is less favorable for micelle formation in this case. A combination of solvents above and below the trend line might lead to an optimal composition, favouring well-formed micelles with low deformability.
= 0.5 for PS138k-b-P4VP41k) were good solvents for both blocks. The χsBNB and χsBNA values are closer for systems below the trend line (e.g. for PS138k-b-P4VP41k, THF, χsBNB = 108, χsANA = 428) than above the trend line (e.g. for PS138k-b-P4VP41k, DMF, χsBNB = 193, χsBNA = 1658). THF is less favorable for micelle formation in this case. A combination of solvents above and below the trend line might lead to an optimal composition, favouring well-formed micelles with low deformability.
The effect of solvent selectivity on block copolymer self-assembly in solution has been extensively demonstrated by the group of Eisenberg.57–60 They controlled the selectivity of water–DMF or water–dioxane systems for copolymer blocks by adjusting the amount of water in the solution to form various micelle morphologies, such as spheres, rods, and vesicles. Lodge et al.61 have also investigated the effect of solvent selectivity by adjusting the ratio of various dialkyl phthalates to control the formation of micelle morphologies of an asymmetric PS-b-PI copolymer from spheres to cylinders to vesicles. As the solvent selectivity increased, the solvent–core block interactions decreased, and the interfacial tension increased, which resulted in various aggregate morphologies.61 In a similar way the solvents can be adjusted to fit the trend line in Fig. 3.
The trend line was estimated disregarding the effect of solvent evaporation during membrane preparation.
3.3. Trend line method applied to an unexplored diblock copolymer
The trend line in Fig. 3 was used to estimate the best solvent mixtures for the preparation of isoporous membranes from an unexplored copolymer, PS195k-b-PEO45k (VA/VB = 4.7). From the third-order polynomial equation in eqn (4), the estimated![[small chi, Greek, macron]](https://www.rsc.org/images/entities/i_char_e0d8.gif) for PS195k-b-PEO45k was 1.42.
for PS195k-b-PEO45k was 1.42.
![[small chi, Greek, macron]](https://www.rsc.org/images/entities/i_char_e0d8.gif) calculations were done for the copolymer in various mono solvents as summarized in Table 3. Almost all the water-miscible solvents, including THF, DOX, and DMF, have
calculations were done for the copolymer in various mono solvents as summarized in Table 3. Almost all the water-miscible solvents, including THF, DOX, and DMF, have ![[small chi, Greek, macron]](https://www.rsc.org/images/entities/i_char_e0d8.gif) above the value calculated from the trend line while pyridine (Pyr) was the only water-miscible solvent that has a
above the value calculated from the trend line while pyridine (Pyr) was the only water-miscible solvent that has a ![[small chi, Greek, macron]](https://www.rsc.org/images/entities/i_char_e0d8.gif) value lower than the trend line. We then chose a ternary mixture of THF/DOX/Pyr as the solvent mixture for the preparation of isoporous membranes from PS195k-b-PEO45k. Table 3 shows the Hansen solubility parameters for the copolymer blocks and the components of the solvent mixture, including their dispersion, polarity, and hydrogen bond contributions.62 THF and DOX are better solvents for PEO than pyridine, mainly due to their close dispersion and hydrogen bond terms, while pyridine is a more compatible solvent for PS.
value lower than the trend line. We then chose a ternary mixture of THF/DOX/Pyr as the solvent mixture for the preparation of isoporous membranes from PS195k-b-PEO45k. Table 3 shows the Hansen solubility parameters for the copolymer blocks and the components of the solvent mixture, including their dispersion, polarity, and hydrogen bond contributions.62 THF and DOX are better solvents for PEO than pyridine, mainly due to their close dispersion and hydrogen bond terms, while pyridine is a more compatible solvent for PS.
![[small chi, Greek, macron]](https://www.rsc.org/images/entities/i_char_e0d8.gif) of various solvents for the copolymer PS195k-b-PEO45k (
of various solvents for the copolymer PS195k-b-PEO45k (![[small chi, Greek, macron]](https://www.rsc.org/images/entities/i_char_e0d8.gif) trendline = 1.42) and the Hansen solubility parameters for selected solvents and copolymer blocks62
trendline = 1.42) and the Hansen solubility parameters for selected solvents and copolymer blocks62
The calculated Flory–Huggins interaction parameters between the polymer blocks and the solvents are presented in Fig. 4.
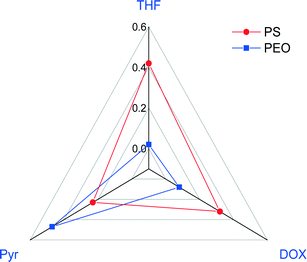 | ||
| Fig. 4 Flory–Huggins interaction parameters between the copolymer blocks (PS-b-PEO) and selected solvents. | ||
The interaction parameters for PEO/THF and PEO/DOX are lower than those for PS/THF and PS/DOX, whereas that for PEO/Pyr is higher than that for PS/Pyr.
To closely fit the trend line, the weight ratio of THF/DOX/Pyr was then optimized to 42/25/33, giving a ![[small chi, Greek, macron]](https://www.rsc.org/images/entities/i_char_e0d8.gif) value of 1.32. By using this fixed solvent composition, PS195k-b-PEO45k membranes were prepared by casting and immersion in water with different polymer concentrations and evaporation times.
value of 1.32. By using this fixed solvent composition, PS195k-b-PEO45k membranes were prepared by casting and immersion in water with different polymer concentrations and evaporation times.
Ordered isoporous membranes were obtained from 19 wt% PS195k-b-PEO45k solutions in 42/25/33 THF/DOX/Pyr with an evaporation time of 10 s. The FESEM and AFM images of the membrane surfaces (Fig. 5) and cross sections (Fig. 6) showed that the membranes had a uniform pore diameter of about 63 nm on the top of a macro porous substructure. In contrast, at a lower polymer concentration of 18 wt%, disordered structures were obtained. The copolymers in THF/DOX binary solvent mixtures had ![[small chi, Greek, macron]](https://www.rsc.org/images/entities/i_char_e0d8.gif) values far above the trend line leading to a non-uniform porous surface. These results show that the trend line can be helpful to find an effective solvent mixture for a certain block copolymer, from which isoporous membranes can be prepared after optimizing the polymer concentration and evaporation time experimentally.
values far above the trend line leading to a non-uniform porous surface. These results show that the trend line can be helpful to find an effective solvent mixture for a certain block copolymer, from which isoporous membranes can be prepared after optimizing the polymer concentration and evaporation time experimentally.
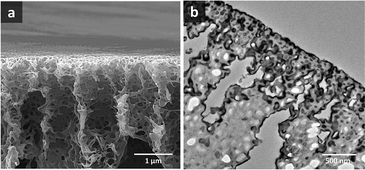 | ||
| Fig. 6 (a) FESEM and (b) TEM images of PS195k-b-PEO45k membrane cross sections (stained with RuO4 prior to TEM imaging). | ||
Membranes with uniform pore sizes were also obtained when binary solvent mixtures were used. THF/Pyr and DOX/Pyr were estimated to produce isoporous membranes since each single solvent leads to ![[small chi, Greek, macron]](https://www.rsc.org/images/entities/i_char_e0d8.gif) values above and below the trend line. The
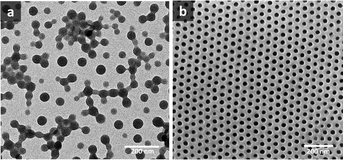
values above and below the trend line. The ![[small chi, Greek, macron]](https://www.rsc.org/images/entities/i_char_e0d8.gif) values for the binary mixtures were 0.82 for 1/1 THF/Pyr and 1.25 for 1/1 DOX/Pyr. Uniform membranes could be obtained with a larger copolymer concentration (20 wt% with 5 s) as shown in Fig. 5. The predictions using the trend line in Fig. 3 were reinforced by TEM investigation using diluted PS195k-b-PEO45k solutions in each solvent or solvent mixture. The images are shown in Fig. 7. Micelles prepared from solvent mixtures, which led to ordered isoporous membranes, were perfectly spherical and well defined. In contrast, micelles prepared from THF/DOX led to an irregularly interconnected structure. These results show that the micelle morphology in dilute solution observed by TEM can serve as screening and indication of suitable solvent mixtures for the ordered final membrane morphology. The micelle deformation and aggregation into larger structures hinder the formation of regular pores in the final membrane. One needs to be aware that this is just an indication. In the semi-dilute regime morphological changes might take place and affect the final structure.
values for the binary mixtures were 0.82 for 1/1 THF/Pyr and 1.25 for 1/1 DOX/Pyr. Uniform membranes could be obtained with a larger copolymer concentration (20 wt% with 5 s) as shown in Fig. 5. The predictions using the trend line in Fig. 3 were reinforced by TEM investigation using diluted PS195k-b-PEO45k solutions in each solvent or solvent mixture. The images are shown in Fig. 7. Micelles prepared from solvent mixtures, which led to ordered isoporous membranes, were perfectly spherical and well defined. In contrast, micelles prepared from THF/DOX led to an irregularly interconnected structure. These results show that the micelle morphology in dilute solution observed by TEM can serve as screening and indication of suitable solvent mixtures for the ordered final membrane morphology. The micelle deformation and aggregation into larger structures hinder the formation of regular pores in the final membrane. One needs to be aware that this is just an indication. In the semi-dilute regime morphological changes might take place and affect the final structure.
Table 4 shows the average hydrodynamic radii (Z-average) measured by dynamic light scattering (DLS) for the dilute solutions of PS195k-b-PEO45k copolymers (0.1 wt%) in various solvent mixtures, which follow the trend line of Fig. 3. The DLS measurements showed that the copolymer formed monodispersed micelles (PDI < 0.25) with Z-average between 24 and 35 nm.
As can be seen in Table 4, the Z-average decreased proportionally with the decrease in the average pore sizes of the membranes produced from the corresponding solvent mixtures. This correlation supports the contribution of the micelle morphology in solution to the final membrane structure.
3.4. Trend line method applied to the new triblock copolymer
The poly(styrene-b-2-vinyl pyridine-b-ethylene oxide) copolymer synthesized with a total molecular weight of 161 kg mol−1 (PS80.5k-b-P2VP64.4k-b-PEO16.1k) was explored for membrane preparation.Self-assembly in this case was expected to have a composite structure of P2VP and PEO as the corona and PS as the core. Accordingly, the solvent composition was chosen to be more selective for P2VP/PEO as the more soluble blocks, while being less soluble for PS.
Analogous to the optimization of PS195k-b-PEO45k membranes, the selection of the solvents for PS80.5k-b-P2VP64.4k-b-PEO16.1k was conducted by estimating the segregation strength which would better fit the trend line in Fig. 3. For the calculation of the Flory–Huggins interaction parameters between the polymer and the solvents, the solubility parameters of the more soluble block (B) were calculated using the volume-weighted average of P2VP and PEO. The Flory–Huggins interaction parameter between the most soluble block (A) and the less soluble block (B), χAB, was estimated using the volume-weighted average between the interaction parameters of PS-P2VP and PS-PEO, which were 0.18 (ref. 63) and 0.08,52 respectively. According to the isoporous trend line, the required for PS80.5k-b-P2VP64.4k-b-PEO16.1k (VA/VB = 1.06) was 0.63.
A mixture of THF/DOX/DMF (51/30/19) was selected as the effective solvent mixture for the membrane preparation. The dimensionless parameters ![[small chi, Greek, macron]](https://www.rsc.org/images/entities/i_char_e0d8.gif) for the single solvents were 0.22 for THF, −0.31 for DOX, and 2.36 for DMF. In the solvent mixture of THF/DOX/DMF, the high value of
for the single solvents were 0.22 for THF, −0.31 for DOX, and 2.36 for DMF. In the solvent mixture of THF/DOX/DMF, the high value of ![[small chi, Greek, macron]](https://www.rsc.org/images/entities/i_char_e0d8.gif) from DMF was counterbalanced by THF and DOX, which had
from DMF was counterbalanced by THF and DOX, which had ![[small chi, Greek, macron]](https://www.rsc.org/images/entities/i_char_e0d8.gif) lower than the trend line. By adjusting the composition of THF/DOX/DMF to a 51/30/19 weight ratio, the
lower than the trend line. By adjusting the composition of THF/DOX/DMF to a 51/30/19 weight ratio, the ![[small chi, Greek, macron]](https://www.rsc.org/images/entities/i_char_e0d8.gif) of the mixture could be well fitted to the trend line.
of the mixture could be well fitted to the trend line.
Fig. 8 shows a TEM image of the PS80.5k-b-P2VP64.4k-b-PEO16.1k micelles formed using 51/30/19 THF/DOX/DMF. Well-defined spherical micelles were obtained, similar to the diblock copolymer in Fig. 7a. Membranes were then fabricated using the same solvent composition with different polymer concentrations and evaporation times. 25 wt% copolymer and an evaporation time of 10 s led to isoporous PS80.5k-b-P2VP64.4k-b-PEO16.1k membranes. A FESEM image of the surface is seen in Fig. 8, with hexagonally ordered pores of average diameter 29 ± 2 nm. DLS measurements confirmed a narrow micelle size distribution with a Z-average of about 20 nm (PdI = 0.05). FESEM and TEM micrographs of the membrane cross-sections are shown in Fig. 9. Ordered cylindrical pores are seen in the top layer of about 200 nm.
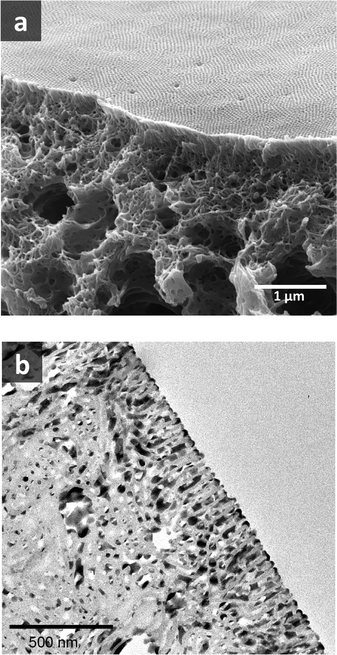 | ||
| Fig. 9 (a) FESEM and (b) TEM images of PS80.5k-b-P2VP64.4k-b-PEO16.1k membrane cross-sections. For TEM, the membrane was stained with RuO4. | ||
3.5. Time-resolved pore formation experiments
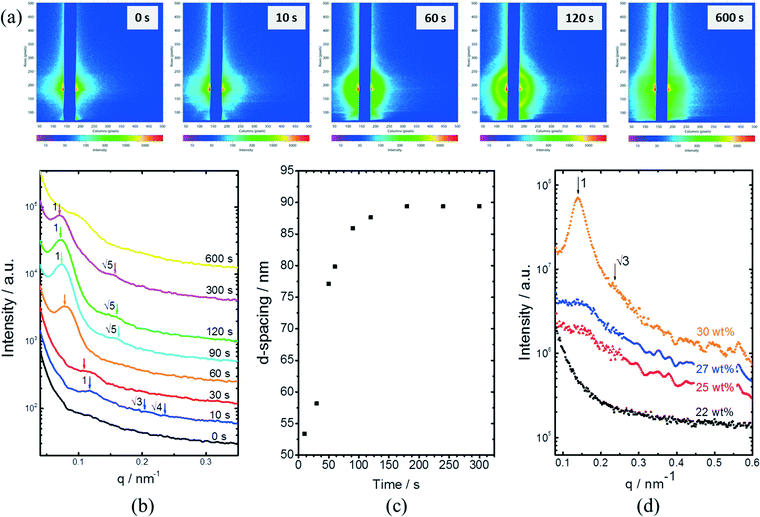
In situ GISAXS experiments were performed to study the evolution of the film morphology as the solution was cast and the solvent evaporated. Two-dimensional GISAXS patterns and scattering curves for the films cast from 25 wt% PS80.5k-b-P2VP64.4k-b-PEO16.1k in 51/30/19 THF/DOX/DMF are presented in Fig. 10a and b, respectively. Order evolves as evaporation proceeds. From the scattering curve in Fig. 10b, a peak around 0.12 nm−1 was detected for the evaporation time of 10 s, which corresponded to a d-spacing of 53 nm. The calculated d-spacing is similar to the distances between the pore centers measured from the membrane FESEM micrograph (53 ± 2 nm). The arrows in the scattering curve for 10 s of evaporation are attributed to the first three terms of the characteristic ratio of the hexagonal structures (1, , and
, and  ).64 The q values close to this ratio could be detected from the scattering curve for the evaporation time of 10 s after fitting with Gaussian functions.
The ring at the evaporation time of 10 s smeared out as the evaporation proceeded, but then another ring with a high intensity was observed for higher evaporation times. This ring disappeared as the film completely dried at 600 s. From the scattering curves of 60 s to 300 s in Fig. 10b, this high-intensity ring corresponded to the scattering peaks around 0.07 nm−1, which is attributed to a d-spacing of around 90 nm. Fig. 10c shows that the d-spacing increased as the evaporation proceeded until it reached a relatively constant value after 120 s. This result possibly indicated the formation of bigger aggregates as the polymer concentration increased in the film. As the most volatile solvents (THF and DOX) evaporated, the film was richer in the least volatile solvent (DMF), which was a more selective solvent for P2VP/PEO blocks. The PS blocks, therefore, tended to aggregate while trying to minimize interactions with the solvent. The scattering curves from 90 s to 300 s also showed shoulders at a characteristic ratio of  , which is one of the characteristic ratios of body-centered cubic (BCC) structures.64 It indicated that a completely different structure from that of the 10 s evaporation time was formed. Overall, the observed GISAXS patterns exhibited a similar trend to the evolution of the membrane structures produced at increasing evaporation times. At an optimum polymer concentration and solvent mixture, regular pores were formed at a certain time after casting, and the ordered structures disappeared as the evaporation time increased.33
Fig. 10d shows the SAXS patterns of the bulk of the polymer solution with various concentrations. For polymer concentrations lower than 25 wt%, no particular order could be observed. A broad peak around 0.15 nm−1 developed for the polymer concentration identical to the casting solution, and higher. The peaks at these concentrations correlated to a d-spacing of 18–19 nm, which was close to the hydrodynamic radii of the micelles of about 20 nm, as detected from the DLS measurement of the dilute solution. A sharper peak around 0.14 nm−1 can be clearly seen for the polymer concentration of 30 wt%. This peak corresponded to a d-spacing of around 27 nm, which was close to the average pore diameter of the PS80.5k-b-P2VP64.4k-b-PEO16.1k membranes of 29 ± 2 nm. At this higher concentration, the bulk state was closer to that on the film surface as the solvent evaporated and created a more concentrated layer at the top of the film. A shoulder around the characteristic ratio of  , which was one of the hexagonal order characteristics, also started to appear at 30 wt% polymer concentration.
The d-spacing values obtained from SAXS measurements were lower than that observed from GISAXS. This result is consistent with our previous findings for the PS-b-P4VP copolymer.42 At semi-dilute concentrations, micellar entities are close to each other, and, therefore, the SAXS measurement reflects the inter-micellar distances in the solution bulk. The GISAXS measurement, on the other hand, characterizes more surface effects and the first bulk sub-layers.
4. Conclusions
A simple method to select the best solvent compositions for manufacturing isoporous block copolymers was proposed. The method is based (i) on a guiding trend line calculated from the segregation strength analysis of the polymer–solvent mixtures, using Flory–Huggins interaction parameters and Hansen solubility parameter data, supported by (ii) TEM imaging micelles in dilute solutions. The proposed theoretical method was validated by effectively using it to prepare isoporous membranes from a diblock and a triblock copolymer not tested before: PS195k-b-PEO45k and PS80.5k-b-P2VP64.4k-b-PEO16.1k. Various solvent mixtures containing THF, DOX, and pyridine were identified as potentially useful for the manufacture of isoporous membranes. THF/DOX/DMF was used as an effective solvent system to fabricate PS80.5k-b-P2VP64.4k-b-PEO16.1k isoporous membranes with a long-range order. The proposed method based on a trend line can be extended to other copolymer systems and is expected to shorten the development time when new copolymers are tested. Identifying the most suitable solvent mixture for a block copolymer is the first and most essential step in the successful manufacture of isoporous membranes. In addition to solvent composition, polymer concentration and molecular weight are relevant parameters, which influence order and pore size.Time resolved GISAXS experiments were conducted to follow the pore formation by casting PS80.5k-b-P2VP64.4k-b-PEO16.1k solutions, which were partially evaporated before immersion in water. d-spacing values of 53 nm were measured, which are close to the interpore distance in the final membranes.
Acknowledgements
This work was funded by King Abdullah University of Science and Technology (KAUST) Grant 1671 - CRG2. The authors acknowledge the CHESS at Cornell, USA and the LNLS in Brazil for access to the GISAXS and SAXS synchrotron facilities. The Cornell High Energy Synchrotron Source (CHESS) is supported by the National Science Foundation and the National Institutes of Health/National Institute of General Medical Sciences under NSF award DMR-1332208.References
- K. Kazunori, Y. Masayuki, O. Teruo and S. Yasuhisa, J. Controlled Release, 1993, 24, 119–132 CrossRef
.
- K. Kataoka, A. Harada and Y. Nagasaki, Adv. Drug Delivery Rev., 2001, 47, 113–131 CrossRef CAS PubMed
.
- G. Gaucher, M.-H. Dufresne, V. P. Sant, N. Kang, D. Maysinger and J.-C. Leroux, J. Controlled Release, 2005, 109, 169–188 CrossRef CAS PubMed
.
- S. Klingelhöfer, W. Heitz, A. Greiner, S. Oestreich, S. Förster and M. Antonietti, J. Am. Chem. Soc., 1997, 119, 10116–10120 CrossRef
.
- Z. Ge, D. Xie, D. Chen, X. Jiang, Y. Zhang, H. Liu and S. Liu, Macromolecules, 2007, 40, 3538–3546 CrossRef CAS
.
- S. Park, D. H. Lee, J. Xu, B. Kim, S. W. Hong, U. Jeong, T. Xu and T. P. Russell, Science, 2009, 323, 1030 CrossRef CAS PubMed
.
- T. Hashimoto, M. Shibayama and H. Kawai, Macromolecules, 1980, 13, 1237–1247 CrossRef CAS
.
- L. Leibler, Macromolecules, 1980, 13, 1602–1617 CrossRef CAS
.
- E. L. Thomas, D. B. Alward, D. J. Kinning, D. C. Martin, D. L. Handlin Jr and L. J. Fetters, Macromolecules, 1986, 19, 2197–2202 CrossRef CAS
.
- Y. Mogi, K. Mori, Y. Matsushita and I. Noda, Macromolecules, 1992, 25, 5412–5415 CrossRef CAS
.
- S. P. Gido, D. W. Schwark, E. L. Thomas and M. do Carmo Goncalves, Macromolecules, 1993, 26, 2636–2640 CrossRef CAS
.
- U. Breiner, U. Krappe, E. L. Thomas and R. Stadler, Macromolecules, 1998, 31, 135–141 CrossRef CAS
.
- A. Avgeropoulos, B. J. Dair, N. Hadjichristidis and E. L. Thomas, Macromolecules, 1997, 30, 5634–5642 CrossRef CAS
.
- F. S. Bates, M. A. Hillmyer, T. P. Lodge, C. M. Bates, K. T. Delaney and G. H. Fredrickson, Science, 2012, 434, 440 Search PubMed
.
- F. S. Bates and G. H. Fredrickson, Phys. Today, 1999, 52, 32 CrossRef CAS
.
- C. I. Huang and T. P. Lodge, Macromolecules, 1998, 31, 3556–3565 CrossRef CAS
.
- Y. Mai and A. Eisenberg, Chem. Soc. Rev., 2012, 41, 5969–5985 RSC
.
- M. J. Derry, L. A. Fielding and S. P. Armes, Prog. Polym. Sci., 2016, 52, 1–18 CrossRef CAS
.
- A. F. Hannon, W. Bai, A. Alexander-Katz and C. Ross, Soft Matter, 2015, 11, 3794–3805 RSC
.
- G. A. McConnell and A. P. Gast, Macromolecules, 1997, 30, 435–444 CrossRef CAS
.
- I. Hamley, J. Fairclough, A. Ryan, C. Ryu, T. Lodge, A. Gleeson and J. Pedersen, Macromolecules, 1998, 31, 1188–1196 CrossRef CAS
.
- S.-H. Choi, F. S. Bates and T. P. Lodge, Macromolecules, 2014, 47, 7978–7986 CrossRef CAS
.
- L. Zhang and A. Eisenberg, Polym. Adv. Technol., 1998, 9, 677–699 CrossRef CAS
.
- C. Nardin, T. Hirt, J. Leukel and W. Meier, Langmuir, 2000, 16, 1035–1041 CrossRef CAS
.
- P. Tanner, P. Baumann, R. Enea, O. Onaca, C. Palivan and W. Meier, Acc. Chem. Res., 2011, 44, 1039–1049 CrossRef CAS PubMed
.
- N. J. Warren and S. P. Armes, J. Am. Chem. Soc., 2014, 136, 10174–10185 CrossRef CAS PubMed
.
- S. P. Nunes, R. Sougrat, B. Hooghan, D. H. Anjum, A. R. Behzad, L. Zhao, N. Pradeep, I. Pinnau, U. Vainio and K. V. Peinemann, Macromolecules, 2010, 43, 8079–8085 CrossRef CAS
.
- S. P. Nunes, Macromolecules, 2016, 49, 2905–2916 CrossRef CAS
.
- W. A. Phillip, R. Mika Dorin, J. Werner, E. M. V. Hoek, U. Wiesner and M. Elimelech, Nano Lett., 2011, 11, 2892–2900 CrossRef CAS PubMed
.
- K.-V. Peinemann, V. Abetz and P. F. Simon, Nat. Mater., 2007, 6, 992–996 CrossRef CAS PubMed
.
- S. P. Nunes, R. Sougrat, B. Hooghan, D. H. Anjum, A. R. Behzad, L. Zhao, N. Pradeep, I. Pinnau, U. Vainio and K.-V. Peinemann, Macromolecules, 2010, 43, 8079–8085 CrossRef CAS
.
- W. A. Phillip, R. Mika Dorin, J. R. Werner, E. M. Hoek, U. Wiesner and M. Elimelech, Nano Lett., 2011, 11, 2892–2900 CrossRef CAS PubMed
.
- M. Karunakaran, S. P. Nunes, X. Qiu, H. Yu and K.-V. Peinemann, J. Membr. Sci., 2014, 453, 471–477 CrossRef CAS
.
- J. Hahn, V. Filiz, S. Rangou, J. Clodt, A. Jung, K. Buhr, C. Abetz and V. Abetz, J. Polym. Sci., Part B: Polym. Phys., 2013, 51, 281–290 CrossRef CAS
.
- D. S. Marques, U. Vainio, N. M. Chaparro, V. M. Calo, A. R. Bezahd, J. W. Pitera, K.-V. Peinemann and S. P. Nunes, Soft Matter, 2013, 9, 5557–5564 RSC
.
- N. Moreno, S. P. Nunes, K.-V. Peinemann and V. M. Calo, Macromolecules, 2015, 48, 8036–8044 CrossRef CAS
.
- N. Hadjichristidis, M. Pitsikalis, S. Pispas and H. Iatrou, Chem. Rev., 2001, 101, 3747–3792 CrossRef CAS PubMed
.
- N. Ekizoglou and N. Hadjichristidis, J. Polym. Sci., Part A: Polym. Chem., 2001, 39, 1198–1202 CrossRef CAS
.
- G. Floudas, B. Vazaiou, F. Schipper, R. Ulrich, U. Wiesner, H. Iatrou and N. Hadjichristidis, Macromolecules, 2001, 34, 2947–2957 CrossRef CAS
.
- G. Koutalas, S. Pispas and N. Hadjichristidis, Eur. Phys. J. E: Soft Matter Biol. Phys., 2004, 15, 457–464 CrossRef CAS PubMed
.
- J. Zhao, D. Pahovnik, Y. Gnanou and N. Hadjichristidis, Macromolecules, 2014, 47, 1693–1698 CrossRef CAS
.
- D. S. Marques, R. M. Dorin, U. Wiesner, D.-M. Smilgies, A. R. Behzad, U. Vainio, K.-V. Peinemann and S. P. Nunes, Polymer, 2014, 55, 1327–1332 CrossRef CAS
.
- D. M. Smilgies, R. Li, G. Giri, K. W. Chou, Y. Diao, Z. Bao and A. Amassian, Phys. Status Solidi RRL, 2013, 7, 177–179 CrossRef CAS
.
- M. Orlov, I. Tokarev, A. Scholl, A. Doran and S. Minko, Macromolecules, 2007, 40, 2086–2091 CrossRef CAS
.
- S. Kang, A. Asatekin, A. M. Mayes and M. Elimelech, J. Membr. Sci., 2007, 296, 42–50 CrossRef CAS
.
- W. van Zoelen, H. G. Buss, N. C. Ellebracht, N. A. Lynd, D. A. Fischer, J. Finlay, S. Hill, M. E. Callow, J. A. Callow and E. J. Kramer, ACS Macro Lett., 2014, 3, 364–368 CrossRef CAS
.
- X. Qiu, H. Yu, M. Karunakaran, N. Pradeep, S. P. Nunes and K.-V. Peinemann, ACS Nano, 2012, 7, 768–776 CrossRef PubMed
.
- R. Hilke, N. Pradeep, A. R. Behzad, S. P. Nunes and K.-V. Peinemann, J. Membr. Sci., 2014, 472, 39–44 CrossRef CAS
.
- R. M. Dorin, D. B. S. Marques, H. Sai, U. Vainio, W. A. Phillip, K.-V. Peinemann, S. P. Nunes and U. Wiesner, ACS Macro Lett., 2012, 1, 614–617 CrossRef CAS
.
- S. P. Nunes, M. Karunakaran, N. Pradeep, A. R. Behzad, B. Hooghan, R. Sougrat, H. He and K.-V. Peinemann, Langmuir, 2011, 27, 10184–10190 CrossRef CAS PubMed
.
- G. Alberda van Ekenstein, R. Meyboom, G. Ten Brinke and O. Ikkala, Macromolecules, 2000, 33, 3752–3756 CrossRef CAS
.
- Z.-L. Wang, J.-T. Xu, B.-Y. Du and Z.-Q. Fan, J. Colloid Interface Sci., 2012, 384, 29–37 CrossRef CAS PubMed
.
- T. P. Lodge, J. Bang, M. J. Park and K. Char, Phys. Rev. Lett., 2004, 92, 145501 CrossRef PubMed
.
- P. Madhavan, K.-V. Peinemann and S. P. Nunes, ACS Appl. Mater. Interfaces, 2013, 5, 7152–7159 CAS
.
- J. Noolandi and K. M. Hong, Macromolecules, 1983, 16, 1443–1448 CrossRef CAS
.
- X. Yuan, A. Masters and C. Price, Macromolecules, 1992, 25, 6876–6884 CrossRef CAS
.
- H. Shen and A. Eisenberg, J. Phys. Chem. B, 1999, 103, 9473–9487 CrossRef CAS
.
- L. Chen, H. Shen and A. Eisenberg, J. Phys. Chem. B, 1999, 103, 9488–9497 CrossRef CAS
.
- L. Zhang and A. Eisenberg, Macromolecules, 1999, 32, 2239–2249 CrossRef CAS
.
- A. Choucair and A. Eisenberg, Eur. Phys. J. E: Soft Matter Biol. Phys., 2003, 10, 37–44 CrossRef CAS PubMed
.
- J. Bang, S. Jain, Z. Li, T. P. Lodge, J. S. Pedersen, E. Kesselman and Y. Talmon, Macromolecules, 2006, 39, 1199–1208 CrossRef CAS
.
-
C. M. Hansen, Hansen solubility parameters: a user's handbook, CRC press, 2007 Search PubMed
.
- K. H. Dai and E. J. Kramer, Polymer, 1994, 35, 157–161 CrossRef CAS
.
- I. W. Hamley and V. Castelletto, Prog. Polym. Sci., 2004, 29, 909–948 CAS
.
| This journal is © The Royal Society of Chemistry 2016 |

![[M with combining macron]](https://www.rsc.org/images/entities/i_char_004d_0304.gif)
