Carbon monoxide adsorption on the single-walled carbon nanotube supported gold–silver nanoalloys†
Hamed
Akbarzadeh
*,
Mohsen
Abbaspour
and
Sirous
Salemi
Department of Chemistry, Faculty of Basic Sciences, Hakim Sabzevari University, 96179-76487 Sabzevar, Iran. E-mail: akbarzadehhamed@yahoo.com; Fax: +98 571 400332; Tel: +98 915 3008670
First published on 30th October 2015
Abstract
We have investigated CO adsorption on the (Ag–Au)N nanoalloys supported on carbon nanotubes (CNTs) at different temperatures and pressures via MD simulation. We have studied many of the possible effects; the effects of the nanoalloy size, nanocluster mole fraction, CNT diameter, and CNT chirality, and the effect of the support on the thermodynamic, structural, and dynamic properties of the CO adsorption on the supported nanoalloys. Our results indicated that the nanoalloy size and mole fraction have considerable influences on the adsorption phenomena. The smaller nanoalloys with more Au mole fraction have more saturation coverage than the bigger nanoalloys with less gold atoms. Our simulations also indicated that the CNT diameter has significant influences on the CO adsorption. The coverage on the nanoalloy surface increases upon decreasing the diameter of the nanotube. The calculations also showed that there is a small difference between the results of the two CNT configurations. The saturation value of coverage is a little more for the nanoalloy deposited on the zigzag CNT than the armchair one. It is also shown that the enthalpy and entropy changes of adsorption, radial distribution functions, and self-diffusion coefficients respond to the different effects in consistent with the adsorption isotherms.
1. Introduction
Metallic nanoclusters have interesting physical, chemical, and electronic properties which made them different from bulk materials.1,2 Many of these differences are caused by their large fraction of surface atoms which has made these materials candidates for the new generation of sensors and biosensors.3 Core/shell and alloy bimetallic nanoparticles are especially interesting because they provide opportunities to tune the nanocluster optical and catalytic properties4–7 and are potentially useful as taggants for security applications.8 In particular, Ag–Au nanoalloys exhibit catalytic effects and superiority over their monometallic counterparts, e.g., in glucose oxidation,9 low-temperature CO oxidation,10–12 and aerobic oxidation of alcohol.13 The Au–Ag bimetallic nanoparticles show also different optical responses towards alloy and core–shell configurations. Au–Ag alloy nanoparticles show a single composition-sensitive absorption band which results in the surface-enhanced Raman scattering (SERS) effect.14,15Carbon monoxide is a touchstone adsorbate; on the other hand, it is a key reagent in methanol synthesis over oxide-supported catalysts.16 CO adsorption on metal electrodes can be considered as a model system in electrocatalysis and interfacial electrochemistry, in such a way that it can be used as a probe molecule to obtain some information about the surface structure and its morphology using various spectroscopic methods such as infrared spectroscopy.17 It is noticeable that CO adsorption on metal clusters may have different characteristics in comparison with macroscopic surfaces due to the large surface/volume ratio in clusters. Also, the thermodynamic properties of clusters usually are size dependent. The adsorption of CO on the nanoclusters has been a subject of numerous experimental and theoretical studies concerning their structural, dynamical, electronic, and thermodynamic properties. For example, Wang et al.18 calculated the adsorption energy of CO molecules on the Ag and Au nanoclusters using the DFT method. They reported −10.15 kcal mol−1 for the adsorption energy of CO on Ag55 nanoclusters. Popolan et al.19 and Kim et al.20 indicated that the high exibility of the Ag–Au nanoalloy structure may be responsible for the increased catalytic activity of Ag–Au nanoalloys in CO oxidation. Bloch et al.21 investigated the adsorption of CO on the large pore sized Ag/SiO2 nanocomposite using the microcalorimetric method. Their results indicate that the Ag/SiO2 nanocomposite can be considered as an interesting candidate for the adsorption of trace amounts of CO in the presence of CO2. Tang et al.22 studied the CO adsorption on the Au and Ag nanoclusters using the ab initio methods. Their computational results indicated that CO adsorption energy on the Ag55 cluster varies from −10.38 to −11.30 kcal mol−1, depending on the type of adsorption site. Fleischer et al.23 investigated composition-dependent selectivity in the co-adsorption of water and CO on pure and binary Ag–Au nanoalloys.
The catalytic properties of a metal cluster are modified substantially by anchoring it to support surfaces.24,25 The thermal, structural and dynamic properties of metallic clusters supported on surfaces have also attracted much attention lately.24–32 Supported gold and gold alloy nanoparticles have been found to be highly active and selective in a variety of important catalytic reactions, particularly when the particles are only a few nm in size.33–40 Also, the large surface area of carbon nanotubes (CNTs) provides the possibility to deposit metallic nanoparticles on their surface in order to enhance their properties.41,42 CNTs are considered as one of the important nanomaterials, which are of interest to many theoretical and experimental scientists due to their key physical and chemical properties.43–46 Therefore, both CNTs and metallic nanoclusters have unique and interesting properties and the integration of CNTs with metallic nanoclusters can lead to novel properties which may create major revolutions in relevant technologies. Moreover, one of the important phenomena on the nanoclusters and CNTs is the adsorption of gases.47 Since, the numbers of molecules which can be adsorbed on the metallic nanoclusters are considerably larger than CNTs, in the chemical point of view, the modification of CNTs with metallic nanoclusters can also overcome the many limitations and disadvantages of them.
There are many theoretical investigations on the adsorption of gases on the CNTs and their composites. Many of these studies are related to the CO gas adsorption on these materials. Penza et al.48 deposited Au nanoclusters on single walled carbon nanotubes in order to create a gas sensor for CO molecules. Hrapovic et al.49 deposited Au nanoclusters on the CNTs with different diameters in order to electrochemically determinate explosive nitroaromatic compounds. Shamkhali and Akbarzadeh32 studied the adsorption of H2 on a bundle of single-walled carbon nanotubes (SWCNTs) and an Ag–Cu bimetallic nanoalloy located on the groove site of the bundle by molecular dynamics (MD) simulation. Their simulations were performed in order to study the effect of the Ag mole fraction and the diameter of the nanotube on the H2 adsorption. Recently, Akbarzadeh et al.31 performed MD simulations to study CO adsorption on Ag nanoclusters supported on carbon nanotubes under various gas pressures at different temperatures. They found that the nanocluster structural changes are irreversible in such a way that by gradually decreasing the gas pressure to zero, the nanocluster geometry is not reversed to its initial structure under vacuum conditions. They also found that structural irreversibility increases with the size. More recently, Akbarzadeh and Shamkhali50 studied H2 physisorption on AgN/carbon-nanotube composites by MD simulation in order to investigate the effect of the nanocluster size, diameter and chirality of the nanotube on the adsorption phenomena. Their calculations indicated that the increase of nanocluster size decreases the H2 adsorption. Also, as the diameter of the nanotube is increased, the amount of adsorption decreased.
In this work, we have performed MD simulation to investigate CO adsorption on (Ag–Au)N (with N = 32, 108, 256, 500, and 864) nanoalloys supported on the carbon nanotubes at different temperatures and pressures. We have studied many of the possible effects; the effects of the nanoalloy size, nanoalloy mole fraction, CNT diameter, and CNT chirality, and the effect of the support on the thermodynamic, structural, and dynamic properties of the CO adsorption on the supported nanoalloy. In fact, the investigation of the shape, structural type, and composition of bimetallic Ag–Au nanoparticles in the presence of gas is vitally important if real-world applications are to be achieved.15,51
2. Simulation details
The QSC potential has been widely applied in the simulation studies of nanoclusters and the simulated results using this potential are consistent with the experiments for low-dimensional systems and bulk.52–55 Therefore, the Ag–Ag, Au–Au and Ag–Au interactions were modeled using the quantum Sutton–Chen (QSC) potential. The parameters of the QSC potential for the metal atom interactions have been reported in Table S1 in the ESI.†As we have described in the previous studies,30,31,50,56 we considered two different forcefields for the CNT substrate:
(1) The carbon atoms of the CNT were fixed in their positions
(2) The optimized Tersoff potential57 was used for the C–C interactions of the CNT.
We compared the results obtained from the both models. There was no significant difference between the results of the two models. The reason is that the carbon support is a “bulk” extended surface which cannot be affected by the presence of the nanoclusters.30 Therefore, in order to reduce the computational costs, the carbon atoms of the CNT were fixed in their positions (we have considered the CNT as a static surface).
CO molecules were considered as two-site models with a fixed interatomic distance of 1.163 Å.58 Furthermore, the charge of C and O atoms in the CO molecule is +0.107 and −0.107 au,58 respectively. The rest interactions (CO–CO, CO–Ag, CO–Au, Ag–CNT, Au–CNT and CO–CNT) were modeled by Lennard-Jones 12-6 potential.59 Previous studies also used the LJ potential for the CO–metal interactions successfully.30,56 The LJ parameters for the different interactions have been presented in Table S2 in the ESI.†
In order to investigate the accuracy of the force fields used in our simulations, we ran a test simulation and compared our results of the CO adsorption on the Ag–Au nanoclusters with those results using the DFT calculations.4 In order to do this, we simulated the adsorption energy of CO molecules on the Au25Ag30 nanocluster using:
| Eadsorption = EAuAg–CO − ECO − EAgAu | (1) |
MD simulations were performed on the Ag–Au nanoalloy with fcc structure, supported on the CNT surface using the DLPOLY 4.03.60 At first, the nanoclusters were annealed in the vacuum and then the annealed clusters were supported on the nanotube. The MD simulations were carried out in the canonical ensemble (NVT) using a Berendsen thermostat with a relaxation time of 0.2 ps.61 The equations of motion were integrated using the Verlet-leapfrog algorithm with a time step of 1 fs.62 The simulations were carried out for 1 ns of equilibration followed by a production time of 2 ns for calculated properties. All interatomic interactions between the atoms in the simulation box were calculated within the cutoff distance of 10 Å. Periodic boundary conditions were added in all directions. Five temperatures (100, 300, 400, 500, and 700 K) were considered for investigating the temperature dependence of adsorption.
In order to investigate the effect of the size of the Ag–Au nanoalloy, five fcc-like (Ag–Au)N nanoalloys with (N = 32, 108, 256, 500, and 864 Ag atoms) were placed 3 Å above the CNT surface. For each composition considered, the suitable numbers of atoms (10%, 30%, 50%, 70% and 90%), selected randomly, were designated as Au atoms, with the remaining atoms designated as Ag. It should be also noted that for a given Ag–Au nanocluster, different structures are more stable depending on their compositions.55,63 For example, it is shown in many previous studies that the icosahedron (Ih) is a more stable structure for the nanoclusters which have higher mole fractions of Ag. But, the fcc is a more stable structure for the clusters with the higher Au mole fractions.63 Therefore, in this study we have not investigated the shape effects of the nanoclusters and because all of the nanoclusters have been initially annealed to equilibrate, the selection of the fcc as the starting structure for the nanoclusters is appropriate. In the other words, because of the annealing of the initial structures, the selection of any structure (with any kind of chemical disorder) does not affect the results.
In order to investigate the effect of the diameter of the CNT, we have chosen five zigzag nanotubes (8,0), (13,0), (18,0), (30,0) and (40,0). The diameters of different CNTs have been presented in Table S3 in the ESI.† Also, to investigate the effect of the chirality of the CNT, we have chosen two CNTs with chiralities of (18,0) and (10,10) which have the similar diameters. We also considered the length of the CNTs as 50 Å in all simulation runs.
The initial simulation box was composed of the annealed cluster on the CNT, together with 400 CO molecules at random positions. Various gas pressures at constant volume and temperature were created in the simulation box by changing the number of CO molecules using the van der Waals equation of state.31 The details of the method of exerting pressure on the nanoclusters have been described in ref. 29, 31 and 56. We have also presented the snapshots of the CO adsorption and also the structural changes of the Ag–Au256 nanoalloy with xAu = 0.5 supported on the (18,0) CNT at 300 K in the ESI† (Fig. S1).
3. Results and discussion
3.1 Effect of the nanoalloy size
We have calculated the adsorption isotherms Nads/Nsurfversus pressure (Nads is the number of adsorbates and Nsurf is the total number of nanoalloy surface atoms), for CO adsorption on the (Ag–Au)N nanoalloys (with N = 32, 108, 256, 500, and 864) with xAu = 0.5 supported on the (18,0) CNT at 100 K and presented in Fig. 1.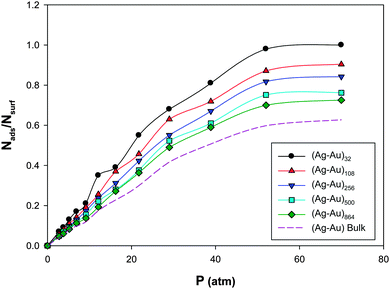 | ||
| Fig. 1 The adsorption isotherms for CO adsorption on the Ag–AuN nanoalloys with xAu = 0.5 supported on the 18,0 CNT at 100 K. | ||
We have also presented the CO adsorption on the Ag–Au bulk in this figure which clearly shows that the CO adsorptions on the nanoclusters are more than the bulk. According to Fig. 1, under constant temperature and pressure conditions, the smaller nanoalloys have more coverage than larger ones which is due to the lower number of surface atoms and adsorption sites in smaller nanoalloys. Also, these isotherms, with good approximation, can be fitted to Langmuir-type (I) in IUPAC classification64 which implies a monolayer adsorption regime. The similar results have been also reported by Akbarzadeh et al.31 for CO adsorption on the Ag nanoclusters with different numbers of atoms supported on the CNT. Also, Akbarzadeh and Shamkhali50 reported that the increase of supported Ag nanocluster size decreases the H2 adsorption.
We have also calculated the adsorption isotherms for CO gas on the supported nanoalloys at different temperatures. Then, we calculated log(P/P0) versus the inverse of temperature for the adsorption isotherms. The Clausius–Clapeyron equation describes the relationship between the natural logarithm of P/P0 and 1/T as:
 | (2) |
| Nanoalloy size | ΔHads (kcal mol−1) | ΔSads (cal K−1 mol−1) |
|---|---|---|
| 32.0000 | −4.9000 | −53.4500 |
| 108.0000 | −3.8500 | −43.0170 |
| 256.0000 | −3.6700 | −41.3745 |
| 500.0000 | −3.5050 | −39.9397 |
| 864.0000 | −3.4430 | −39.4511 |
According to Table 1, the higher absolute values for the enthalpy of adsorption are achieved at the lower cluster size. It is also shown that the absolute value of enthalpy of adsorption increases sharply with decreasing cluster size, from 3.85 to 4.9 kcal mol−1. This is due to the lower cohesive energy of smaller nanoalloys. In the other words, the larger surface/volume ratio in the small nanoalloys leads to the decrease of cohesive energy, and surface atoms have more tendencies to adsorb CO molecules in order to increase their cohesive energy.
The entropy changes of adsorption of CO gas on the different nanoalloys have been also presented in Table 1. According to this table, the entropy change of adsorption decreases sharply upon decreasing the cluster size. This result is in agreement with the enthalpy change in this table. The CO molecules have greater interactions with the smaller nanoalloy and so they get lower freedom which results in the lower values of the entropy changes. In the other words, as the size of the nanoalloy decreases, the surface/volume ratio increases and so the cohesive energy decreases. Therefore, the cohesive energy of the surface atoms is smaller and so they have more tendency to adsorb the CO molecules and so the freedom of the CO molecules decreases and the entropy decreases.
In order to investigate the structural changes after the CO adsorption, we have calculated the in-plane correlation function which is typically used to analyze the structure and the phase of a confined molecular system.65 The in-plane pair correlation function, or in-plane radial distribution function, can be estimated for each layer of a confined liquid/solid using the following expression:65
 | (3) |
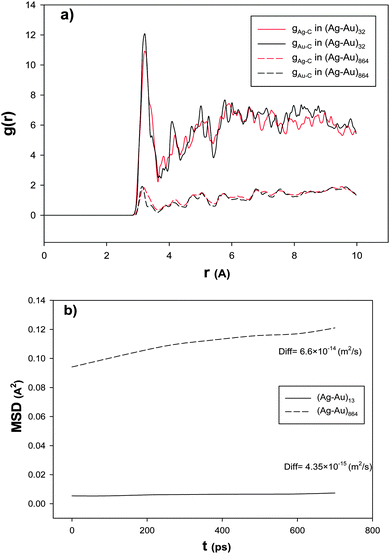 | ||
| Fig. 2 The (a) RDFs and (b) mean square displacements, MSD, and self-diffusion coefficients, Diff, for the smallest and largest nanoalloys with xAu = 0.5 supported on the 18,0 CNT at 100 K. | ||
In order to examine the nanoalloy diffusion after the adsorption, we have calculated the mean square displacement (MSD) and self-diffusion coefficient (Diff) for the smallest and largest nanoalloys with xAu = 0.5 supported on the (18,0) CNT at 100 K and presented in Fig. 2b. According to this figure, the smallest nanoalloy has much slower dynamics than the largest one. This result is in agreement with Fig. 2a. It means that the smaller nanoalloy has greater interaction with the CNT and so it has higher RDF and smaller diffusion coefficients. Our results of the effect of the nanocluster size are also in agreement with the previous DFT and experimental studies about the CO adsorption on the Ag nanoclusters.4,66–69
3.2 Effect of the nanoalloy mole fraction
We have calculated the adsorption isotherms for CO adsorption on the (Ag–Au)256 nanoalloys with different Au mole fractions supported on the (18,0) CNT at 100 K and presented in Fig. 3. According to this figure, it is shown that the saturation value of coverage increases as the mole fraction of Au is increased. This is due to the greater Au–CO interaction than the Ag–CO interaction. It is also expected and shown that the isotherms for the different Au mole fractions are similar. This similarity is due to the fact that the adsorption of CO on the nanoalloy is a physical characteristic and physisorption is not usually site dependent.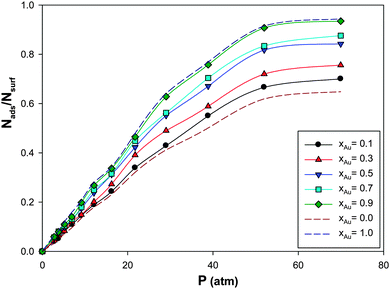 | ||
| Fig. 3 The adsorption isotherms for CO adsorption on the Ag–Au256 nanoalloys with different Au mole fractions supported on the 18,0 CNT at 100 K. | ||
The enthalpy change of CO adsorption on the supported nanoalloys with the different Au mole fractions has been also presented in Table 2. According to this table, the enthalpy changes are lower than 40 kJ mol−1 and so the adsorption of CO on the Ag–Au nanoclusters is physisorption.
| x Au | ΔHads (kcal mol−1) | ΔSads (cal K−1 mol−1) |
|---|---|---|
| 0.1 | −3.28 | −37.2545 |
| 0.3 | −3.37 | −38.2374 |
| 0.5 | −3.67 | −41.3745 |
| 0.7 | −4.01 | −45.0532 |
| 0.9 | −4.25 | −47.6144 |
It is shown that the absolute value of ΔHads increases upon increasing the xAu value which is due to the greater Au–CO interaction than the Ag–CO interaction. This result is also in agreement with Fig. 3 in which the saturation value of the coverage increases as the mole fraction of Au is increased. The entropy changes of adsorption of CO gas on different nanoalloys have been also presented in Table 2. According to this table, the entropy change of adsorption decreases upon increasing the Au mole fraction which is also in agreement with the enthalpy changes.
In order to investigate the effect of the Au mole fraction on the RDF after the CO adsorption, we have calculated Ag–C and Au–C RDFs for the nanoalloys with xAu = 0.3 and 0.7 supported on the (18,0) CNT at 100 K and presented in Fig. 4a. According to this figure, the first peak of g(r)Au–C is greater than the same peak in g(r)Ag–C which is due to the greater interaction of Au–C than Ag–C. It is also shown that the first peak of g(r)Au–C in the nanoalloy with xAu = 0.7 is greater than that of the nanoalloy with xAu = 0.3. Because of the competitive adsorption of the Au and Ag atoms on the CNT surface, g(r)Ag–C decreases when g(r)Au–C increases.
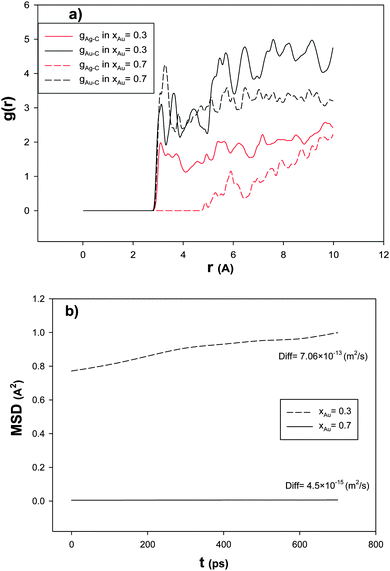 | ||
| Fig. 4 The (a) RDFs and (b) MSDs and self-diffusion coefficients for the nanoalloys with xAu = 0.3 and 0.7 supported on the 18,0 CNT at 100 K. | ||
In order to study the nanoalloy diffusion after the CO adsorption, we have calculated the mean square displacement (MSD) and self-diffusion coefficient (Diff) of the supported nanoalloys with xAu = 0.3 and 0.7 and presented in Fig. 4b. According to this figure, the nanoalloy with xAu = 0.7 has lower dynamics than that with xAu = 0.3 which can be due to the heavier atomic weight of Au than Ag and also the greater interactions of Au–Au and Au–C than the Ag–Ag and Ag–C interactions. Our results of the effect of the nanoalloy mole fraction are also in agreement with the previous theoretical and experimental studies on the CO adsorption on the Ag nanoclusters.4,17,23
3.3 Effect of the CNT diameter
The isotherms for CO adsorption on the nanoalloys with xAu = 0.5 supported on the CNT with different diameters at 100 K have been presented in Fig. 5. According to this figure, at a fixed value of pressure, the saturation coverage on the nanoalloy surface increases upon decreasing the diameter of the nanotube. This means that by colliding the gas molecules to the cluster surface, the interface between the nanotube and the nanoalloy increases which increases the interface between the nanoalloy and the gas phase and so the coverage increases. This effect is more on the smaller CNT in which the nanoalloy experiences more wetting (due to the more curvature of the smaller CNT than the bigger one). It means that the nanoalloy has greater interaction with the smaller CNT. The similar results were obtained by Akbarzadeh and Shamkhali.50 They reported that as the diameter of the nanotube is increased, the amount of H2 adsorption on the supported Ag nanocluster decreased.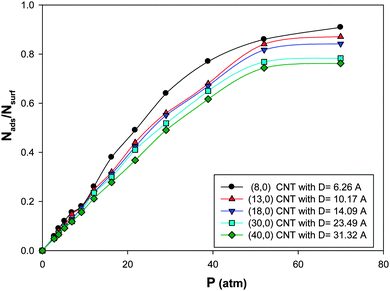 | ||
| Fig. 5 The isotherms for CO adsorption on the Ag–Au256 nanoalloys with xAu = 0.5 supported on the zigzag CNT with different diameters at 100 K. | ||
We have also calculated the enthalpy change of the adsorption of CO gas on the nanoalloys with xAu = 0.5 supported on the CNT with different diameters at the coverage of 0.2 and presented in Table 3.
| CNT diameter (nm) | ΔHads (kcal mol−1) | ΔSads (cal K−1 mol−1) |
|---|---|---|
| 6.26 | −45.0576 | −45.0576 |
| 10.17 | −42.4973 | −42.4973 |
| 14.09 | −41.3745 | −41.3745 |
| 23.49 | −40.0305 | −40.0305 |
| 31.32 | −39.4028 | −39.4028 |
Similar to the saturation coverage in Fig. 5, the absolute value of ΔHads increases upon decreasing the CNT diameter which is due to the increase of the interface (and interaction) between the smaller nanotube and the nanoalloy, so the adsorption and the energy increase. It is also shown in Table 3 that the entropy change of CO adsorption decreases upon decreasing the CNT diameter.
In order to investigate the effect of the CNT diameter on the RDF after the CO adsorption, we have also calculated the Ag–C and Au–C RDFs for the nanoalloy with xAu = 0.5 supported on the smallest (6.26 A) and biggest (31.32 A) CNTs at 100 K and presented in Fig. 6a. According to this figure, the RDFs in the smallest CNT are greater than the RDFs in the biggest one. This result is in agreement with the results in Fig. 5 and Table 3. This means that the interface between the smallest nanotube and the nanoalloy is greater (which increases the interaction between the nanoalloy atoms and the surface atoms of the nanotube) and so there are a number of cluster atoms surrounding the C atoms of the smallest CNT than the biggest one. In the other words, as the diameter of the nanotube increases, the gas adsorption on the nanoalloy decreases, because the nanoclusters are more wrapped around the nanotube walls and extend their surface which leads to the increase in Nsurf and the decrease in the coverage. Moreover, the stronger interactions between the nanoclusters and the bigger nanotubes reduce their ability to adsorb the gas molecules.
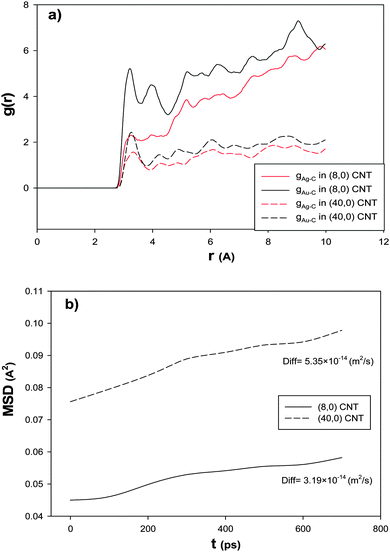 | ||
| Fig. 6 The (a) RDFs and (b) MSDs and self-diffusion coefficients for the Ag–Au256 nanoalloy with xAu = 0.5 supported on the smallest (6.26 nm) and biggest (31.32 nm) zigzag CNTs at 100 K. | ||
In order to investigate the effect of the CNT diameter on the nanoalloy dynamics, we have calculated the MSD and self-diffusion coefficient for the nanoalloy with xAu = 0.5 supported on the smallest (6.26 A) and biggest (31.32 A) CNTs and presented in Fig. 6b. According to this figure, the nanoalloy on the smallest CNT has lower diffusion than the biggest one. This result is in agreement with our adsorption, enthalpy change, and RDF results in Fig. 5, Table 3, and Fig. 6a, respectively. In the other words, when the nanoalloy is supported on the smallest CNT, its interface and interaction with the CNT increase which decreases the nanoalloy diffusion.
3.4 Effect of the CNT chirality
We have presented the CO adsorption isotherms on the (Ag–Au)256 nanoalloys with xAu = 0.5 deposited on the armchair (10,10) and zigzag (18,0) CNTs (which have similar diameters) at 100 K in Fig. 7. According to this figure, there is a small difference between the results of the two CNT configurations. It is shown that the saturation value of coverage is a little more for the zigzag CNT. This is due to the greater interaction of the nanoalloy supported on the zigzag CNT and the CO molecules than the armchair one. It means that the interface between the zigzag nanotube and the nanoalloy is increased more than that of the armchair nanotube which increases the interface between the nanoalloy and the gas phase and so the interaction and gas adsorption increase.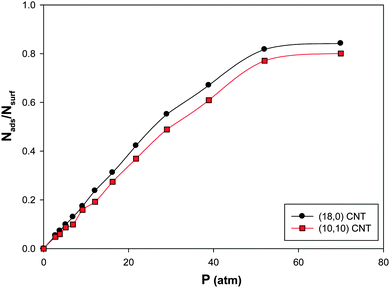 | ||
| Fig. 7 The adsorption isotherms on the Ag–Au256 nanoalloys with xAu = 0.5 deposited on the armchair 10,10 and zigzag 18,0 CNTs at 100 K. | ||
The enthalpy and entropy changes of CO adsorption on the deposited nanoalloys have been also presented in Table 4. According to this table, the absolute value of ΔHads for the zigzag CNT is greater than that of the armchair one which is due to the greater interaction of the CO molecules and the nanoalloy supported on the zigzag CNT than the armchair one. Therefore, it is expectable and shown that the entropy change of adsorption is less for the zigzag CNT than the armchair configuration.
| Nanotube n, m | ΔHads (kcal mol−1) | ΔSads (cal K−1 mol−1) |
|---|---|---|
| 18, 0 | −3.67 | −41.3745 |
| 10, 10 | −3.59 | −40.9211 |
To examine the chirality effect on the RDF after the CO adsorption, we have calculated Ag–C and Au–C RDFs for the nanoalloys with xAu = 0.5 supported on the armchair and zigzag CNTs at 100 K and presented in Fig. 8a. According to this figure, the first peak of the RDF is greater for the zigzag nanotube than the armchair configuration which is due to the greater interaction between the nanoalloy and the zigzag CNT which increased the interface between the cluster and the CNT. Therefore, there are a number of cluster atoms surrounding the C atoms of the zigzag CNT than the armchair one. Recently, Akbarzadeh et al.70 concluded that molecules of an ionic liquid have greater interaction with the zigzag CNT than the armchair one.
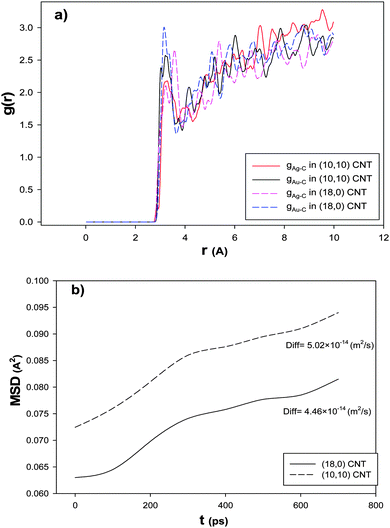 | ||
| Fig. 8 The (a) RDFs and (b) MSDs and self-diffusion coefficients for the nanoalloys with xAu = 0.5 supported on the armchair and zigzag CNTs at 100 K. | ||
In order to investigate the effect of the CNT chirality on the nanoalloy dynamics, we have calculated the MSD and self-diffusion coefficient for the nanoalloy with xAu = 0.5 supported on the zigzag and armchair nanotubes and presented in Fig. 8b. It is shown that there is a small difference between the self-diffusion of the nanoalloy on the two CNT configurations. It is illustrated that the nanoalloy on the zigzag CNT has lower diffusion than the armchair one. This result is in agreement with our adsorption isotherms in Fig. 7, the enthalpy and entropy changes in Table 4, and the RDF result in Fig. 8a. In the other words, when the nanoalloy is supported on the zigzag CNT, its interface and interaction with the CNT increase which decreases the diffusion of the deposited nanoalloy.
3.5 Effect of the support
In order to investigate the support effect on the adsorption, we have presented the CO adsorption isotherms on the (Ag–Au)256 nanoalloys with xAu = 0.5 at 100 K in three different states in Fig. 8:(a) Supported nanocluster on the CNT with 14.09 nm diameter.
(b) Supported nanocluster on graphene
(c) Bare nanocluster
According to Fig. 9, the supported nanoclusters have high saturation values of coverage than the bare nanoclusters. It is also shown that the supported cluster on the CNT has a higher saturation value than the supported cluster on graphene. This shows the role of curvature in the gas adsorption. In the other words, the more curvature leads to the more gas adsorption on the supported nanocluster (due to the orientations of the adsorbed molecules on the cluster).31,56
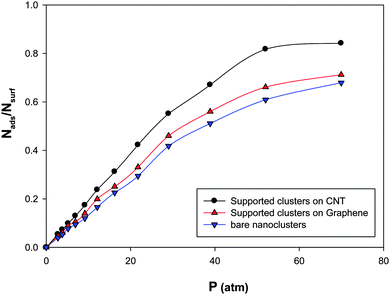 | ||
| Fig. 9 The adsorption isotherms on the Ag–Au256 nanoalloys with xAu = 0.5 at 100 K in three different states. | ||
4. Conclusion
In this work, we have studied CO adsorption on the (Ag–Au)N nanoalloys supported on the carbon nanotubes at different temperatures and pressures using the molecular dynamics simulations. We have investigated many of the possible effects; the effects of the nanoalloy size, nanoalloy mole fraction, nanotube diameter, and nanotube chirality, and the effect of the support on the thermodynamic, structural, and dynamic properties of the CO adsorption on the supported nanoalloys. The following important results have been summarized:(1) The smaller nanoalloys have more CO coverage than larger ones which is due to the lower number of surface atoms and adsorption sites in smaller nanoalloys.
(2) The absolute value of the enthalpy change of adsorption (ΔHads) increases sharply with decreasing cluster size which is due to the lower cohesive energy of smaller nanoalloys. It is also shown that the entropy change of adsorption (ΔSads) decreases sharply upon decreasing the cluster size.
(3) The radial distribution function (RDF) of the smallest nanoalloy is greater than that of the largest one. This can be due to the greater interaction between the smaller nanoalloy and the nanotube than the larger one.
(4) The smallest nanoalloy has much slower dynamics than the largest one. It means that the smaller nanoalloy has greater interaction with the nanotube and so it has greater radial distribution function and smaller diffusion coefficients.
(5) The saturation value of coverage increases as the mole fraction of Au is increased. This is due to the greater Au–CO interaction than the Ag–CO interaction. Therefore, the absolute value of the enthalpy change increases upon increasing the mole fraction of Au and the entropy change decreases upon increasing the Au mole fraction.
(6) The first peak of the radial distribution function (RDF) of Au–C is greater than the same peak in the Ag–C RDF which is due to the greater interaction of Au–C than Ag–C. Because of the competitive adsorption of the Au and Ag atoms on the nanotube surface, the Ag–C RDF decreases as the Au–C RDF increases.
(7) The nanoalloy with the Au mole fraction of xAu = 0.7 has lower dynamics than that with xAu = 0.3 which can be due to the heavier atomic weight of Au than Ag and also the greater interactions of Au–Au and Au–C than the Ag–Ag and Ag–C interactions.
(8) The saturation coverage on the nanoalloy surface increases upon decreasing the diameter of the nanotube which is due to the more interfaces and interactions between the nanoalloy and the gas molecules on the smaller nanotube than the bigger one. Therefore, the absolute value of the enthalpy change (ΔHads) increases upon decreasing the nanotube diameter and the entropy change of CO adsorption decreases upon decreasing the nanotube diameter.
(9) The radial distribution functions (RDFs) in the smallest nanotube are greater than the RDFs in the biggest one. This means that the interface between the smallest nanotube and the nanoalloy is greater.
(10) The nanoalloy on the smallest nanotube has lower diffusion than the biggest one. In the other words, when the nanoalloy is supported on the smallest nanotube, its interface and interaction with the nanotube increase which decreases the nanoalloy diffusion.
(11) The saturation value of coverage is a little high for the zigzag nanotube. This is due to the greater interface and interaction between the nanoalloy supported on the zigzag nanotube (than the armchair one) and the CO molecules. Also, the absolute value of the enthalpy change (ΔHads) for the zigzag nanotube is greater than that of the armchair one and the entropy change (ΔSads) is less for the zigzag nanotube than the armchair configuration.
(12) The first peak of the radial distribution function is greater for the zigzag nanotube than the armchair configuration which is due to the greater interaction between the nanoalloy and the zigzag nanotube which increased the interface between the cluster and the tube.
(13) It is illustrated that the nanoalloy on the zigzag nanotube has lower diffusion than the armchair one. This result is in agreement with our adsorption isotherms, the enthalpy and entropy changes, and the radial distribution function results.
(14) Our results of the effects of the nanocluster size and mole fraction are in good agreement with the previous density functional theory (DFT) and experimental studies on the CO adsorption on the Ag nanoclusters.4,17,23,66–69
References
- F. Baletto and R. Ferrando, Rev. Mod. Phys., 2005, 77, 371 CrossRef CAS
.
- Q. Zhang, J. Xie, Y. Yu and J. Y. Lee, Nanoscale, 2010, 2, 1962 RSC
.
- E. H. Espinosa, R. Ionescu, C. Bittencout, A. Felten, R. Erni, G. Van Tendeloo, J. J. Pireaux and E. Llobet, Thin Solid Films, 2007, 515, 8322 CrossRef CAS
.
- A. Q. Wang, C. M. Chang and C. Y. Mou, J. Phys. Chem. B, 2005, 109, 18860 CrossRef CAS PubMed
.
- A. Q. Wang, J. H. Liu, S. D. Lin, T. S. Lin and C. Y. Mou, J. Catal., 2005, 233, 186 CrossRef CAS
.
- X. Y. Liu, A. Q. Wang, X. D. Wang, C. Y. Mou and T. Zhang, Chem. Commun., 2008, 3187 RSC
.
- C. Wang, H. G. Yin, R. Chan, S. Peng, S. Dai and S. H. Sun, Chem. Mater., 2009, 21, 433 CrossRef CAS
.
- J. P. Wilcoxon and B. L. Abrams, Chem. Soc. Rev., 2006, 35, 1162 RSC
.
- S. Tokonami, N. Morita, K. Takasaki and N. Toshima, J. Phys. Chem. C, 2010, 114, 10336 CAS
.
- J. H. Liu, A. Q. Wang, Y. S. Chi, H. P. Lin and C. Y. Mou, J. Phys. Chem. B, 2005, 109, 40 CrossRef CAS PubMed
.
- D. Belic, R. L. Chantry, Z. Y. Li and S. A. Brown, Appl. Phys. Lett., 2011, 99, 171914 CrossRef
.
- C. W. Yen, M. L. Lin, A. Wang, S. A. Chen, J. M. Chen and C. Y. Mou, J. Phys. Chem. C, 2009, 113, 17831 CAS
.
- N. K. Chaki, H. Tsunoyama, Y. Negishi, H. Sakurai and T. Tsukuda, J. Phys. Chem. C, 2007, 111, 4885 CAS
.
- K. Kim, K. L. Kim and S. J. Lee, Chem. Phys. Lett., 2005, 403, 77 CrossRef CAS
.
- J. F. Sanchez-Ramirez, U. Pal, L. Nolasco-Hernandez, J. Mendoza-Alvarez and J. A. J. Pescador-Rojas, Nanomaterials, 2008, 2008, 1 CrossRef
.
- A. Gotti and R. Prins, J. Catal., 1998, 175, 302 CrossRef CAS
.
- A. Cuesta, N. Lopez and C. Gutierrez, Electrochim. Acta, 2003, 48, 2949 CrossRef CAS
.
- A. Q. Wang, C. M. Chang and C. Y. Mou, J. Phys. Chem. B, 2005, 109, 18860 CrossRef CAS PubMed
.
- C. D. Pina, E. Falletta, L. Prati and M. Rossi, Chem. Soc. Rev., 2008, 37, 2077 RSC
.
- C. L. Bracey, P. R. Ellis and G. J. Hutchings, Chem. Soc. Rev., 2009, 38, 2231 RSC
.
- E. Bloch, P. L. Llewellyn, D. Vincent, F. Chaspoul and V. Hornebecq, J. Phys. Chem. C, 2010, 114, 22652 CAS
.
- D. Tang, J. Hu, S. Lu, G. Sun and Y. Zhang, Acta Chim. Sin., 2012, 70, 943 CrossRef CAS
.
- I. Fleischer, D. M. Popolan, M. Krstic, V. Bonacic-Koutecky and T. M. Bernhardt, Chem. Phys. Lett., 2013, 565, 74 CrossRef CAS
.
- A. R. Harutyunyan, T. Tokune and E. Mora, Appl. Phys. Lett., 2005, 87, 051919 CrossRef
.
- J. C. Jimenez-Saez, A. M. C. Perez-Martin and J. J. Jimenez-Rodrıguez, Nucl. Instrum. Methods Phys. Res., Sect. B, 2006, 248, 816 CrossRef
.
- Y. Shibuta and S. Maruyama, Chem. Phys. Lett., 2007, 437, 218 CrossRef CAS
.
- C. F. Sanz-Navarro, P. O. Astrand, D. Chen, M. Ronning, A. C. T. van Duin, J. E. Mueller and W. A. Goddard, J. Phys. Chem. C, 2008, 112, 12663 CAS
.
- C. F. Sanz-Navarro, P. Astrand, D. Chen, M. Ronning, A. C. T. van Duin and W. A. Goddard, J. Phys. Chem. C, 2010, 114, 3522 CAS
.
- S. Jalili, C. Mochani, M. Akhavan and J. Schofield, Mol. Phys., 2012, 110, 267 CrossRef CAS
.
- H. Akbarzadeh and H. Yaghoubi, J. Colloid Interface Sci., 2014, 418, 178 CrossRef CAS PubMed
.
- H. Akbarzadeh, H. Yaghoubi, A. N. Shamkhali and F. Taherkhani, J. Phys. Chem. C, 2014, 118, 9187 CAS
.
- A. N. Shamkhali and H. Akbarzadeh, RSC Adv., 2014, 4, 60866 RSC
.
- M. S. Chen, D. Kumar, C. W. Yi and D. W. Goodman, Science, 2005, 310, 291 CrossRef CAS PubMed
.
- M. S. Chen and D. W. Goodman, Acc. Chem. Res., 2006, 39, 739 CrossRef CAS PubMed
.
- A. S. K. Hashmi and G. J. Hutchings, Angew. Chem., 2006, 45, 7896 CrossRef PubMed
.
- C. D. Pina, E. Falletta, L. Prati and M. Rossi, Chem. Soc. Rev., 2008, 37, 2077 RSC
.
- C. L. Bracey, P. R. Ellis and G. J. Hutchings, Chem. Soc. Rev., 2009, 38, 2231 RSC
.
- J. A. Rodriguez, J. Evans, J. Graciani, J. B. Park, P. Liu, J. Hrbek and J. F. Sanz, J. Phys. Chem. C, 2009, 113, 7364 CAS
.
- J. Pritchard, L. Kesavan, M. Piccinini, Q. A. He, R. Tiruvalam, N. Dimitratos, J. A. Lopez-Sanchez, A. F. Carley, J. K. Edwards, C. J. Kiely and G. J. Hutchings, Langmuir, 2010, 26, 16568 CrossRef CAS PubMed
.
- L. Kesavan, R. Tiruvalam, M. H. Ab Rahim, M. I. bin Saiman, D. I. Enache, R. L. Jenkins, N. Dimitratos, J. A. Lopez-Sanchez, S. H. Taylor, D. W. Knight, C. J. Kiely and G. J. Hutchings, Science, 2011, 331, 195 CrossRef CAS PubMed
.
- J. H. Lee, N. R. Kim, B. J. Kim and Y. C. Joo, Carbon, 2012, 50, 98 CrossRef CAS
.
- Y. Shi, Z. Liu, B. Zhao, Y. Sun, F. Xu, Y. Zhang, Z. Wen, H. Yang and Z. Li, J. Electroanal. Chem., 2011, 656, 29 CrossRef CAS
.
- S. Peng and K. Cho, Nano Lett., 2003, 4, 513 CrossRef
.
- A. G. Mamalis, L. O. G. Vogtlander and A. Markopoulos, Precis. Eng., 2004, 28, 16 CrossRef
.
- K. C. Chin, A. Gohel, H. I. Elim, W. Chen, W. Ji, G. L. Chong, C. H. Sow and A. T. S. Wee, J. Mater. Res., 2006, 21, 2758 CrossRef CAS
.
- K. Kostareos, L. Lacerda, G. Patorin, W. Wu, S. Weickowski, J. Luangsivilay, S. Godefroy, D. Pantarotto, J. P. Briand, S. Muller, M. Prato and A. Bianco, Nat. Nanotechnol., 2007, 2, 108 CrossRef PubMed
.
- A. A. Rafati, S. M. Hashemianzadeh, Z. Bolboli Nojini and N. Naghshineh, J. Comput. Chem., 2010, 31, 1443 CAS
.
- M. Penza, R. Rossi, M. Alvisi, G. Cassano and E. Serra, Sens. Actuators, B, 2009, 140, 176 CrossRef CAS
.
- S. Hrapovic, E. Majid, Y. Liu, K. Male and J. H. T. Luong, Anal. Chem., 2006, 78, 5504 CrossRef CAS PubMed
.
- H. Akbarzadeh and A. N. Shamkhali, J. Comput. Chem., 2015, 36, 433 CrossRef CAS PubMed
.
- S. Link and M. A. El-Sayed, J. Phys. Chem. B, 1999, 103, 8410 CrossRef CAS
.
- Y. K. T. Cagin, Y. Qi, H. Ikeda, W. L. Johnson and W. A. Goddard III, Mater. Res. Soc. Symp. Proc., 1999, 554, 43 CrossRef
.
- Y. Qi, T. Cagin, Y. Kimura and W. A. Goddard, Phys. Rev. B: Condens. Matter Mater. Phys., 1999, 59, 3527 CrossRef CAS
.
- Y. Qi, T. Cagin, Y. Kimura and W. A. Goddard, J. Comput. – Aided Mater. Des., 2002, 8, 233 CrossRef
.
- S. C. Yeo, D. H. Kim, K. Shin and H. M. Lee, Phys. Chem. Chem. Phys., 2012, 14, 2791 RSC
.
- H. Akbarzadeh, H. Yaghoubi, A. N. Shamkhali and F. Taherkhani, J. Phys. Chem. C, 2013, 117, 26287 CAS
.
- L. Lindsay and D. A. Broido, Phys. Rev. B: Condens. Matter Mater. Phys., 2010, 81, 205441 CrossRef
.
- A. Sirjoosingh, S. Alavi and T. K. Woo, J. Phys. Chem. C, 2010, 114, 2171 CAS
.
- M. Neek-Amal, R. Asgari and M. R. Rahimi Tabar, Nanotechnology, 2009, 20, 135602 CrossRef CAS PubMed
.
- W. Smith and I. T. Todorov, Mol. Simul., 2006, 32, 935 CrossRef CAS
.
- H. J. C. Berendsen, J. P. M. Postma, W. F. van Gunsteren, A. Dinola and J. R. Haak, J. Chem. Phys., 1984, 81, 3684 CrossRef CAS
.
-
M. P. Allen and D. J. Tildesley, Computer Simulation of Liquid, Oxford, Clarendon, 1997 Search PubMed
.
- N. Jian and R. E. Palmer, J. Phys. Chem. C, 2015, 119, 11114 CAS
.
- E. J. Lamas and P. B. Balbuena, J. Phys. Chem. B, 2003, 107, 11382 CrossRef
.
- C. K. Das and J. K. Singh, Theor. Chem. Acc., 2013, 132, 1351 CrossRef
.
- W. L. Yim and T. Kluener, Phys. Rev. Lett., 2013, 110, 196101 CrossRef PubMed
.
- K. Shimizu, Y. Miyamoto and A. Satsuma, J. Catal., 2010, 270, 86 CrossRef CAS
.
- D. C. Meier and D. W. Goodman, J. Am. Chem. Soc., 2004, 126, 1892 CrossRef CAS PubMed
.
- E. Ganz, K. Sattler and J. Clarke, Surf. Sci., 1989, 219, 33–67 CrossRef CAS
.
- H. Akbarzadeh, M. Abbaspour, S. Salemi and S. Abdollahzadeh, RSC Adv., 2015, 5, 3868 RSC
.
Footnote |
| † Electronic supplementary information (ESI) available. See DOI: 10.1039/c5nj01382h |
| This journal is © The Royal Society of Chemistry and the Centre National de la Recherche Scientifique 2016 |
