A universal strategy for the facile synthesis of a sandwich-structured Pt–graphene–Pt nanocomposite for salbutamol sensing†
Xiaofei
Zhu‡
ab,
Xuemin
Duan‡
a,
Jingkun
Xu
*a,
Limin
Lu
*b,
Kaixin
Zhang
c,
Huakun
Xing
a,
Yansha
Gao
a,
Taotao
Yang
a and
Wenmin
Wang
b
aSchool of Pharmacy, Jiangxi Science and Technology Normal University, Nanchang 330013, P. R. China. E-mail: xujingkun@tsinghua.org.cn; Fax: +86 791 3823320; Tel: +86 791 8537967
bCollege of Science, Jiangxi Agricultural University, Nanchang 330045, P. R. China. E-mail: lulimin816@hotmail.com
cCentre for Nanoscale BioPhotonics, Macquarie University, North Ryde, 2109, NSW, Australia. E-mail: kaixin.zhang@mq.edu.au
First published on 27th October 2015
Abstract
In this work, a sandwich-structured Pt–graphene–Pt (P–Gr–P) nanocomposite has been prepared by a two-step method including (i) a chemical and (ii) an electrochemical reduction process. The P–graphene oxide–P (P–GO–P) nanocomposite was firstly synthesized by an in situ growth method, during which platinum nanoparticles (PtNPs) grew on both sides of GO. In the second step, P–GO–P was coated onto a glass carbon electrode (GCE). In this process, GO in the P–GO–P nanocomposite was reduced to a more conductive form of graphene (Gr). The obtained sandwich-structured P–Gr–P can effectively separate the individual layers of Gr sheets from each other, prevent the agglomeration of Gr sheets and improve the conductivity of the Gr film. In addition, the electrocatalytic properties of the as-prepared P–Gr–P nanocomposite towards the oxidation of salbutamol (SAL) were investigated. Results revealed that the sandwich-structured P–Gr–P nanocomposite with higher electrochemically active surface area showed better electrocatalytic activity toward SAL oxidation than PtNPs–Gr prepared by using the one-step electrochemical co-deposition method. On the basis of the excellent electrochemical activity of the P–Gr–P nanocomposite, a highly sensitive electrochemical platform was developed for the rapid detection of SAL. The present work provides an interesting strategy to prepare a Gr-based nanocomposite for electrochemical sensors.
1. Introduction
Salbutamol [1-(4-hydroxy-3-hydroxymethylphenyl)-2-(t-butylamino)ethanol] (SAL) is a β2 adrenergic receptor agonist which is primarily used in the treatment of bronchial asthma and other forms of allergic airway disease associated with the respiratory pathway.1 SAL is also applied as a tocolytic agent in humans as well as in veterinary medicine. However, residues of SAL in higher doses may display lipolytic effect and be toxic to humans.2 Therefore, it is necessary to establish quick and accurate methods to detect SAL residues. Electrochemical methods have been proved to be ideal methods for the analysis of drugs and related compounds because of their high accuracy, sensitivity, low cost and easy operation.3,4 Modified electrode materials have been shown to play a key role in electrochemical detection, as they determine the sensitivity and speed of response to a large extent. However, to the best of our knowledge, only a few reports in the literature involved the detection of SAL by using modified GCE, and the linear range and detection limit need to be improved. Therefore, development of electrochemical methods for the detection of SAL with improved performance is significant.Gr, a single-atom-thick sheet arranged in a honey comb structure, has gained enormous attention due to its large specific surface area, superior mechanical properties and remarkable electronic conductivity.5–7 The applications of Gr have been reported in various fields such as batteries,8 supercapacitors,9 chemical sensors and biosensors.10–12 However, Gr easily tends to form irreversible agglomerates or even restacks to form graphite due to the π–π interaction between individual Gr.13 To solve this problem, the preparation of Gr-based composites, including carbon nanotube–Gr composites,14,15 biomaterial–Gr composites,16,17 Gr–polymer composites18–20 and Gr–metal composites,21–23 is considered to prevent the aggregation of Gr sheets. Especially, the design and synthesis of Gr–metal nanohybrids are of great interest both for fundamental studies and for potential nanodevice applications.24–27 It is well realized that the dispersion of metal nanoparticles on Gr sheets would potentially provide a new way to develop novel catalytic, magnetic, and optoelectronic materials.28
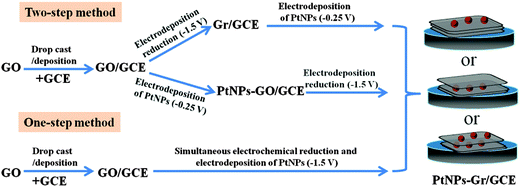
As a kind of noble metal, platinum (Pt) has been applied in many catalytic fields due to its unusual physical and chemical properties, such as sensors,29 fuel cell electrocatalysts30 and counter electrodes in dye-sensitized solar cells.31 It has been reported that PtNPs–Gr can display a synergistic effect of catalytic characters of both Gr and PtNPs, in which Gr can give rise to an extraordinary modification of the PtNPs and PtNPs deposited on Gr accelerated the electron transfer.32 To date, a variety of methods have been developed to synthesise PtNPs–Gr composites, such as chemical methods,33 microwave synthesis34 and electrochemical techniques.35 Among these methods, electrochemical methods have attracted a lot of interest due to their simple operation, eco-friendliness, mild conditions and size controllability. Typically, two types of strategies have been proposed to electrochemically deposit PtNPs on Gr, including two-step and one-step electrochemical methods (Scheme 1). In the two-step method, GO is drop-cast or deposited on the electrodes, and then GO- or Gr-coated electrodes are immersed in a metallic precursor solution to perform electrochemical reduction at negative potential or in the reverse order. On the other hand, in the one-step method, simultaneous electrochemical reductions of H2PtCl6 and GO are performed. However, the above-mentioned methods for PtNPs–Gr synthesis lack control over the distribution of PtNPs. In addition, still it is not possible to avoid aggregation of Gr because there are large amounts of free GO sheets assembled on the surface of the electrode or in the electrolysis solutions during the electrochemical reduction process.
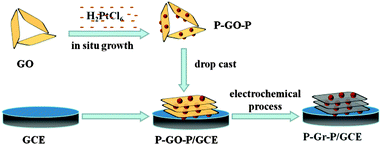
More recently, several research groups36,37 have reported that metal NPs can be strongly anchored onto the GO surface by mixing GO and a metallic precursor aqueous solution without applying any additional reductants or surfactants, during which GO acted as both stabilizer and reductant. They found that the resultant metal NPs can be uniformly dispersed on both surfaces of GO. Inspired by these pioneering studies, in this article, a novel sandwich-structured P–Gr–P nanocomposite was synthesized, and was firstly used as the active material for the fabrication of electrochemical SAL sensor. The P–Gr–P nanocomposite was prepared by a two-step method including (i) a chemical and (ii) an electrochemical reduction process. In the first step, the P–GO–P nanocomposite was synthesized through a simple in situ growth method, in which GO can successfully reduce H2PtCl6 to PtNPs and PtNPs grew on both sides of GO. The monolayer GO can be effectively isolated by PtNPs resulting in the formation of a sandwich structure in solution. In the second step, the as-prepared P–GO–P nanocomposite was coated on the GCE and subjected to an electrochemical process. In this process, GO was reduced to Gr and the P–Gr–P nanocomposite was obtained. The sandwich-structure of P–Gr–P can effectively prevent the agglomeration of Gr and improve the conductivity of the composite. Furthermore, the as-prepared P–Gr–P was used as a sensing material for the sensitive detection of SAL. The sensing performances of the P–Gr–P toward SAL oxidation were investigated. The satisfactory results demonstrated that the P–Gr–P nanocomposite with a high electrochemical active surface area showed enhanced electrochemical signals toward the oxidation of SAL. This work has expanded the scope of synthesizing Gr-based hybrids and explored their sensing applications.
2. Experimental
2.1. Chemicals and reagents
SAL was purchased from Aldrich. SAL stock solution (5 × 10⁻³ M) was prepared using absolute ethanol and stored at 277–281 K. GO was obtained from Nanjing XianFeng Nano Material Technology Co. H2PtCl6·3H2O, disodium hydrogen phosphate dodecahydrate (Na2HPO4), and sodium dihydrogen phosphate dehydrate (NaH2PO4) were purchased from Sinopharm Chemical Reagent Co. Ltd. Other reagents were of analytical grade; double distilled water was used during the experiments.2.2. Instrumentation
SEM images were obtained using a Helios NanoLab FESEM/FIB. TEM images were obtained using a TecnaiG2 T2 transmission electron microscope. UV/vis spectral analysis was performed using a Perkin-Elmer Lambda 900 ultraviolet-visible-near-infrared spectrophotometer (Germany). Raman spectroscopy (inVia-Reflex) was used to analyze the samples using a 633 nm laser. Electrochemical measurements including cyclic voltammetry, differential pulse voltammetry and electrochemical impedance spectroscopy techniques were carried out on a CHI 660D electrochemical workstation (Shanghai, China). The measurement was carried out in a three-electrode system, including GCE or composite modified GCE as the working electrode, platinum wire as the auxiliary electrode and saturated calomel reference electrode (SCE). Before the experiments, the double distilled water was treated by passing N2 for 15 min.2.3. Material preparation
![[thin space (1/6-em)]](https://www.rsc.org/images/entities/char_2009.gif) :
:![[thin space (1/6-em)]](https://www.rsc.org/images/entities/char_2009.gif) 1 (v/v) and subjecting the mixture to vigorous stirring at 80 °C for 24 h.37 The obtained product was named P–GO–P.
1 (v/v) and subjecting the mixture to vigorous stirring at 80 °C for 24 h.37 The obtained product was named P–GO–P.
To obtain P–Gr–P modified GCE (P–Gr–P/GCE), 5 μL of P–GO–P dispersion was dropped on the surface of GCE and dried at room temperature. The P–GO–P/GCE was transferred to an electrochemical cell containing 0.1 M phosphate buffer solution (PBS) (pH 7.0). GO in the P–GO–P composite film was electrochemically reduced to Gr by performing successive cyclic voltammograms for 400 s in a potential window between −1.5 and 0 V, and the scan rate was set as 50 mV s−1. The preparation process is shown in Scheme 2. For comparison, Gr modified GCE (Gr/GCE) and GO modified GCE (GO/GCE) were also prepared.
3. Results and discussion
3.1. Characterization of P–Gr–P
The morphology and structure of Gr and P–Gr–P were characterized by SEM and TEM. The samples of Gr and P–Gr–P on indium tin oxide (ITO) glasses were prepared by an electrochemical method. Briefly, GO or P–GO–P dispersion was dropped on the ITO surface and dried, and then GO/ITO or P–GO–P/ITO was transferred to an electrochemical cell and reduced by performing successive cyclic voltammograms for 400 s in a potential window between −1.5 and 0 V. As can be seen from Fig. 1A, a typical wrinkled structure with corrugation and scrolling is intrinsic to Gr. For the P–Gr–P nanocomposite (Fig. 1B), one can see that a large amount of PtNPs was uniformly distributed on the surface of Gr. In addition, the structures of Gr and sandwich-structured P–Gr–P were further confirmed by TEM techniques. As shown in Fig. 1C, Gr displayed a layered stacking structure. This structure easily tended to agglomerate due to the decrease of oxygen-containing functional groups after experiencing an electrochemical process. By contrast, it can be observed from Fig. 1D that the P–Gr–P nanocomposite contained three layers of Gr, where Gr layers were regularly spaced by layers of PtNPs. Since PtNPs were distributed on both sides of the Gr layer, the sandwich structure of P–Gr–P can effectively avoid aggregation. The sandwich structured nanocomposite could extremely increase the active surface area, allow the analyte (here SAL) to fully touch the PtNPs, and provide enough space for mass transfer of reactants and products. Consequently, the resulting modified electrode would exhibit an excellent electrocatalytic capability towards the oxidation of SAL.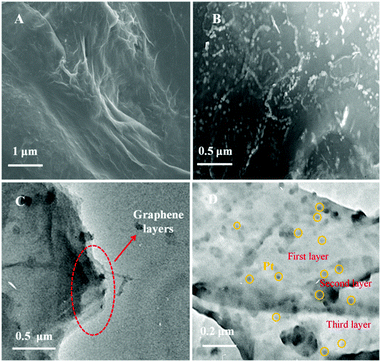 | ||
| Fig. 1 SEM images of Gr (A) and P–Gr–P (B) and TEM images of the Gr layer (C) and the sandwich structure of P–Gr–P (D). | ||
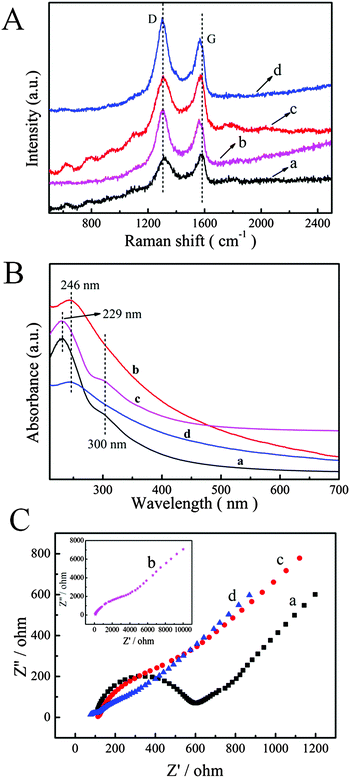
Raman spectroscopy is one of the most effective techniques to characterize the ordered and disordered crystal structures of Gr. Therefore, Raman spectroscopy was used to characterize Gr based materials. In particular, samples of GO and P–GO–P were dropped on the ITO surface without conducting the electrochemical reduction process. Fig. 2A shows the Raman spectra of GO, Gr, P–GO–P and P–Gr–P composites. Raman spectra usually show two peaks (G band and D band): the G band corresponded to the sp2-hybridized carbon atoms in the hexagonal framework and the D band is associated with structural defects and disorders that can break the symmetry and selection rules. The D/G band intensity ratio (ID/IG) in the Raman spectrum expresses the atomic ratio of sp2/sp3 carbons, and is a measure of the extent of disordered graphite. As can be seen in Fig. 2, GO displayed a D band at 1315 cm−1 and a G band at 1590 cm−1, while Gr showed a G band at 1570 cm−1, and the ID/IG was up to 1.18 (0.98 for GO). This phenomenon can be explained in that the distortion of 6-fold rings caused by oxygen functionalities is removed after GO deoxidation,38 and the carbon lattice returns to an essentially graphitic state with a high amount of defects, resulting in the increase of the ID/IG ratio.39 For P–GO–P, the ID/IG (1.01) increased slightly as compared with GO, indicating the successful growth of PtNPs on Gr defects.40 As for P–Gr–P, the ID/IG increased to 1.21, which is higher than for P–GO–P or Gr. The increased ID/IG can be attributed to the reduction process altering the structure of GO in P–GO–P, and the presence of PtNPs deterring the recovery of the sp2 carbon domain and decreasing the G band intensity of Gr.40,41
The reduction process was demonstrated by UV-vis absorption spectra and the results are shown in Fig. 2B. It can be found that the UV-vis spectra of GO (a) and P–GO–P (c) exhibited two characteristic peaks: one was at 229 nm corresponding to π → π* transitions of aromatic C–C bonds, and the other at 300 nm was attributed to n → π* transitions of C![[double bond, length as m-dash]](https://www.rsc.org/images/entities/char_e001.gif) O bonds.42 After the electrochemical reduction process, the peak at 229 nm was red shifted to 246 nm (Fig. 2B, b and d), which was an indication of the restoration of the electronic conjugation within the Gr sheets.43 The results of UV-vis spectra indicated that the electrochemical reduction of GO indeed took place.
O bonds.42 After the electrochemical reduction process, the peak at 229 nm was red shifted to 246 nm (Fig. 2B, b and d), which was an indication of the restoration of the electronic conjugation within the Gr sheets.43 The results of UV-vis spectra indicated that the electrochemical reduction of GO indeed took place.
Electrochemical impedance spectroscopy (EIS) is widely used to study the interface properties of the modified electrode. The impedance spectrum includes two parts: a semicircle diameter at higher frequencies corresponds to the electron-transfer resistance (Ret) and a linear part at lower frequencies corresponds to the diffusion process. Fig. 2C shows the results of EIS of bare GCE (a), GO/GCE (b), Gr/GCE (c) and P–Gr–P/GCE (d) in the presence of 5 mM [Fe(CN)6]3−/4− containing 0.1 M KCl at a scan rate of 50 mV s−1. It was observed that bare GCE displays a Ret of 500 Ω, while the Ret of GO/GCE was 4900 Ω, possibly due to the poor conductivity of GO. However, a dramatically decreased Ret value can be found when Gr was modified on GCE, which was attributed to the excellent electronic property of Gr, forming a fast electron conduction pathway between the electrode and the electrochemical probe. As for P–Gr–P/GCE, the semicircle in the plot became much smaller than that of the electrode without PtNPs. The excellent conductivity was probably due to the fact that PtNPs accelerated the electron transfer and the sandwich structure of P–Gr–P can effectively prevent Gr from agglomerating.
3.2. Electrochemical behaviour of SAL on P–Gr–P/GCE
To evaluate the electrochemical performance of P–Gr–P, P–Gr–P/GCE was characterized by cyclic voltammetry in the presence of SAL in the potential range from 0.3 V to 0.9 V. Fig. 3 presents typical cyclic voltammograms of bare GCE (curve a), GO/GCE (curve b), Gr/GCE (curve c), PtNPs–Gr/GCE (curve d) and P–Gr–P/GCE (curve e) in pH 7.0 PBS containing 20 μM SAL. As can be seen, no obvious redox peak can be observed at bare GCE, which might be due to the sluggish electron transfer of GCE (curve a). On the other hand, GO/GCE exhibited a slightly obvious oxidation peak current response, possibly due to the fact that GO holds strong adsorption capacity, but exhibited poor conductivity (curve b). However, as shown in Fig. 3 (curve c), the oxidation peak current as well as background current increased significantly at Gr/GCE, attributable to the excellent conductivity and large surface area of Gr. Larger oxidation peak current can be observed on PtNPs–Gr/GCE, which was prepared by the one-step electrodeposition method, indicating that PtNPs distributed on the Gr surface improved the electrochemical oxidation of SAL (curve d). As for P–Gr–P/GCE, the oxidation peak current increased again, which was three times higher than that at Gr/GCE (curve e). Moreover, it can also be seen that the oxidation peak current of SAL at the sandwich-structured P–Gr–P electrode was much higher than that at the PtNPs–Gr/GCE, adding to evidence that the special sandwich structure of P–Gr–P showed better performance as compared to ordinary PtNPs–Gr composites. Therefore, the excellent electrochemical catalytic properties of P–Gr–P can be summarized as the following three aspects: firstly, Gr has good electrical conductivity and a large specific surface area, which can provide an excellent microenvironment for the catalytic oxidation of SAL. Secondly, the well-distributed PtNPs on the surface of Gr with a high density would provide more active sites for the catalytic oxidation reaction and greatly increase the electrocatalytic activity. Thirdly, for the sandwich-structure of P–Gr–P, SAL molecules can rapidly diffuse from the solution into the nano-P–Gr–P modified membranes.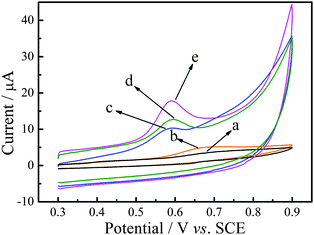 | ||
| Fig. 3 Cyclic voltammograms of 20 μM SAL in 0.1 M PBS (pH 7.0) at bare GCE (a), GO/GCE (b), Gr/GCE (c), PtNPs–Gr/GCE (d) and P–Gr–P/GCE (e). Scan rate: 50 mV s−1. | ||
3.3. Optimization of the experimental conditions
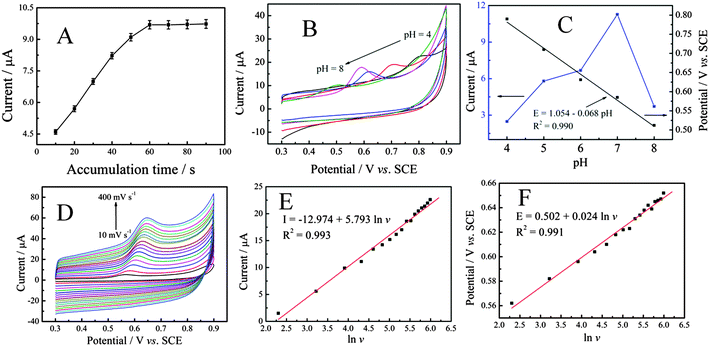
Accumulation can improve the amount of SAL absorbed on the electrode surface, and then improve sensitivity determination. Therefore, the influence of accumulation time was investigated. As can be seen from Fig. 4A, the influence of accumulation time ranging from 10 to 90 s on the oxidation of SAL at P–Gr–P/GCE was investigated. It was observed that the oxidation current response increased sharply with increasing reduction time from 10 s to 60 s, and then reached a constant limiting value, which demonstrated that the adsorption of SAL was fast and easily reached saturation on P–Gr–P/GCE. Based on the sensitivity and short analysis time, 60 s accumulation time was chosen in subsequent experiments.
Fig. 4B shows the effect of pH of the supporting electrolyte on the electro-oxidation of 20 μM SAL at P–Gr–P/GCE in 0.1 M PBS with a scan rate of 50 mV s−1. As can be seen, with the increase of the pH value, the oxidation potential (Epa) of SAL shifted toward less positive values, suggesting the involvement of protons in the oxidation reaction.44 The plot of the peak potential vs. pH showed one straight line between pH 4 and 8 and it can be expressed by the following equation (Fig. 4C):
| Epa = 1.054 − 0.068 pH (R2 = 0.990) |
The slope of the above equation was −68 mV pH−1, which was close to −59 mV pH−1, indicating equal numbers of protons and electrons involved in the electrode reaction. In addition, it was also found that the peak current increased with the pH from 4.0 to 7.0, and then decreased from 7.0 to 8.0. Therefore, pH 7.0 was employed for further studies.
The kinetics of the electrode reaction was investigated by studying the effects of scan rate on the oxidation of SAL at the P–Gr–P/GCE. As shown in Fig. 4D, with the increase of the scan rate, the anodic peak current also increased. The anodic peak current increased linearly with the natural logarithm of scan rates (ln![[thin space (1/6-em)]](https://www.rsc.org/images/entities/char_2009.gif) v) from 10 mV−1 to 400 mV−1 (Fig. 4E), corresponding to the following equation: I (μA) = −12.974 + 5.793 ln
v) from 10 mV−1 to 400 mV−1 (Fig. 4E), corresponding to the following equation: I (μA) = −12.974 + 5.793 ln![[thin space (1/6-em)]](https://www.rsc.org/images/entities/char_2009.gif) v (R2 = 0.990), suggesting that the electrode process of SAL was diffusion-controlled.45 Similarly, a linear relationship between Epa and ln
v (R2 = 0.990), suggesting that the electrode process of SAL was diffusion-controlled.45 Similarly, a linear relationship between Epa and ln![[thin space (1/6-em)]](https://www.rsc.org/images/entities/char_2009.gif) v was also observed in the range of 10–400 mV s−1 (Fig. 4F), and the linear regression equation can be expressed as Epa = 0.502 + 0.024 ln
v was also observed in the range of 10–400 mV s−1 (Fig. 4F), and the linear regression equation can be expressed as Epa = 0.502 + 0.024 ln![[thin space (1/6-em)]](https://www.rsc.org/images/entities/char_2009.gif) v (R2 = 0.991) according to the following equation:46
v (R2 = 0.991) according to the following equation:46
Epa = E0′ + (RT/αnF)[0.780 + ln(DR1/2/k0) + ln(αnFv/RT)1/2] = K + (RT/2αnF) ln![[thin space (1/6-em)]](https://www.rsc.org/images/entities/char_2009.gif) v v |
3.4. Chronocoulometry
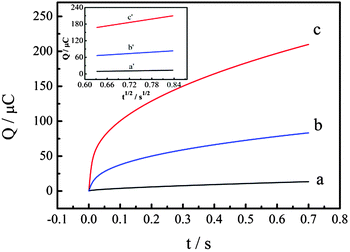
The electrochemically effective surface areas (A) of bare GCE (Fig. 5, curve a), PtNPs–Gr/GCE (prepared by one-step electrodeposition) (Fig. 5, curve b) and P–Gr–P/GCE (Fig. 5, curve c) have been investigated. According to the previous literature,47A can be determined by chronocoulometry using 0.1 mM K3[Fe(CN)6] containing 1 M KCl as a model complex, based on the Anson equation:| Q(t) = 2nFAcD1/2t1/2/π1/2 + Qdl + Qads |
3.5. Determination of SAL on P–Gr–P/GCE
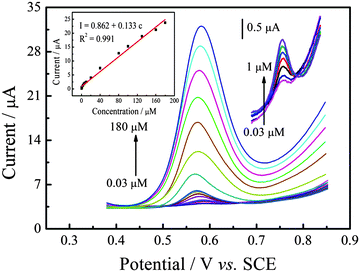
Under the optimal experimental conditions established above, the calibration curves of SAL in PBS were measured by differential pulse voltammetry (DPV). Fig. 6 shows the typical differential pulse voltammograms obtained from different SAL concentrations at P–Gr–P/GCE. As can be seen, the peak current was proportional to the concentration of SAL over the 0.03 to 180 μM range with the regression equation of I (μM) = 0.862 + 0.133c (R2 = 0.991) (inset of Fig. 6). The detection limit was down to 9 nM (S/N = 3). Simultaneously, the comparison of P–Gr–P/GCE with other modified electrodes for SAL determination is also listed in Table 1. It can be seen that P–Gr–P/GCE was more sensitive with a wider linear range and a lower detection limit. These results indicate that P–Gr–P/GCE is an appropriate platform for the determination of SAL.| Electrode | Methods | Linear range (μM) | Detection limit (μM) | Ref. |
|---|---|---|---|---|
| a Single-walled-multi-walled and nafion composites. b Nano gold particle modified indium tin oxide. c Pre-treated carbon paste electrode. d Multi-carbon nanotubes. e Cyclic voltammetry. f Linear sweep voltammetry. g Differential pulse voltammetry. h Osteryoung square wave voltammetry. i Square wave voltammetry. j The linear range and detection limit in the literature are 50–2000 ng mL−1 and 75 ng mL−1, respectively, equal to 0.21–8.36 μM and 0.31 μM, respectively. | ||||
| SWCNT-NFa/GCE | CVe | 0.1–0.3 | 0.1 | 48 |
| LSVf | 0.3–3.3 | |||
| DPVg | 3.3–33.3 | |||
| NGITOb | OSWVh | 0.21–8.36j | 0.31j | 49 |
| PTCPEc | CV | 2.5–47.5 | 0.025 | 50 |
| MWNTd/GCE | SWVi | 0.8–10 | 0.7 | 51 |
| P–Gr–P/GCE | DPV | 0.03–180 | 0.009 | This work |
3.6. Stability and reproducibility
The stability of P–Gr–P/GCE was verified by recording successive cyclic voltammograms in the potential range of 0.3–0.9 V. No obvious change could be observed in cyclic voltammograms after 10 cycles (current signal change less than 2%) and the electrodes also remained stable in the presence of SAL up to 20 successive cycles (current change less than 4%) (Fig. S1, ESI†), which indicated that P–Gr–P/GCE exhibited high stability. Furthermore, no significant change of the oxidation currents can be observed (current change less than 3.06%) after the electrodes have been stored at room temperature for more than 30 days (Fig. S2, ESI†), indicating that the sensor has acceptable reproducibility and repeatability.3.7. Real sample analysis
Furthermore, the proposed sensor was applied to the determination of SAL in urine samples. Urine samples were obtained from healthy volunteers, which were diluted 50-fold with 0.1 M PBS (pH 7.0) and centrifuged at 5000 rpm for 5 min to remove the suspended particles. The analytical applicability of the sensor was evaluated by determining the recovery of six target samples with different concentrations by the standard addition method. As can be seen in Table 2, the results were satisfactory with a recovery in the range from 95.0% to 105.0%, indicating that the proposed method can be successfully applied in the detection of SAL concentration in urine samples.4. Conclusions
In summary, a simple two-step approach has been developed for the preparation of the Pt–graphene–Pt composite with a novel sandwich-like structure. Pt nanoparticles not only acted as a spacer between graphene sheets to prevent aggregation, but also accelerated the electron transfer. Pt–graphene–Pt modified GCE showed a good performance in the sensitive determination of salbutamol due to its excellent electronic conductivity and large specific surface area. Under optimized conditions, the Pt–graphene–Pt modified glass carbon electrode exhibited a good performance in terms of low limit of detection (9 nM) and a wide linear range (0.03–180 μM); it also exhibited good stability, repeatability and reproducibility. These results indicate that the novel sandwich-like structure of Pt–graphene–Pt is scientifically interesting and has great potential for use in sensors, nanoelectronics, and other electrochemical applications.Acknowledgements
We are grateful to the National Natural Science Foundation of China (51272096 and 51302117), the Natural Science Foundation of Jiangxi Province (20122BAB216011 and 20151BAB203018), the Jiangxi Provincial Department of Education (GJJ13258), the Postdoctoral Science Foundation of China (2014M551857 and 2015T80688), the Postdoctoral Science Foundation of Jiangxi Province (2014KY14) and the Science and Technology Landing Plan of Universities in Jiangxi province (KJLD14069 and KJLD12081) for their financial support of this work.Notes and references
- C. X. Guo, H. B. Yang, Z. M. Sheng, Z. S. Lu, Q. L. Song and C. M. Li, Angew. Chem., Int. Ed., 2010, 49, 3014 CrossRef CAS PubMed.
- X. Jia, J. Campos-Delgado, M. Terrones, V. Meunier and M. S. Dresselhaus, Nanoscale, 2011, 3, 86 RSC.
- S. A. Ozkan, B. Uslu and P. Zuman, Anal. Chim. Acta, 2002, 457, 265 CrossRef CAS.
- B. Uslu and S. A. Ozkan, Electrochim. Acta, 2004, 49, 4321 CrossRef CAS.
- A. K. Geim and K. S. Novoselov, Nat. Mater., 2007, 6, 183 CrossRef CAS PubMed.
- C. Lee, X. D. Wei, J. W. Kysar and J. Hone, Science, 2008, 321, 385 CrossRef CAS PubMed.
- R. F. Service, Science, 2009, 324, 875 CrossRef CAS PubMed.
- E. Yoo, J. Kim, E. Hosono, H. S. Zhou, T. Kudo and I. Honma, Nano Lett., 2008, 8, 2277 CrossRef CAS PubMed.
- S. Chen, J. W. Zhu, X. D. Wu, Q. F. Han and X. Wang, ACS Nano, 2010, 4, 2822 CrossRef CAS PubMed.
- L. M. Lu, H. B. Li, F. L. Qu, X. B. Zhang, G. L. Shen and R. Q. Yu, Biosens. Bioelectron., 2011, 26, 3500 CrossRef CAS PubMed.
- L. Zhang, Y. P. Wen, Y. Y. Yao, Z. F. Wang, X. M. Duan and J. K. Xu, Chin. Chem. Lett., 2014, 25, 517 CrossRef CAS.
- F. L. Qu, T. Li and M. H. Yang, Biosens. Bioelectron., 2011, 26, 3927 CrossRef CAS PubMed.
- Y. Si and E. T. Samulski, Chem. Mater., 2008, 20, 6792 CrossRef CAS.
- V. C. Tung, L. M. Chen, M. J. Allen, J. K. Wassei, K. Nelson, R. B. Kaner and Y. Yang, Nano Lett., 2009, 9, 1949 CrossRef CAS PubMed.
- Z. J. Fan, J. Yan, L. J. Zhi, Q. Zhang, T. Wei, J. Feng, M. L. Zhang, W. Z. Qian and F. Wei, Adv. Mater., 2010, 22, 3723 CrossRef CAS PubMed.
- C. H. Lu, H. H. Yang, C. L. Zhu, X. Chen and G. N. Chen, Angew. Chem., Int. Ed., 2009, 121, 4879 CrossRef.
- H. X. Chang, L. H. Tang, Y. Wang, J. H. Jiang and J. H. Li, Anal. Chem., 2010, 82, 2341 CrossRef CAS PubMed.
- T. Ramanathan, S. Stankovich, D. A. Dikin, H. Liu, H. Shen, S. T. Nguyen and L. C. Brinson, J. Polym. Sci., Part B: Polym. Phys., 2007, 45, 2097 CrossRef CAS.
- X. S. Zhou, T. B. Wu, B. J. Hu, G. Y. Yang and B. X. Han, Chem. Commun., 2010, 46, 3663 RSC.
- R. Verdejo, M. Martin-Gallego, L. J. Romasanta, M. Hernández, M. M. Bernal and M. A. Lopez-Manchado, J. Mater. Chem., 2008, 18, 2221 RSC.
- X. Z. Zhou, X. Huang, X. Y. Qi, S. X. Wu, C. Xue, F. Y. C. Boey, Q. Y. Yan, P. Chen and H. Zhang, J. Phys. Chem. C, 2009, 113, 10842 CAS.
- J. B. Liu, S. H. Fu, B. Yuan, Y. L. Li and Z. X. Deng, J. Am. Chem. Soc., 2010, 132, 7279 CrossRef CAS PubMed.
- J. F. Shen, Y. Z. Hu, M. Shi, N. Li, H. W. Ma and M. X. Ye, J. Phys. Chem. C, 2010, 114, 1498 CAS.
- A. Liu, T. Xu, J. Tang, H. Wu, T. Zhao and W. Tang, Electrochim. Acta, 2014, 119, 43 CrossRef CAS.
- Y. Chu, Z. Wang and Q. Pan, ACS Appl. Mater. Interfaces, 2014, 6, 8378 CAS.
- M. Li, X. Bo, Z. Mu, Y. F. Zhang and L. Guo, Sens. Actuators, B, 2014, 192, 261 CrossRef CAS.
- L. Wang and J. H. Ma, Acta Phys.-Chim. Sin., 2014, 30, 1267 CAS.
- Y. H. Lu, M. Zhou, C. Zhang and Y. P. Feng, J. Phys. Chem. C, 2009, 113, 20156 CAS.
- M. H. Yang, Y. H. Yang, Y. L. Liu, G. L. Shen and R. Q. Yu, Biosens. Bioelectron., 2006, 21, 1125 CrossRef CAS PubMed.
- E. Antolini, T. Lopes and E. R. Gonzalez, J. Alloys Compd., 2008, 461, 253 CrossRef CAS.
- A. Hauch and A. Georg, Electrochim. Acta, 2001, 46, 3457 CrossRef CAS.
- E. Yoo, T. Okata, T. Akita, M. Kohyama, J. Nakamura and I. Honma, Nano Lett., 2009, 9, 2255 CrossRef CAS PubMed.
- Y. M. Li, L. H. Tang and J. H. Li, Electrochem. Commun., 2009, 11, 846 CrossRef CAS.
- S. Sharma, A. Ganguly, P. Papakonstantinou, X. Miao, M. Li, J. L. Hutchison, M. Delichatsios and S. Ukleja, J. Phys. Chem. C, 2010, 114, 19459 CAS.
- C. Chen, M. Long, H. Wu and W. Cai, Sci. China: Chem., 2013, 56, 354 CrossRef CAS.
- M. Q. Yang, X. Y. Pan, N. Zhang and Y. J. Xu, CrystEngComm, 2013, 15, 6819 RSC.
- L. N. Zhang, H. H. Deng, F. L. Lin, X. W. Xu, S. H. Weng, A. L. Liu, X. H. Lin, X. H. Xia and W. Chen, Anal. Chem., 2014, 86, 2711 CrossRef CAS PubMed.
- J. I. Paredes, S. Villar-Rodil, P. Solís-Fernández, A. Martínez-Alonso and J. M. D. Tascon, Langmuir, 2009, 25, 5957 CrossRef CAS PubMed.
- S. Woo, Y. R. Kim, T. D. Chung, Y. Piao and H. Kim, Electrochim. Acta, 2012, 59, 509 CrossRef CAS.
- C. Chen, M. Long, H. Wu and W. Cai, Sci. China: Chem., 2013, 56, 354 CrossRef CAS.
- J. Xu, Y. Li, J. Cao, R. Meng, W. Wang and Z. Chen, Catal. Sci. Technol., 2015, 5, 1821 CAS.
- J. I. Paredes, S. Villar-Rodil, A. Martınez-Alonso and J. M. D. Tascón, Langmuir, 2008, 24, 10560 CrossRef CAS PubMed.
- D. Li, M. B. Muller, S. Gilje, R. B. Kaner and G. G. Wallace, Nat. Nanotechnol., 2008, 3, 101 CrossRef CAS PubMed.
- Y. Gao, L. Wu, K. Zhang, J. Xu, L. Lu, X. Zhu and Y. Wu, Chin. Chem. Lett., 2015, 26, 613 CrossRef CAS.
- A. J. Bard and L. R. Faulkner, Electrochemical Methods, Wiley, New York, 1980 Search PubMed.
- E. Laviron, J. Electroanal. Chem., 1974, 52, 355 CrossRef CAS.
- F. Anson, Anal. Chem., 1964, 36, 932 CrossRef CAS.
- K. C. Lin, C. P. Hong and S. M. Chen, Sens. Actuators, B, 2013, 177, 428 CrossRef CAS.
- R. N. Goyal, M. Oyama and S. P. Singh, J. Electroanal. Chem., 2007, 611, 140 CrossRef CAS.
- D. Boyd, J. R. B. Rodriguez, A. J. M. Ordieres, P. T. Blanco and M. R. Smyth, Analyst, 1994, 119, 1979 RSC.
- Y. L. Wei, Q. Zhang, C. Shao, C. Li, L. P. Zhang and X. L. Li, J. Anal. Chem., 2010, 65, 398 CrossRef CAS.
Footnotes |
| † Electronic supplementary information (ESI) available: The cycling stability and long-term storage stability of P–Gr–P/GCE. See DOI: 10.1039/c5nj02278a |
| ‡ These authors contributed equally to this work and should be considered co-first authors. |
| This journal is © The Royal Society of Chemistry and the Centre National de la Recherche Scientifique 2016 |

