Novel 3D flower-like CoNi2S4/carbon nanotube composites as high-performance electrode materials for supercapacitors
Zhihong
Ai
,
Zhonghua
Hu
*,
Yafei
Liu
,
Mengxuan
Fan
and
Peipei
Liu
Department of Chemistry, Tongji University, 1239 Siping Road, Shanghai 200092, China. E-mail: huzh@tongji.edu.cn; Fax: +86-21-65982287; Tel: +86-21-65982594
First published on 27th October 2015
Abstract
Novel 3D flower-like CoNi2S4/carbon nanotube composites with a porous structure were designed through a facile precursor transformation approach as electrode materials for supercapacitors. The resulting samples are characterized by X-ray diffraction, Raman spectra, energy dispersive spectroscopy, field emission scanning electron microscopy, transmission electron microscopy, and nitrogen adsorption–desorption. Their electrochemical performance was investigated by means of cyclic voltammetry, galvanostatic charge–discharge, impedance spectra and cycle life. By selecting carbon nanotubes as the conductive support for the growth of CoNi2S4, the as-obtained CoNi2S4/carbon nanotube composites displayed an ultrahigh specific capacitance of 2094 F g−1 at 1 A g−1 and a good rate capability (72% capacity retention at 10 A g−1). These results above suggest the great potential of the unique flower-like CoNi2S4/carbon nanotube composites in the development of high-performance electrode materials for supercapacitors.
1. Introduction
Nowadays, supercapacitors have attracted considerable attention as promising energy storage devices applied in portable electronics and electric or hybrid electric vehicles because of their advantages of fast charge–discharge capability, long lifespan and high energy and power density.1,2 Generally, the performance of supercapacitors mainly depends on the properties of their electrode materials. The three types of electrode materials used in the supercapacitors are carbon materials, conductive polymers and metal oxides. Carbon based materials have advantages in the aspects of abundant resources, high stability and conductivity, but they have a relatively low specific capacitance from their electronic double layer capacitance. Conductive polymers have higher specific capacitance than carbons, but with poor cycling stability.3 Transition metal oxides usually possess rich oxidation states that are in favor of a high specific capacitance4,5 and the stability is between that of carbons and conductive polymers; however, their conductivity needs to be further improved. Compared with one-component metal oxides NiO and Co3O4, for example, two-component metal oxides, such as spinel NiCo2O4, exhibit a higher electronic conductivity and more redox reactions could be carried out to produce faradic capacitance. However, NiCo2O4 as an electrode material still suffers the disadvantages of slow redox kinetics, poor electrical conductivity and low mechanical stability. In order to solve these problems, highly conductive carbon materials such as active carbon, carbon nanotubes (CNTs) and graphene are combined with metal oxides to form high-performance composite electrode materials, such as NiO/graphene,6 MnO2/CNT,7 V2O5/CNT,8 V2O5/graphene,9 NiCo2O4/CNT,10,11 NiCo2O4/graphene12 and RuO2/graphene.13More recently, NiCo2S4 has been reported to exhibit higher conductivity than NiCo2O4 owing to the lower optical band gap energy than that of NiCo2O4.14 Similar with NiCo2O4, CoNi2S4 is also a binary metallic species and possesses richer valence states than the corresponding one-component metallic sulfides nickel sulfide (NiS) and cobalt sulfide (Co9S8).15 Chen14 and his co-workers synthesized an urchin-like NiCo2S4 electrode material by a precursor transformation method and the as-obtained product exhibits a high specific capacitance of 1025 F g−1 at 1 A g−1. More recently, Yu et al. synthesized uniform NixCo3−xS4 hollow nanoprisms16 with thioacetamide (TAA) as the sulfur source. Zhang et al.17 synthesized urchin-, tube-, flower-, and cubic-like NiCo2S4 microstructures through controlling the composition of the solvents and found that the solvent polarity and solubility have a significant effect on the process of nucleation and crystal growth. In order to increase the efficient utilization of electrodes, electroactive materials supported by conductive substrates, such as Ni foam,18 graphene19,20 and carbon cloth,21,22 were also reported. Their electrochemical properties were greatly improved due to the high conductivity, large surface area and three-dimensional network of these substrates. Besides them, carbon nanotubes are also highly conductive and have a large surface area, in favor of electron transportation and material loading. However, there are not very many reports on the study of the combination of CNTs and nickel cobalt sulfides, so more research needs to be done in this area, especially in the area of constructing a novel structure using them.
In this work, a new composite electrode material CoNi2S4/CNT was designed by a two-step approach, including the deposition of the Co–Ni precursor on CNTs and the transformation of the Co–Ni precursor via anion exchange. Before the reaction, CNTs were pretreated with acid to increase the amount of oxygen-containing functional groups on the CNT surface in order to improve the deposition of the Co–Ni precursor on the CNT substrate. In the synthesis process, urea, a weak base, was used as a precipitant to control the crystal growth of the nickel–cobalt precursor in the first step and Na2S was taken as the sulfur source for the anion exchange reaction in the second step. The as-obtained CoNi2S4/CNT composites were characterized by XRD, Raman spectra, EDS, FESEM, BET and electrochemical tests. The relation between their unique structural properties and capacitive performance was investigated.
2. Experimental
2.1 Preparation of CoNi2S4/CNT composite
Nickel sulfate hexahydrate (NiSO4·6H2O), cobalt sulfate heptahydrate (CoSO4·7H2O), and urea (CO(NH2)2) were purchased from Sigma-Aldrich. All reagents are of analytical grade. MWCNTs (95% purity, average pore size: <8 nm, length: 10–30 μm) were purchased from Timesnano, China. The MWCNTs were pretreated by refluxing in 30 wt% nitrate acid for 12 h at 100 °C. Then the acid-treated CNTs were collected by vacuum filtration and dried at 80 °C for 12 h.A facile hydrothermal method was used for the synthesis of the Ni–Co sulfide/CNTs composite. Firstly, 4 mmol NiSO4·6H2O, 2 mmol CoSO4·7H2O and 24 mmol CO(NH2)2 were added into 40 mL DI water and stirred for 30 minutes to form a homogeneous solution. Meanwhile, 40 mg of acid-treated CNTs and 15 mg of polyvinyl pyrrolidone (PVP) were put in 40 mL of ethanol and underwent ultrasonic treatment for 30 min. Then the two solutions were mixed and underwent ultrasonic treatment for 30 minutes. Secondly, the mixed solution was transferred into a Teflon-lined stainless steel autoclave and maintained at 120 °C for 6 h. After cooling down to room temperature, the precursor was separated by centrifugation, washed with DI water and ethanol several times, and dried at 80 °C for 12 h.
0.15 g of precursor and 0.54 g of Na2S·9H2O were added into 80 mL of DI water with vigorous stirring for 30 minutes. Then the mixture was transferred into a 100 mL Teflon-lined stainless steel autoclave and maintained at 160 °C for 12 h. After cooling down, the product was collected and washed with DI water and ethanol several times, and finally dried at 80 °C.
To study the influence of the CNT content on the composite, different CNT amounts, 0, 30, 40, 50 and 60 mg, were added in the synthesis. The obtained composite samples are denoted as M-0, M-30, M-40, M-50 and M-60, respectively.
2.2 Materials characterization
A CoNi2S4/CNTs composite was finally obtained through the above precursor transformation approach. The crystal structure of the composite was studied by X-ray diffraction (XRD, D/max250VB3 + /PC, Rigaku) at a scan rate of 1° s−1 from 10° to 80° (with Cu Ka1 radiation). The Raman spectra of the samples were studied by Laser Micro-Raman spectrometry (Raman, Invia). The morphology was observed by field emission scanning electron microscopy (FESEM, Hitachi S-4800 and JEOL JSM-6060). The elemental compositions were analyzed by employing energy dispersive spectroscopy (EDS, 200 kV). The specific surface area and pore size distribution of the prepared samples were estimated according to N2 adsorption/desorption isotherms at 77 K (Micromeritics, Tristar 3000 gas adsorption analyzer).2.3 Electrochemical measurements
The electrochemical properties of the CoNi2S4/CNT working electrode were investigated on an electrochemical workstation (CHI660C, Chenhua, Shanghai) by using a standard three-electrode system. The working electrodes were fabricated by mixing the CoNi2S4/CNT composite, acetylene black and polytetrafluoroethylene (PTFE) in a weight ratio of 80![[thin space (1/6-em)]](https://www.rsc.org/images/entities/char_2009.gif) :
:![[thin space (1/6-em)]](https://www.rsc.org/images/entities/char_2009.gif) 10
10![[thin space (1/6-em)]](https://www.rsc.org/images/entities/char_2009.gif) :
:![[thin space (1/6-em)]](https://www.rsc.org/images/entities/char_2009.gif) 10 and then adding about 5 mL of ethanol into the mixture and dispersing in an ultrasonic bath to form a homogeneous paste. Finally, when the ethanol was evaporated, the prepared mixtures were pressed onto a nickel grid under a pressure of 20 MPa for 60 s. 6 mol L−1 KOH aqueous solution was used as the electrolyte; a nickel grid and a saturated calomel electrode (SCE) served as the counter and reference electrodes, respectively. The specific capacitance was strictly and carefully calculated from the discharge curves based on the following equation:
10 and then adding about 5 mL of ethanol into the mixture and dispersing in an ultrasonic bath to form a homogeneous paste. Finally, when the ethanol was evaporated, the prepared mixtures were pressed onto a nickel grid under a pressure of 20 MPa for 60 s. 6 mol L−1 KOH aqueous solution was used as the electrolyte; a nickel grid and a saturated calomel electrode (SCE) served as the counter and reference electrodes, respectively. The specific capacitance was strictly and carefully calculated from the discharge curves based on the following equation: | (1) |
3. Results and discussion
3.1 Structure characterization and morphology analysis
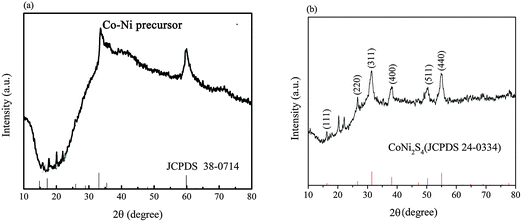
Fig. 1a shows the XRD patterns of the precursor. The XRD pattern of the precursor shows nearly the same pattern as that of Ni2(OH)2CO3·4H2O, except that all the diffraction peaks slightly shift to the high diffraction direction, in accordance with the fact that Co2+ or Ni2+ always form carbonate hydroxide in a hydrothermal environment in the presence of urea. And this result further suggested that the partial substitution of Ni ions by Co ions does not change the crystal structure except several lattice parameters, owing to the similar atomic radii of Ni and Co.14,17 After anion exchange reaction with Na2S, CO32− and OH− in the precursor, nickel–cobalt carbonate and hydroxide were gradually replaced by S2− and the precursor was chemically converted into its NiCo2S4/CNT counterpart.Fig. 1b shows the XRD patterns of the as-prepared CoNi2S4/CNT sample. The characteristic peaks at 16.3°, 26.7°, 31.5°, 38.2°, 47.4°, 50.3° and 55.0°, respectively, correspond to (111), (220), (311), (400), (511) and (440) planes of the cubic CoNi2S4 phase (JCPDS Card No. 24-0334). Besides, the two weak peaks in the range between 20° and 25° are believed to be caused by the acid-treated CNTs, which always have a typical peak at 26°.23,24
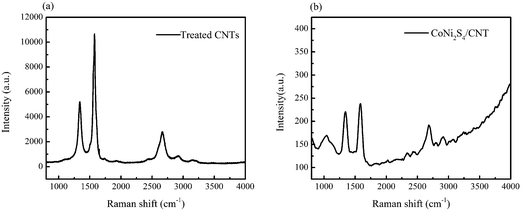
Fig. 2 presents the Raman spectra of the pure acid-treated carbon CNTs and the CoNi2S4/CNT composites in the range from 800 to 4000 cm−1. Three typical graphic peaks can be seen in both the Raman spectra of the pure acid-treated carbon CNTs and the CoNi2S4/CNT composites: the peak at 1348 cm−1, the D band, is attributed to the breathing modes of the rings or κ-point photons of A1g symmetry, the symbol of the defects on the CNT surface;25 the peak at 1585 cm−1, the G band, is attributed to the splitting E2g stretching mode of graphite; the peak at 2086 cm−1, the 2D band, results from a harmonic of the D band.26 These two Raman spectroscopies give a good demonstration about the existence of CNTs in the composites.
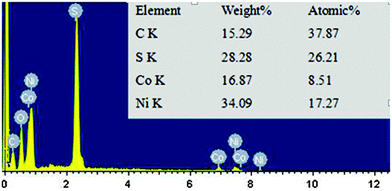
The EDS spectrum proves the existence of Co, Ni, S, C and O elements in the CoNi2S4/CNT sample as shown in Fig. 3. The elemental molar ratio of Co and Ni is 1![[thin space (1/6-em)]](https://www.rsc.org/images/entities/char_2009.gif) :
:![[thin space (1/6-em)]](https://www.rsc.org/images/entities/char_2009.gif) 2.03, which is very close to the ratio of Ni and Co atoms in the formula of CoNi2S4. Noticeably, the content of C is 37.87%, including both the small amount of C in the substrate and other C in the CNTs. The O element is supposed to come from oxygen functional groups on the surface of the CNTs or residual oxygen atoms, because of incomplete sulfur treatment.
2.03, which is very close to the ratio of Ni and Co atoms in the formula of CoNi2S4. Noticeably, the content of C is 37.87%, including both the small amount of C in the substrate and other C in the CNTs. The O element is supposed to come from oxygen functional groups on the surface of the CNTs or residual oxygen atoms, because of incomplete sulfur treatment.
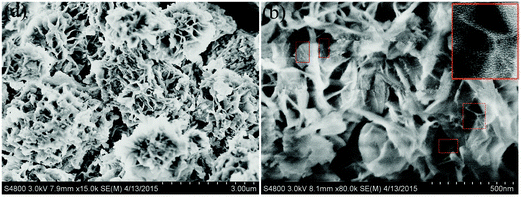
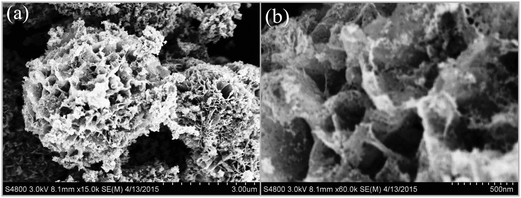
The morphological features of the CoNi2S4/CNT samples were studied by FESEM, as shown in Fig. 4. Fig. 4(a and b) displays the FESEM image of the precursor, which appears to be a 3D flower-like structure with a diameter of approximately 2 μm and is composed of lots of interconnected nanosheets of about 10 nm in thickness. Besides, it can be found that the MWCNTs (short and tiny rods) are partly enwrapped in the nanosheet and partly lie between nanosheets, as shown in the red rectangle in the high-magnification image of Fig. 4b, in favor of forming the basic 3D flower texture of the flower structure. And the shape was well preserved after sulfidation as can be seen in Fig. 5a.
Moreover, it can be observed that the surface of the nanosheets became rather rough and porous, as shown in the high-magnification images in Fig. 5b. Here, it is worthwhile to point out that in the process of crystal growth, PVP, a non-ionic surfactant, could induce faces toward different directions to grow with different speed and lead to the final flower-like structure.
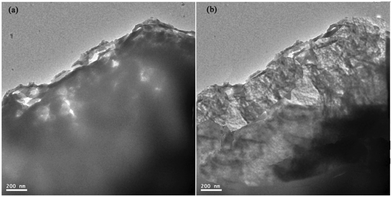
Besides, the TEM characterization of CoNi2S4 (a) and CoNi2S4/CNT (b) was also performed, as can be seen in Fig. 6. The edges of their nanosheets are presented and compared. There seem to be many slim rods in the nanosheet of CoNi2S4/CNT, which is a symbol of the existence of CNTs in the sample. But the lattice spacing was not given due to its weak crystallinity, which is in accordance with the XRD characterization results.
3.2 Electrochemical properties
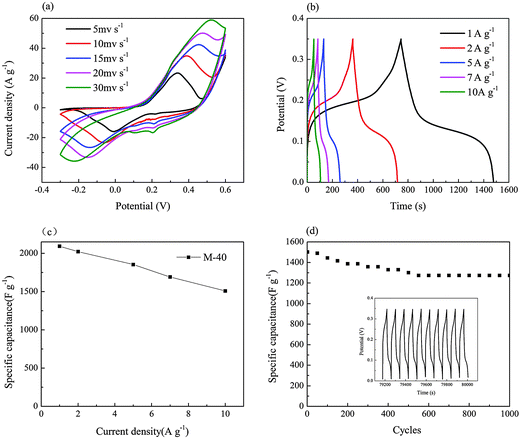
Cyclic voltammetry (CV), galvanostatic charge–discharge and electrochemical impedance spectroscopy (EIS) were performed in order to investigate the electrochemical properties of the as-obtained CoNi2S4/CNTs composites as shown in Fig. 5.Fig. 7a shows that the oxidation and reduction peaks can be clearly observed in the potential range of −0.3–0.6 V, suggesting good pseudocapacitive characteristics. With an increase in the scan rate from 5 mV s−1 to 30 mV s−1, the anodic peak shifts to a higher potential and the cathodic peak shifts to a lower potential. And more peaks appear at around 0.2 V, which may result from the abundant Faradic redox processes of Ni2+/Ni3+ and Co2+/Co3+/Co4+ transitions associated with the anion OH−. The redox reactions in the alkaline electrolyte are based on the following mechanism:27
| NiS + OH− → NiSOH + e− | (2) |
| CoS + OH− → CoSOH + e− | (3) |
| CoSOH + OH− → CoSO + H2O + e− | (4) |
The distortion of the CV curves becomes more and more serious as the scan rate increases from 5 mV s−1 to 30 mV s−1. It is because the ionic diffusion rate in the case of high scan rate was not fast enough to satisfy electronic neutralization during the redox reactions.
Fig. 7b shows the galvanostatic charge–discharge curves of the CoNi2S4/CNTs electrodes within the potential window between 0 and 0.35 V at the discharge current density of 1, 2, 5, 7 and 10 A g−1, respectively. The shape of the charge–discharge curves exhibits a typical pseudocapacitive behavior. Encouragingly, for M-40, the specific capacitance values are as high as 2094, 2022, 1855, 1694 and 1510 F g−1 at current densities of 1, 2, 5, 7 and 10 A g−1, respectively, as shown in Fig. 7c, which are much higher than those of other NiCo2S4 and CoNi2S4 materials reported in the literature as listed in Table 1. The higher capacitance of the CoNi2S4/CNTs electrode probably stemmed from its novel 3D flower-like structure with many pores formed between interconnected nanosheets, which has a high efficiency of the space and provided enough active sites for electrochemical reactions with electrolytes.
| Sample | Specific capacitance (F g−1/1 A g−1) | Rate retention (%) | Current range (A g−1) | BET (m2 g−1) | Ref. |
|---|---|---|---|---|---|
| Urchin-like NiCo2S4 | 1025 | 77.3 | 1–20 | — | 14 |
| CoNi2S4/graphene | 2009 | 49.8 | 1–20 | 48.4 | 28 |
| Nanostructured NiCo2S4 | 1050 | 66.2 | 1–50 | 20.3 | 18 |
| NiCo2S4 hollow | 895 | 65.4 | 1–20 | 30.0 | 16 |
| Nanoprisms | |||||
| NiCo2S4 nanotubes | 933 | 58.9 | 1–5 | 32.0 | 29 |
| NiCo2S4 nanosheets on graphene | 1300 (3 A g−1) | 52.3 | 3–20 | 79.1 | 20 |
| Porous NiCo2S4 hexagonal nanoplates | 966 | 95.5 | 1–10 | 17.4 | 30 |
| CoNi2S4 nanoparticles | 1169 | 60.1 | 1–5 | 21.6 | 18 |
| Mesoporous NiCo2S4 nanoparticles | 972 (2 A g−1) | 86.8 | 2–20 | 42.8 | 31 |
| Ball-in-ball hollow NiCo2S4 spheres | 1036 | 68.1 | 1–20 | — | 32 |
| Hollow tubular NiCo2S4 | 1046 (2 A g−1) | 68.0 | 2–20 | 108.4 | 33 |
| 3D flower-like CoNi2S4 | 2094 | 72.0 | 1–10 | 31.5 | Our work |
Cycle stability is also an important factor determining the electrochemical performance of the electrode materials. In the present work, cycle stability experiments were carried out at a charge–discharge current density of 10 A g−1 in the potential range of 0–0.35 V for 1000 repetitive cycles, as shown in Fig. 7(d). The specific capacitance loss after 1000 cycles was 16%, suggesting that the capacity retention was as high as 84%. The last 10 cycles are presented as an inset. It was found that the shapes of the charge–discharge curves were nearly unchanged, indicating the good reversibility and cyclic life of CoNi2S4/CNT electrodes.
3.3 The influence of the CNTs added to the composite on the electrochemical properties
Nitrogen adsorption–desorption and electrochemical tests were performed in order to investigate the influence of different CNT amounts added to the composite on the properties of the final samples.Fig. 8(a) shows the typical CV curves of M-0, M-30, M-40, M-50, and M-60 at a scanning rate of 5 mV s−1 in the potential range from −0.3 V to 0.6 V. Evidently, M-40 has the largest CV area, meaning that the M-40 electrode has the highest specific capacitance. The specific capacitance of the composite electrodes increases with increasing CNT addition from 0 mg to 40 mg, but decreases from 40 mg to 60 mg. Thus the addition of 40 mg of CNTs to the composite is the optimal value. The galvanostatic charge–discharge at 1 A g−1 in a potential window of 0–0.35 V is shown in Fig. 8(b). The sample M-40 exhibits the longest discharge time, suggesting that it has the highest specific capacitance. Reasonably, it is because of the synergistic effect of the pseudocapacitance of CoNi2S4 and the double-layer capacitance of the CNTs.34 But when the content of CNTs exceeds 40 mg, the double-layer capacitance of the CNTs has a greater effect on the electrodes compared with the pseudocapacitance of CoNi2S4, so that the capacitance is decreased instead.
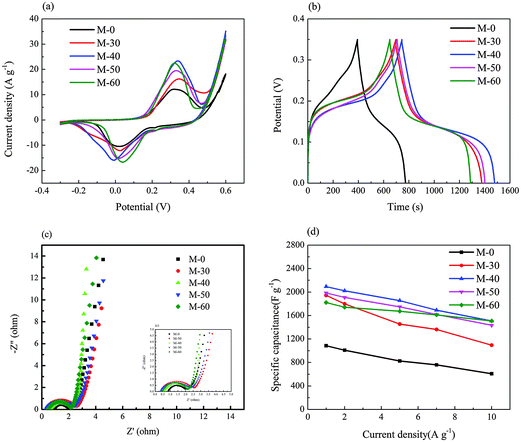 | ||
| Fig. 8 (a) CVs; (b) charge–discharge curves; (c) impedance spectra; (d) specific change with different current density of the samples M-0, M-30, M-40, M-50, and M-60. | ||
The test result of electrochemical impedance spectroscopy (EIS) is shown in Fig. 8(c); all EIS curves have a similar shape consisting of a semicircle on the left and an inclined line on the right. Among them, the inclined line of M-40 in the low-frequency region is almost parallel to the vertical axis, which means that the Warburg resistance is rather small and exhibits a fast ion-diffusion behavior in the electrolyte. The change in capacitance with the increasing current density, also called rate capacity, is another important factor other than the specific capacitance and cycle life. As shown in Fig. 8(d), when the current density changes from 1 A g−1 to 10 A g−1, the capacitance retention of M-0, M-30, M-40, M-50, and M-60 are 56%, 57%, 72%, 73%, and 83%, respectively. Interestingly, the rate capacity was improved with the increasing amount of CNTs, which may due to the increase in the conductivity that facilitates access for electron transfer and benefits the fast charging and discharging.14
BET characterization was carried out to investigate the specific surface area and pore-size distribution of the as-prepared samples. The adsorption/desorption isotherms are of the combination of Type I and Type V isotherms as shown in Fig. 9(a), and with a typical H3 hysteresis loop, suggesting the presence of mesopores for CoNi2S4/CNTs composite samples M-0 and M-40. Their pore size distributions are shown in Fig. 9(b). It is clear that most pores are in the range of 4–15 nm. The mesoporous structure possibly came from the slot pores35 between the interconnected nanosheets in the flower structure.
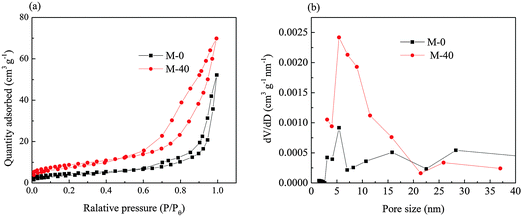 | ||
| Fig. 9 (a) Nitrogen adsorption–desorption isotherms and (b) the corresponding pore size distributions of M-0 and M-40. | ||
The specific surface area, pore volume and average pore size details are listed in Table 2.
| Samples | S BET (m2 g−1) | V tot (cm3 g−1) | PS (nm) |
|---|---|---|---|
| S BET, BET specific surface area; Vtot, total pore volume; PS, average pore size. | |||
| M-0 | 16.2 | 0.081 | 19.9 |
| M-40 | 31.5 | 0.108 | 13.7 |
It is noteworthy to point out that the specific area of M-40 was much larger and the average pore size became smaller than that of M-0. The improved specific surface area can be attributed to its hierarchical structure with CNTs embedded in and between the sheets consisting of the flower structure, which is beneficial to the mass and charge transport during the electrode reaction. Besides, the average pore size of M-40 shifted to a smaller size than that of M-0, leading to higher specific surface area and more active sites for electrochemical reactions. Thus both the improved specific area and reasonable mesopore size distribution are responsible for the enhanced electrochemical properties.
4. Conclusion
A 3D flower-like CoNi2S4/carbon nanotube composite was synthesized by a facile Co–Ni precursor transformation approach via anion exchange with Na2S. It exhibits ultrahigh specific capacitance of 2094 F g−1 at 1 A g−1 and a high capacity retention rate of 72% when the discharge current density is increased by ten times from 1 A g−1 to 10 A g−1. Additionally, a desirable cycling stability (83.4% of the initial capacity retention after 1000 cycles at 10 A g−1) was achieved. Such outstanding capacitive behaviors of the CoNi2S4/carbon nanotube composite are mainly ascribed to the rich redox reactions that are contributed by both nickel and cobalt ions, the high conductivity of carbon nanotubes, the novel 3D flower-like structure and the optimal mesopore size. The novel CoNi2S4/carbon nanotube composite could be a promising electrode material for high-performance supercapacitors.Acknowledgements
This work is supported by the Tongji University Research Foundation (1380219039).References
- D. P. Dubal, P. Gomez-Romero, B. R. Sankapal and R. Holze, Nano Energy, 2015, 11, 377 CrossRef CAS.
- L. Yu, H. Wu, T. Wu and C. Yuan, RSC Adv., 2013, 3, 23709 RSC.
- H. Chen, J. Jiang, L. Zhang, D. Xia, Y. Zhao, D. Guo, T. Qi and H. Wan, J. Power Sources, 2014, 254, 249 CrossRef CAS.
- F. Cao, G. X. Pan, X. H. Xia, P. S. Tang and H. F. Chen, J. Power Sources, 2014, 264, 161 CrossRef CAS.
- Y. Wang, A. Pan, Q. Zhu, Z. Nie, Y. Zhang, Y. Tang, S. Liang and G. Cao, J. Power Sources, 2014, 272, 107 CrossRef CAS.
- X. Feng, J. Zhou, L. Wang, Y. Li, Z. Huang, S. Chen, Y. Ma, L. Wang and X. Yan, New J. Chem., 2015, 39, 4026 RSC.
- L. Chen, Y. Zhou, H. Dai, T. Yu, J. Liu and Z. Zou, Nano Energy, 2015, 11, 697 CrossRef CAS.
- I. Shakir, Z. Ali, J. Bae, J. Park and D. J. Kang, Nanoscale, 2014, 6, 4125 RSC.
- F. Cai, Y. Kang, H. Chen, M. Chen and Q. Li, J. Phys. Chem. A, 2014, 2, 11509 CAS.
- I. Shakir, Electrochim. Acta, 2014, 132, 490 CrossRef CAS.
- X. Wang, X. Han, M. Lim, N. Singh, C. L. Gan, M. Jan and P. S. Lee, J. Phys. Chem. C, 2012, 116, 12448 CAS.
- E. Mitchell, A. Jimenez, R. Gupta, B. K. Gupta, K. Ramasamy, M. Shahabuddin and S. R. Mishra, New J. Chem., 2015, 39, 2181 RSC.
- Y. Yang, Y. Liang, Y. Zhang, Z. Zhang, Z. Li and Z. Hu, New J. Chem., 2015, 39, 4035 RSC.
- H. Chen, J. Jiang, L. Zhang, H. Wan, T. Qi and D. Xia, Nanoscale, 2013, 5, 8879 RSC.
- J. Xiao, L. Wan, S. Yang, F. Xiao and S. Wang, Nano Lett., 2014, 14, 831 CrossRef CAS PubMed.
- L. Yu, L. Zhang, H. B. Wu and X. W. Lou, Angew. Chem., 2014, 53, 3711 CrossRef CAS PubMed.
- Y. Zhang, M. Ma, J. Yang, C. Sun, H. Su, W. Huang and X. Dong, Nanoscale, 2014, 6, 9824 RSC.
- W. Du, Z. Zhu, Y. Wang, J. Liu, W. Yang, X. Qian and H. Pang, RSC Adv., 2014, 4, 6998 RSC.
- S. Peng, L. Li, C. Li, H. Tan, R. Cai, H. Yu, S. Mhaisalkar, M. Srinivasan, S. Ramakrishna and Q. Yan, Chem. Commun., 2013, 49, 10178 RSC.
- J. Tang, J. Shen, N. Li and M. Ye, Ceram. Int., 2015, 41, 6203 CrossRef CAS.
- M. Sun, J. Tie, G. Cheng, T. Lin, S. Peng, F. Deng, F. Ye and L. Yu, J. Mater. Chem. A, 2015, 3, 1730 CAS.
- S. Liu, Y. Liu, W. Song, J. Song, C. Wang, G. Shao and X. Qin, J. Solid State Electrochem., 2015, 19, 1321 CrossRef CAS.
- H. Cheng, A. D. Su, S. Li, S. T. Nguyen, L. Lu, C. Y. H. Lim and H. M. Duong, Chem. Phys. Lett., 2014, 601, 168 CrossRef CAS.
- Z. Tang, C. Tang and H. Gong, Adv. Funct. Mater., 2012, 22, 1272 CrossRef CAS.
- X. Wang, X. Han, M. Lim, N. Singh, C. L. Gan, M. Jan and P. S. Lee, J. Phys. Chem. C, 2012, 116, 12448 CAS.
- M. S. Dresselhaus, G. Dresselhaus, R. Saito and A. Jorio, Phys. Rep., 2005, 409, 47 CrossRef.
- T. Zhu, Z. Wang, S. Ding, J. S. Chen and X. W. Lou, RSC Adv., 2011, 1, 397 RSC.
- W. Du, Z. Wang, Z. Zhu, S. Hu, X. Zhu, Y. Shi, H. Pang and X. Qian, J. Mater. Chem. A, 2014, 2, 9613 CAS.
- H. Wan, J. Jiang, J. Yu, K. Xu, L. Miao, L. Zhang, H. Chen and Y. Ruan, CrystEngComm, 2013, 15, 7649 RSC.
- J. Yang, W. Guo, D. Li, Q. Qin, J. Zhang, C. Wei, H. Fan, L. Wu and W. Zheng, Electrochim. Acta, 2014, 144, 16 CrossRef CAS.
- Y. Zhu, Z. Wu, M. Jing, X. Yang, W. Song and X. Ji, J. Power Sources, 2015, 273, 584 CrossRef CAS.
- L. Shen, L. Yu, H. B. Wu, X. Y. Yu, X. Zhang and X. W. Lou, Nat. Commun., 2015, 6, 6694 CrossRef CAS PubMed.
- Y. M. Chen, Z. Li and X. W. Lou, Angew. Chem., Int. Ed., 2015, 54, 10521 CrossRef CAS PubMed.
- P. Liu, Z. Hu, Y. Liu, M. Yao and Q. Zhang, J. Alloys Compd., 2015, 622, 805 CrossRef CAS.
- D. Du, Z. Hu, Y. Liu, Y. Deng and J. Liu, J. Alloys Compd., 2014, 589, 82 CrossRef CAS.
| This journal is © The Royal Society of Chemistry and the Centre National de la Recherche Scientifique 2016 |

