Porous CuO nanostructure as a reusable catalyst for oxidative degradation of organic water pollutants†
Pangkita
Deka
,
Ramesh C.
Deka
* and
Pankaj
Bharali
*
Department of Chemical Sciences, Tezpur University, Napaam – 784 028, India. E-mail: pankajb@tezu.ernet.in; ramesh@tezu.ernet.in; Fax: +91 3712 267005; Fax: +91 3712 267006; Tel: +91 3712 275064
First published on 30th October 2015
Abstract
A precursor mediated route is developed for the synthesis of a porous CuO nanostructure based on the hydrothermal method using copper chloride dihydrate and urea, followed by calcination at 400 °C for 4 h. The structural and morphological characteristics of the synthesized oxide are examined by X-ray diffraction, Fourier transform infrared spectroscopy, scanning electron microscopy, transmission electron microscopy, Raman spectroscopy, UV-visible spectroscopy and BET surface area analyses. The CuO nanostructure is utilized for the catalytic oxidative degradation of both cationic (methylene blue) and anionic (methyl orange) dye pollutants, respectively. It exhibits excellent catalytic performance with good reusability up to the fourth cycle of the degradation reaction. It also provides a new route for promising dye degradation in wastewater treatment.
1. Introduction
Industrial dye pollutants, which are a major class of organic compounds, lead to increasing environmental concerns.1,2 Due to their acute toxicity and long persistence they are major hazard to the environment.2,3 The dyes have complex aromatic molecular structures which make them stable and difficult to degrade. Nowadays, tremendous efforts have been rendered to the degradation of such dye molecules by various methods, such as biodegradation,4 adsorption,5–7 membrane process,8 photocatalysis,9–11 and in particular advanced oxidation processes (AOPs).12–15As an efficient method, AOPs are based on the creation of reactive species such as hydroxyl radicals (˙OH) that oxidize complex organic pollutants into low toxicity or nontoxic small molecules, even into CO2 and H2O quickly without any selectivity.16–18 It usually include ozone oxidation, supercritical water oxidation, wet air oxidation, Fenton oxidation reaction (homogeneous and heterogeneous), and photoelectrocatalytic oxidation. Among them ozone oxidation is a powerful strategy, but ozone have limited solubility and short lifetime, therefore it leads to high energy consumption.18 Nevertheless, the cost of the process of generating hydroxyl radicals photochemically is quite high. Moreover, supercritical water oxidation and wet air oxidation are restricted by high-pressure and temperature conditions in the catalytic oxidative degradation process. Homogeneous Fenton reaction is restricted by low utilization of H2O2, release of iron ions to the environment and difficulties in reutilization.18 To overcome these disadvantages, attention has been paid to research on heterogeneous Fenton reaction, which is highly efficient and generates no secondary pollution to the environment while saving energy.
The synthesis of transitional metal oxide nanostructures with controlled morphology and texture has attracted a great deal of interest in the field of nanotechnology.19–21 In particular, copper oxide (CuO), an important p-type transition metal oxide semiconductor with a narrow band gap (Eg = 1.2 eV) and an unconventional band structure has received much attention due to its various applications in different fields of solar energy cells,22,23 electronics,24,25 gas sensing,26,27 bio-sensing,28–30 heterogeneous organic catalysis,31–33 lithium-ion electrode materials,34,35 super conductors36 and so on. Therefore, the synthesis of nanostructured CuO has attracted considerable attention in recent years. Several methods that are employed for the synthesis of CuO nanoparticles include precipitation, hydrothermal synthesis, sol–gel, microemulsion, chemical vapour deposition, pyrolysis, self-assembly derived methods, combustion synthesis and microwave assisted synthesis. Solution-based methods, especially hydro- and solvothermal routes and liquid-phase precipitation that favour shape control, have been developed as the most powerful strategies.
Herein, a porous CuO nanostructure was synthesized by a precursor mediated hydrothermal route without employing any surfactant or structure directing agent. The as prepared CuO nanostructure was characterized by X-ray diffraction, Fourier transform infrared spectroscopy, scanning electron microscopy, transmission electron microscopy, Raman spectroscopy, UV-visible spectroscopy and BET surface area analyses and employed for the oxidative degradation of organic dye pollutants. It was demonstrated that the porous CuO nanostructure exhibited enhanced catalytic oxidation activity of model cationic and anionic dye molecules.
2. Experimental section
Materials
All chemicals were of analytical reagent grade and used as received without further purification. Copper chloride dihydrate (CuCl2·2H2O), urea (CO(NH2)2) and H2O2 (30 wt%) were purchased from Merck, India. Methyl orange (MO) and methylene blue (MB) were purchased from Rankem Chemicals, India, and distilled water was used throughout the whole experiment.Synthesis of CuO nanostructure catalysts
The porous CuO nanostructure was synthesized by a precursor route reported previously by our group.37 Typically, 6.8192 g of copper chloride dihydrate (CuCl2·2H2O) and 0.24024 g of urea (H2NCONH2) were dissolved in 40 mL of distilled water separately to form homogeneous solutions, respectively. The urea solution was then added dropwise to the CuCl2·2H2O solution with stirring. The mixture was then transferred to a 150 mL teflon-lined stainless steel autoclave, which was sealed, and heated at 120 °C for 6 h. The as-formed precipitate, (Cu2Cl(OH)3) precursor, was separated by centrifugation, washed with distilled water and ethanol five times, and dried at 80 °C for 12 h in an oven. The porous CuO nanostructure was obtained by further calcining the precursor in air atmosphere at 400 °C for 4 h.Catalyst characterization
The powder X-ray diffraction (XRD) patterns were recorded on a Rigaku instrument using a nickel-filtered CuKα (0.15418 nm) radiation source and a scintillation counter detector. The intensity data were collected over a 2θ range of 10–70°. To study the surface topography, scanning electron microscopy (SEM) analyses were carried out using a “JEOL, JSM Model 6390 LV” scanning electron microscope, operating at an accelerating voltage of 15 kV. Energy dispersive X-ray analyses (EDX) were also measured in the same instrument attached with a scanning electron microscope. Transmission electron microscopic (TEM) investigations were carried out on a JEM-2010 (JEOL) instrument equipped with a slow-scan CCD camera and at an accelerating voltage of 200 kV. Infra-red spectra were recorded using an FTIR spectrophotometer, Model Nicolet Impact I-410. Measurements are performed by pelletizing the samples with KBr in the mid-infrared region. The electronic absorption spectra (in diffuse reflectance mode) are measured using a UV-visible spectrophotometer, Shimadzu Corporation (UV-2450). The Raman spectra of the sample were recorded using a laser micro Raman system (make: Horiba JobinVyon, model: LabRam HR) at room temperature having an excitation wavelength of 488 nm. The surface areas were determined by the Brunauer–Emmett–Teller (BET) method measured by N2 physisorption using a Quantachrome Instruments (Model: NOVA 1000e). The pore size and pore volume were determined following the Barrett–Joyner–Halenda (BJH) method in the same instrument (Quantachrome Instruments). The UV-visible spectra were recorded on a UV-visible spectrophotometer, Shimadzu Corporation (UV-2550).Catalytic experiments
Two different organic dye pollutants were chosen to investigate the catalytic activity of the porous CuO nanostructure, which were methyl orange (MO) and methylene blue (MB), respectively. In a typical catalytic experiment, 1 mL of H2O2 (30 wt%) was added to 10 mL aqueous solution of dye (5 mg L−1). Immediately to this mixture a desired amount of catalyst was added and as the reaction proceeds the colour of the solution was found to be faded. The solution mixture was stirred during the reaction and the upper solution was transferred to a quartz cuvette for UV-visible spectra measurement. Once a spectrum was recorded, the solution was immediately transferred back to the previous beaker and stirred for another few seconds for the sequential catalytic reaction. UV-visible spectra were recorded at short intervals to monitor the progress of the reaction. Blank experiments were also carried out to show that the reactions do not proceed with catalysts in the absence of H2O2 and also without catalysts in the presence of H2O2. The influence of the catalyst amount, the effect of reaction temperature and the recyclability of the representative sample was studied. To test the recyclability of the catalyst, four successive cycles of catalytic reaction were carried out employing a definite amount of catalyst. In the successive cycles, the catalyst was collected by centrifugation from the previous solution and washed 3 times with distilled water. Furthermore, the collected catalyst was applied against the fresh dye solution of similar amount also in addition to H2O2 as described previously.3. Results and discussion
Structure and morphologies of the porous CuO nanostructure
The as obtained porous CuO nanostructure was prepared via a simple precursor route.37 At first, the precursor (Cu2Cl(OH)3) with 3-dimensional flower-like structures was prepared.37 The calcination of the known precursor produces a CuO nanostructure with openly porous feature. The as obtained CuO product was first characterized by using XRD, which is shown in Fig. 1a. The XRD pattern agrees well with the standard JCPDS Card No. 89-2530, suggesting the formation of the pure monoclinic phase of the CuO nanostructure (Fig. 1a). The sharp peak indicates its highly crystalline nature and no other impurities were detected. The FTIR spectra of the CuO nanostructure was also recorded (Fig. 1b). The FTIR spectrum of the CuO nanostructure indicates two peaks at 479.8 and 585.6 cm−1 which are due to the vibrational modes of the Cu–O bond.38 For the present case these two signature peaks well corroborate the formation of the CuO.38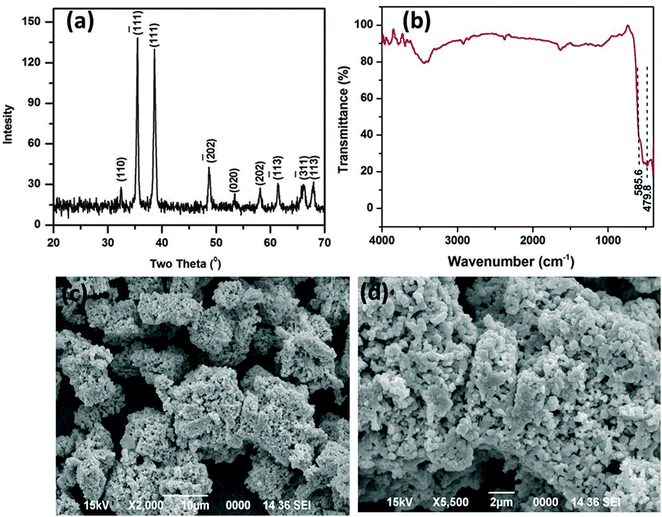 | ||
| Fig. 1 XRD pattern (a), FTIR spectrum (b), and SEM images (c and d) of the as synthesized CuO nanostructure. | ||
The surface topology and morphology of the CuO were studied by SEM and TEM imaging. The SEM images show the openly porous feature of the CuO nanostructure (Fig. 1c and d). The morphology of the CuO was also evaluated by TEM and HRTEM imaging, which are presented in Fig. 2. The TEM and HRTEM images of the as obtained CuO nanostructure show that the oxide compound crystallizes as a porous flake like structure by aggregating various tiny particles which are few nanometers in range (Fig. 2a). In the figures, the clearly visible lattice fringes are indicative of the high crystallinity of the porous nanostructure.
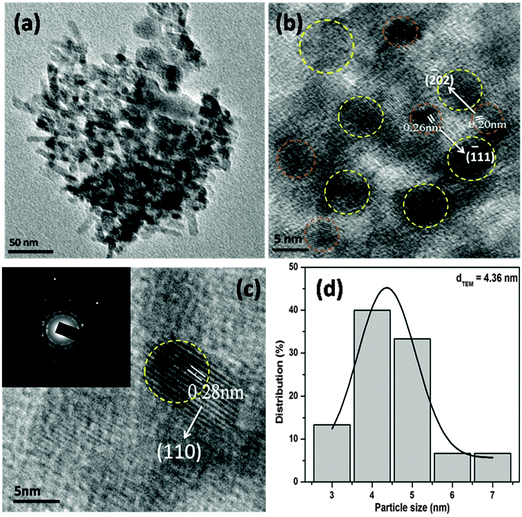 | ||
| Fig. 2 TEM (a) and HRTEM (b and c) images and the particle size distribution (d) of the CuO nanostructure. Inset in (c) is the SAED pattern of the CuO nanostructure. | ||
The interplanar distances of 0.20 nm and 0.26 nm can be indexed to be (−202) and (−111) planes of monoclinic CuO, while the interplanar distance of 0.28 nm can be ascribed to the (110) plane (Fig. 2b and c). The corresponding selected area electron diffraction pattern of the CuO nanostructure is shown in the inset of Fig. 2c. The figure shows that the particles are highly crystalline in nature and possess four well-resolved rings, which could be attributed as (110), (−111), (111) and (−202) reflections, respectively, of the CuO nanostructure. The size distribution of CuO nanoparticles (Fig. 2d) showed that more than 80% of the particles fall in the size range of 3–5 nm and the mean particle diameter was about 4.36 nm.
Energy dispersive X-ray (EDX) analysis of the CuO suggested the presence of Cu and O signals devoid of any other metal and impurities (Fig. 3). Furthermore, the CuO was assessed by energy dispersive spectroscopy (EDS) mapping, which also confirms the presence of above elements in the oxide sample. The corresponding elemental mappings for Cu, O and Cu + O are presented in Fig. 3. From the maps, it can be seen that both the elements (Cu and O) are uniformly distributed over the nanostructure confirming the homogeneity of the sample.
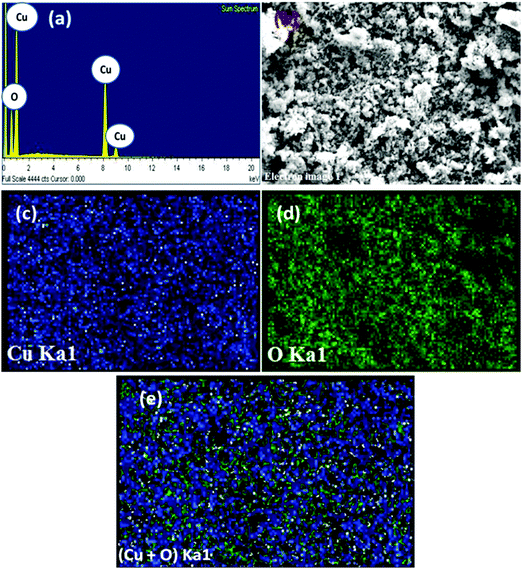 | ||
| Fig. 3 EDX pattern (a) and electron image (b) and EDS maps of Cu (c), O (d) and (Cu + O) (e) of the CuO nanostructure. | ||
The optical properties of the CuO nanostructure were assessed by Raman and UV-visible diffuse reflectance spectroscopy, respectively. Fig. 4a shows the Raman spectrum of the as synthesized CuO nanostructure. It can be seen from Fig. 4a that there are three Raman peaks at 288, 333 and 615 cm−1. Table 1 lists the experimental results regarding the position and full-width at half maximum (FWHM) of the Raman peaks for the CuO nanostructure.
 | ||
| Fig. 4 Micro-Raman (a) and UV-visible diffuse reflectance spectrum (b) of the CuO nanostructure and the plot of (αEp)2vs. Ep (c) obtained by extrapolating the value of Ep at α = 0. | ||
| Ag (cm−1) | B1g (cm−1) | B2g (cm−1) | |||
|---|---|---|---|---|---|
| Position | FWHM | Position | FWHM | Position | FWHM |
| 288 | 32 | 333 | 35 | 615 | 45 |
The as-synthesized CuO nanostructure belongs to the C2h6 space group with two molecules per primitive cell. A total of nine zone-center optical phonon modes with symmetries 4Au + 5Bu + Ag + 2Bg are present, but only three Ag + 2Bg modes are Raman active. By comparing with the vibrational spectra of CuO powder39,40 and single crystals41 we could assign the peak at 288 cm−1 to the Ag and the peaks at 333 and 615 cm−1 to the Bg modes. It can be observed that these wavenumbers are close to those reported in the literature (288, 330 and 621 cm−1).42
To determine more about agglomeration behavior of the nanostructure we studied the optical absorption spectra. The measured UV-visible diffuse reflectance spectrum is plotted in Fig. 4b. As the particle size of the CuO lies in the nanometric regime, we expected that an absorption edge to lie in the UV region of the spectrum. Thus the absorption edge or the peak lies in the UV region of the spectrum indicating the widening of the optical band gap due to quantum confinement. It can be seen from the spectrum that the CuO shows two absorption bands at 256.4 and 639.2 nm, the first one of which is typically depicted in the UV region of the spectrum (λ = 200–400 nm). The optical energy band gap is usually calculated by adopting a classical Tauc approach. The optical absorption coefficient near the band edge obeys the following theoretical equation:
| αEp = K(Ep − Eg)1/2 |
Fig. 4c depicts the plot of (αEp)2vs. Ep, which is based on the direct transition and the extrapolated value of Ep at α = 0 providing the absorption edge energy corresponding to the band-gap of the synthesized CuO nanostructure (Eg) = 2.52 eV. Eg corresponding to 2.52 eV is relatively higher than that of bulk CuO (1.2–1.3 eV), and supports a quantum confinement effect relating to tiny nanoparticles.
In order to examine the porous behavior and estimation of the surface area and pore characteristic of the as-prepared CuO nanostructure, N2 adsorption/desorption experiments were performed at liquid N2 temperature. The corresponding adsorption/desorption isotherm and pore size distribution curve (inset) are shown in Fig. 5. The N2 adsorption/desorption isotherm of the as-synthesized CuO nanostructure belongs to type IV with a combination of H1 and H3 hysteresis loop, which is a characteristic of mesoporous materials. Mesoporosity of the sample is also demarcated as the upper closer point of the hysteresis loop appearing at a relatively higher value (P/P0 = 0.90). Also the BET investigation of the CuO nanostructure provides a surface area of about 9.027 m2 g−1, which is quite larger than that of usually used commercial CuO powder (ca. 0.1 m2 g−1)43 with a pore volume of 0.007 cm3 g−1 and an average BJH pore diameter of 32.73 Å. The pore size distribution curve was derived from the BJH method indicating the presence of mesoporosity in the sample. It is observed from the curve that the maxima of pore size distribution was observed at around 60–90 Å, which again indicates the mesoporosity of the sample.
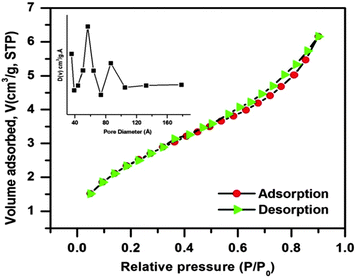 | ||
| Fig. 5 N2 adsorption/desorption isotherm of the CuO nanostructure; the inset shows the pore size distribution curve of the sample. | ||
Catalytic oxidative degradation activities of the CuO nanostructure
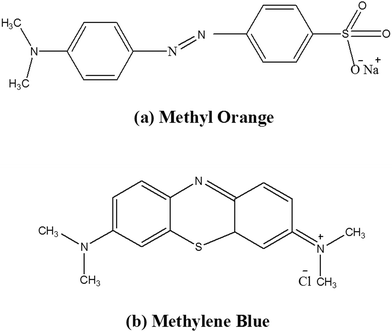
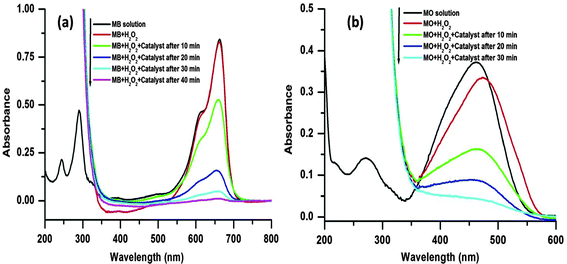
Two common organic dyes in industrial wastewater, MB (cationic) and MO (anionic), were chosen as model dyes to investigate the catalytic performance of the porous CuO nanostructure. Typically, both the dyes are two classes of complex organic pollutants (molecular structures are shown in Fig. 6), which are very difficult to degrade in wastewater. Various experimental techniques are employed for the degradation of such organic complex dyes, such as physical adsorption, biodegradation, and photocatalysis. Among them heterogeneous Fenton oxidation which saves energy and produces no secondary pollution is a highly efficient technique. In the current system, the hydroxyl radicals (˙OH) generated are recognized as a highly reactive and powerful oxidant that can destroy complex organic pollutants to CO2 and inorganic ions because of its high standard reduction potentials of 2.8 V in acidic solution and 1.8 V in neutral solution, respectively.44The oxidative degradation of the dyes was investigated under the neutral condition using H2O2 as an oxidant and the CuO as a catalyst at various reaction temperatures. The UV-visible absorption spectra of the MB/MO solution and mixed solutions with H2O2 (viz., MB, MB + H2O2, MO, MO + H2O2) are shown in Fig. 7. The spectrum of the initial solution of MB (no H2O2) shows four absorption peaks located at 246, 292, 614, and 664 nm, which originates from the strong molecular absorption of MB (Fig. 7a). The MB bands at 292 and 246 nm were covered by the strong absorption of hydrogen peroxide in the range of 185–300 nm after the addition of H2O2 with the MB solution (Fig. 7a). Similarly, the spectrum of the initial solution of MO (no H2O2) shows two absorption peaks which are located at 246 and 462 nm (Fig. 7b). Again, after the addition of H2O2 to the MO solution the band at 246 nm was covered by the strong absorption of hydrogen peroxide in the range of 185–300 nm (Fig. 7b).
A series of experiments were performed to explore the catalytic activity of the nanostructured CuO for the model dye molecules. In the catalytic experiment, 1 mL of H2O2 (30 wt%) and 3 mg of the catalyst are mixed with 10 mL aqueous solution of dye (5 mg L−1) with vigorous stirring. As the degradation reaction preceded, the main characteristic absorption peaks at 664 and 462 nm for the MB and MO, respectively, gradually weaken, which are monitored by UV-visible absorption spectroscopy measurements (Fig. 7).
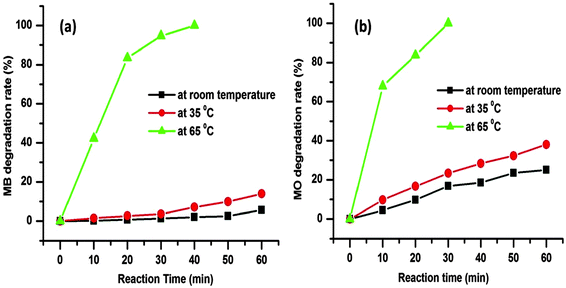
The degradation rates for the MB and MO dye molecules are 5.72% and 25.12%, respectively, up to 1 h at room temperature (25 °C) as presented in Fig. 8. As the temperature was increased from room temperature to 35 °C the degradation rate was also increased to 13.91% and 38.11% for the respective dye molecules within 1 h (Fig. 8). The corresponding time dependent UV-visible absorption spectra are presented in the ESI† (Fig. S1 and S2). The above data prove that with the increase in reaction temperature, the degradation rate of dye molecules increases.
We further increased the reaction temperature to 65 °C at which the degradation was found to be almost complete within short time for both the MB and MO molecules, respectively (see Fig. 7 and 8). Meanwhile, the absorption peaks at 664 and 462 nm corresponding to the MB and MO molecules gradually decrease and completely disappear after 40 and 30 min as shown in Fig. 7. The color of the solutions also turns colorless from its original blue for MB and orange for MO, respectively. The degradation rate of the dye molecules were calculated by eqn (1)
 | (1) |
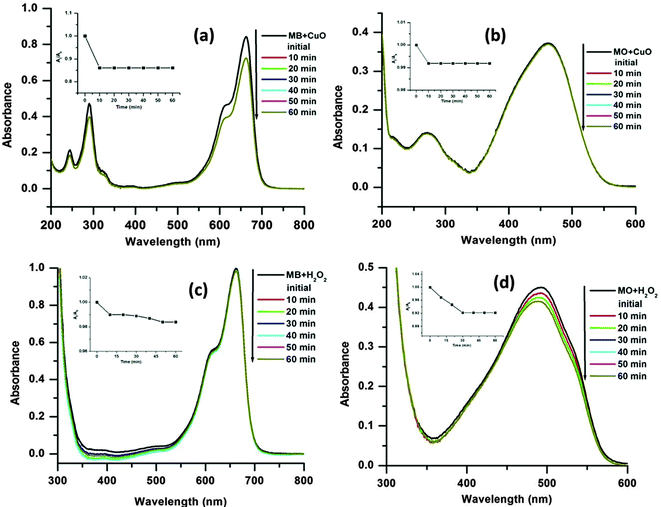
From the experiments, it is also observed that the MB is degraded in slower rate than the MO. This may be due to the more complex chemical structure of the MB than MO, which increases the steric hindrance and complexity of the reaction with hydroxyl radicals (˙OH).17 It is notable that in the absence of H2O2 (only dye + CuO) or catalyst (only dye + H2O2) no obvious dye degradation was observed even after 1 h at 65 °C temperature as presented in Fig. 9. As mentioned earlier dye degradation was completed within 40 min for MB and 30 min for MO in the presence of CuO and H2O2 at 65 °C. This may be due to the synergistic effect between CuO and H2O2 molecules which facilitates decomposition of H2O2 to ˙OH radicals in the presence of CuO.45
To investigate the influence of catalyst dosage on dye degradation 1, 3 and 6 mg of catalyst were employed in the catalytic systems at 65 °C. Fig. 10 shows that both the dye degradations were completed more quickly as the catalyst dosage was increased. With the increasing catalyst dosage the surface area and the catalytically active site increases. As a result the reactions proceed faster i.e. the dyes degraded more rapidly as the catalyst amount is increased.
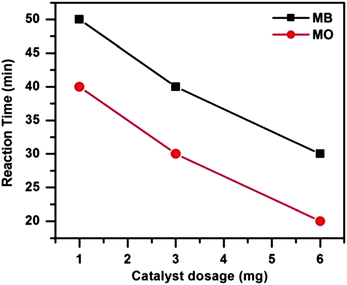 | ||
| Fig. 10 Effect of catalyst dosages on MB and MO degradation. Conditions: [dye] = 5 mg L−1, volume of dye solution = 10 mL, H2O2 = 1 mL and reaction temperature = 65 °C. | ||
As the catalyst shows excellent activity for the dye degradations the reusability and stability of the catalyst was evaluated at 65 °C with 6 mg of catalyst dose. To evaluate the reusability of a catalyst, recycling reactions were carried out for the dye molecules up to the fourth cycle. In each test, the catalyst was separated from the solution by centrifugation, washed three times with ethanol and dried at 80 °C in an oven.
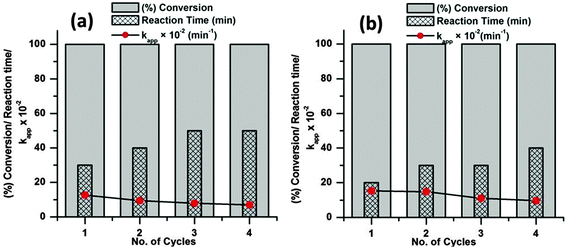
From Fig. 11 it is observed that both the dye molecules were completely degraded within 1 h of reaction up to the fourth cycle. However, the time required for complete degradation of dye increases with increasing catalytic cycle and consequently there is meager decrease in the apparent rate constant (kapp). This minute decrease in activity may be due to small loss of catalyst during the separation process. The corresponding UV-visible absorption spectra of all the recycle experiments are presented in the ESI† (Fig. S4–S11). SEM analyses were carried out before and after the fourth run of the recycle reaction to investigate the structural stability of the catalyst and the images are presented in Fig. 12. From the figure it is observed that the surface structures of the catalyst remain unchanged after the fourth run of the reaction, which confirms the high stability of the catalyst.
 | ||
| Fig. 12 SEM images of the CuO nanostructure before (a) and after four catalytic runs of oxidative degradation reaction with MB (b) and MO (c), respectively. | ||
For better comparison of the present work with some of the earlier reports, different catalysts employed for the catalytic degradation of MB and MO are highlighted in Table 2. It is evident from Table 2 that the CuO nanostructure shows better activity in comparison to the several catalysts reported previously.3,17,45–49 The present investigation indicates that the porous CuO nanostructure exhibits excellent catalytic activity for cationic and anionic dye degradation with high stability and good reusability.
| Entry | Catalyst | Reaction temperature (°C) | H2O2 (mL) | MB degradation rate (%) | MO degradation rate (%) | Time (min) | Ref. |
|---|---|---|---|---|---|---|---|
| 1 | CuO-nanostructure | 65 | 1 | 100 | 100 | 40, 30 | Present work |
| 2 | MnO2-superstructure | 30 | 10 | 61.3 | — | 120 | 3 |
| 3 | Solid Fe3O4 | Ultrasonic treatment (40 kHz) | 1 | 100 | 100 | 130, 50 | 17 |
| 4 | Mn3O4-nanocrystal | 80 | 15 | 100 | — | 180 | 45 |
| 5 | Fe-species loaded MnO2-superstructure | 25 | 20 | 94.8 | — | 120 | 46 |
| 6 | Porous Co3O4 nanorods-Reduced Graphene Oxide | 80 | 10 | 97 | — | 25 | 47 |
| 7 | Fe/DWCNTs–MMO | 25 | 5 | 96 | 93 | 360 | 48 |
| 8 | CuO/CeO2 Catalyst | MW (2450 MHz, 380 W) | 0.6 | — | 100 | 7 | 49 |
4. Conclusions
In summary, we have synthesized a porous CuO nanostructure by a precursor mediated simple hydrothermal route without using any structure directing agent. The as synthesized CuO was characterized using XRD, FTIR, micro-Raman spectroscopy, SEM, TEM/HRTEM, BET surface area analyses and UV-visible diffuse reflectance spectroscopy. The average size of the nanostructured CuO was found to be 4.36 nm. The porous CuO was employed for oxidative degradation of different dye molecules in the presence of H2O2. The as synthesized CuO nanostructure exhibits high catalytic activity for the degradation of methylene blue and methyl orange dye at 65 °C. The CuO nanostructure shows high stability and good reusability up to the fourth cycle of catalytic degradation reaction. The present study provides development of a very effective CuO nanocatalyst for promoting toxic dye degradation in wastewater treatment.Acknowledgements
The authors thank Tezpur University, Council of Scientific and Industrial Research (CSIR No: 01(2813)/14/EMR-II), New Delhi, and Science and Engineering Research Board (SERB-DST No: SB/FT/CS-048/2014), New Delhi, for financial support. SAIC, Tezpur University, SAIF, North-Eastern Hill University, Shillong, and CIF, IIT Guwahati are acknowledged for instrumental facilities.References
- T. Jiang, A. S. Poyraz, A. Iyer, Y. Zhang, Z. Luo, W. Zhong, R. Miao, A. M. El-Sawy, C. J. Guild, Y. Sun, D. A. Kriz and S. L. Suib, J. Phys. Chem. C, 2015, 119, 10454–10468 CAS
.
- L. Zhou, Y. Shao, J. Liu, Z. Ye, H. Zhang, J. Ma, Y. Jia, W. Gao and Y. Li, ACS Appl. Mater. Interfaces, 2014, 6, 7275–7285 CAS
.
- Y. Liu, Z. Chen, C.-H. Shek, C. M. L. Wu and J. K. L. Lai, ACS Appl. Mater. Interfaces, 2014, 6, 9776–9784 CAS
.
- S. Sekar, M. Surianarayanan, V. Ranganathan, D. R. MacFarlane and A. B. Mandal, Environ. Sci. Technol., 2012, 46, 4902–4908 CrossRef CAS PubMed
.
- L. Zhou, B. He and J. Huang, ACS Appl. Mater. Interfaces, 2013, 5, 8678–8685 CAS
.
- X. Zhuang, Y. Wan, C. M. Feng, Y. Shen and D. Y. Zhao, Chem. Mater., 2009, 21, 706–716 CrossRef CAS
.
- H. Chen, A. Zhong, J. Wu, J. Zhao and H. Yan, Ind. Eng. Chem. Res., 2012, 51, 14026–14036 CrossRef CAS
.
- G. Laera, D. Cassano, A. Lopez, A. Pinto, A. Pollice, G. Ricco and G. Mascolo, Environ. Sci. Technol., 2012, 46, 1010–1018 CrossRef CAS PubMed
.
- S. Danwittayakul, M. Jaisai, T. Koottatep and J. Dutta, Ind. Eng. Chem. Res., 2013, 52, 13629–13636 CrossRef CAS
.
- C. Mondal, M. Ganguly, A. K. Sinha, J. Pal, R. Sahoo and T. Pal, CrystEngComm, 2013, 15, 6745–6751 RSC
.
- X. Shanga, B. Lia, T. Zhanga, C. Lib and X. Wang, Procedia Environ. Sci., 2013, 18, 478–485 CrossRef
.
- D. N. Priya, J. M. Modak and A. M. Raichur, ACS Appl. Mater. Interfaces, 2009, 1, 2684–2693 CAS
.
- I. Oller, S. Malato and J. A. Sanchez-Perez, Sci. Total Environ., 2011, 409, 4141–4166 CrossRef CAS PubMed
.
- Y. Lei, C.-S. Chen, Y.-J. Tu and Y.-H. Huang, and H. Zhang, Environ. Sci. Technol., 2015, 49, 6838–6845 CrossRef CAS PubMed
.
- R. Huang, Y. Liu, Z. Chen, D. Pan, Z. Li, M. Wu, C.-H. Shek, C. M. L. Wu and J. K. L. Lai, ACS Appl. Mater. Interfaces, 2015, 7, 3949–3959 CAS
.
- S. H. S. Chan, T. Y. Wu, J. C. Juan and C. Y. J. Teh, J. Chem. Technol. Biotechnol., 2011, 86, 1130–1158 CrossRef CAS
.
- X. Zhang, M. Lin, X. Lin, C. Zhang, H. Wei, H. Zhang and B. Yang, ACS Appl. Mater. Interfaces, 2014, 6, 450–458 CAS
.
- Z. Yang, Y. Yang, X. Zhu, G. Chen and W. Zhang, Ind. Eng. Chem. Res., 2014, 53, 9608–9615 CrossRef CAS
.
- H. Xu, G. Zhu, D. Zheng, C. Xi, X. Xu and X. Shen, J. Colloid Interface Sci., 2012, 383, 75–81 CrossRef CAS PubMed
.
- A. Li, H. Song, W. Wan, J. Zhou and X. Chen, Electrochim. Acta, 2014, 132, 42–48 CrossRef CAS
.
- Y. Wang, Y. Lei, J. Li, L. Gu, H. Yuan and D. Xiao, ACS Appl. Mater. Interfaces, 2014, 6, 6739–6747 CAS
.
- E. Alonso, C. Pérez-Rábago, J. Licurgo, E. Fuente and C. A. Estrada, Sol. Energy, 2015, 115, 297–305 CrossRef CAS
.
- M. I. Hossain, F. H. Alharbi and N. Tabet, Sol. Energy, 2015, 120, 370–380 CrossRef CAS
.
- S.-T. Bee, L. T. Sin, C. T. Ratnam, K. J. S. Haraveena, T.-T. Tee and A. R. Rahmat, Nucl. Instrum. Methods Phys. Res., Sect. B, 2015, 360, 36–45 CrossRef CAS
.
- E. Parka, H. W. Park and J. Lee, Colloids Surf., A, 2015, 482, 710–717 CrossRef
.
- M. Yanga, J. Hea, M. Hua, X. Huc, C. Yanc and Z. Chengc, Sens. Actuators, B, 2015, 213, 59–64 CrossRef
.
- K. Akhtar, I. U. Haq and K. Malook, Powder Technol., 2015, 283, 505–511 CrossRef
.
- P. M. Niaa, W. P. Menga, F. Lorestani, M. R. Mahmoudian and Y. Alias, Sens. Actuators, B, 2015, 209, 100–108 CrossRef
.
- P. Gao and D. Liu, Sens. Actuators, B, 2015, 208, 346–354 CrossRef CAS
.
- T. Alizadeh and S. Mirzagholipur, Sens. Actuators, B, 2014, 198, 438–447 CrossRef CAS
.
- C. Jeong, M. J. Hyun and Y.-W. Suh, Catal. Commun., 2015, 70, 34–39 CrossRef CAS
.
- S. Induja and P. S. Raghavan, Catal. Commun., 2013, 33, 7–10 CrossRef CAS
.
- S. J. Ahmadi, S. Sadjadi, M. Hosseinpour, M. Outokesh and R. Hekmatshoar, Catal. Commun., 2009, 10, 1423–1426 CrossRef CAS
.
- A. Li, H. Song, W. Wan, J. Zhou and X. Chen, Electrochim. Acta, 2014, 132, 42–48 CrossRef CAS
.
- Y. Liu, W. Wang, Y. Wang and X. Peng, Electrochim. Acta, 2014, 148, 73–78 CrossRef CAS
.
- J. H. Schön, M. Dorget, F. C. Beuran, X. Z. Zu, E. Arushanov, C. D. Cavellin and M. Lagues, Nature, 2001, 414, 434–436 CrossRef PubMed
.
- P. Deka, R. C. Deka and P. Bharali, New J. Chem., 2014, 38, 1789–1793 RSC
.
- G. Kliche and Z. V. Popovic, Phys. Rev. B: Condens. Matter Mater. Phys., 1990, 42, 10060–10066 CrossRef CAS
.
- W. Reichard, F. Gomp, M. Aïn and B. M. Wanklyn, Zeitschrift für Physik B, 1990, 81, 19–24 CrossRef
.
- J. Chrzanowske and J. C. Irwin, Solid State Commun., 1989, 70, 11–14 CrossRef
.
- H. F. Goldstein, D. Kim, P. Y. Yu, L. C. Bourne, J.-P. Chaminade and L. Nganga, Phys. Rev. B: Condens. Matter Mater. Phys., 1990, 41, 7192–7194 CrossRef CAS
.
- J. F. Xu, W. Ji and Z. X. Shen, J. Raman Spectrosc., 1999, 30, 413–415 CrossRef CAS
.
- Y. Liu, G. Zhu, C. Bao, A. Yuan and X. Shen, Chin. J. Chem., 2014, 32, 151–156 CrossRef CAS
.
- G. V. Buxton, C. L. Greenstock, W. P. Helmanv and A. B. Ross, J. Phys. Chem. Ref. Data, 1988, 17, 513–886 CrossRef CAS
.
- P. Zhang, Y. Zhan, B. Cai, C. Hao, J. Wang, C. Liu, Z. Meng, Z. Yin and Q. Chen, Nano Res., 2010, 3, 235–243 CrossRef CAS
.
- R. Huang, Y. Liu, Z. Chen, D. Pan, Z. Li, M. Wu, C.-H. Shek, C. M. L. Wu and J. K. L. Lai, ACS Appl. Mater. Interfaces, 2015, 7, 3949–3959 CAS
.
- Z. Zhang, J. Hao, W. Yang, B. Lu, X. Ke, B. Zhang and J. Tang, ACS Appl. Mater. Interfaces, 2013, 5, 3809–3815 CAS
.
- W. Li, T. Sun and F. Li, Ind. Eng. Chem. Res., 2014, 53, 18095–18103 CrossRef CAS
.
- D. Xu, F. Cheng, Q. Lu and P. Dai, Ind. Eng. Chem. Res., 2014, 53, 2625–2632 CrossRef CAS
.
Footnote |
| † Electronic supplementary information (ESI) available: A UV-visible absorption spectra of reaction solutions under different reaction temperatures and in the presence of different amounts of catalysts; and a recyclability test over the CuO catalyst. See DOI: 10.1039/c5nj02515j |
| This journal is © The Royal Society of Chemistry and the Centre National de la Recherche Scientifique 2016 |

