D-Penicillamine and bovine serum albumin co-stabilized copper nanoclusters with remarkably enhanced fluorescence intensity and photostability for ultrasensitive detection of Ag+†
Li
Ruiyi
a,
Wang
Huiying
a,
Zhou
Xiaoyan
a,
Liao
Xiaoqing
a,
Sun
Xiulan
b and
Li
Zaijun
*ac
aSchool of Chemical and Material Engineering, Jiangnan University, Wuxi 214122, China. E-mail: zaijunli@263.net; zaijunli@jiangnan.edu.cn; Fax: +86 051085811863; Tel: +86 13912371144
bSchool of Food Science and Technology, Jiangnan University, Wuxi 214122, China
cKey Laboratory of Food Colloids and Biotechnology, Ministry of Education, Wuxi 214122, China
First published on 16th November 2015
Abstract
Copper nanoclusters (CuNCs) have become promising nanomaterials due to their excellent electronic conductivity and biocompatibility. In this study, we reported a facile synthesis of D-penicillamine and bovine serum albumin co-stabilized copper nanoclusters (BSA/DPA–CuNCs) and the use as optical probe for the detection of Ag+. Herein, Cu2+ was reduced into Cu0 by D-penicillamine, further leading to form DPA–CuNCs. Then, BSA was introduced into DPA–CuNCs to obtain BSA/DPA–CuNCs by their electrostatic attraction. The as-prepared BSA/DPA–CuNCs exhibit remarkably enhanced fluorescence intensity and photostability. The peak fluorescence intensity is more than 2-fold that of DPA–CuNCs. Due to the synergistic effect between DPA and BSA, the nanosensor based on BSA/DPA–CuNCs gives ultrasensitive fluorescence response towards Ag+. Its peak fluorescence intensity linearly decreases with the increase of Ag+ concentration in the range of 1.0 × 10⁻⁸ to 1.0 × 10⁻¹⁶ M with the detection limit of 4.3 × 10⁻¹⁷ M (S/N = 3). The method provides the advantage of sensitivity, repeatability and stability. It has been successfully applied in the detection of Ag+ in water samples. The study also opens a new avenue for the fabrication of functional metal nanoclusters that hold great promise in potential applications such as nanosensors, biocatalysts and molecular carriers.
1 Introduction
Metal nanoclusters (NCs) have attracted a great deal of research interest due to their unique physical, electrical and optical properties.1 Emerging as a new class of fluorescent nanomaterials, the fantastic characteristic of metal NCs has attracted extensive attention, including satisfactory water-solubility, biocompatibility, high quantum yield, good stability and outstanding catalytic properties.2 At present, metal NCs are considered as novel candidates for biosensing,3 drug controlled release4 and catalysis.5 Great effort is paid to the synthesis and application of metal NCs in recent years.6 On account of excellent electronic conductivity and biocompatibility, the development of water-soluble CuNCs produces an extensive importance, especially utilized as essential components in future nanodevices.7 However, the synthesis of CuNCs is more difficult compared with other noble metal NCs because CuNCs are fairly unstable in the aqueous solution. When it is exposed to air, the surface oxidation will shortly occur. To date, it is still a challenging task to prepare stable CuNCs with bright luminescence, controllable size and shape.8The stabilizer plays key roles in the synthesis of metal NCs. It not only determines the water-solubility of metal NCs and stability in air and water to a certain extent, but also seriously affects the optical properties, including the fluorescence intensity and photo-stability. Mostly, the stabilizer is also used as the reducing agent and a molecular template, thus leading to different reaction rates and particle size and morphology of the final product.9 Thus, choosing an appropriate stabilizer is the most important work for the specific synthesis. At present, two kinds of stabilizers are widely used for the synthesis of metal NCs. One kind of stabilizer is the biomacromolecule such as bovine serum albumin (BSA),10 transferrin,11 lysozyme,12 peptides13 and DNA.14 The biomacromolecule often contains rich hydrophilic groups and is easy to form an inert shell on the surface of metal cores during the synthesis, which can effectively block the direct contact between the metal core and the oxygen in air. The characteristics make the biomacromolecule-stabilized metal NCs manifest with excellent stability and water-solubility.15 However, biomacromolecule-stabilized metal NCs often lack rich functional groups. This greatly limits their applications in the requirement of specific groups for the specific interaction or chemical reaction. Another kind of stabilizer is the small molecule functional reagent such as amino acid.16 Due to the existence of peculiar functional groups, small molecule-stabilized metal NCs can offer special interaction or chemical reaction in their application, which further expands their application fields. However, the small molecule functional reagent is difficult to form a perfect protective layer on the surface of metal cores, leading to partial exposure of metal cores to air. Small molecule-stabilized metal NCs exhibit a relatively poor stability and water-solubility. By using their respective advantages, it is possible to create more ideal metal NCs via a perfect combination of the above two kinds of stabilizers. As far as we know, no report has referred to such an ideal metal NC.
This study focuses on the synthesis of D-penicillamine and bovine serum albumin co-stabilized copper nanoclusters (BSA/DPA–CuNCs). The as-prepared CuNCs exhibit a higher fluorescence intensity and photostability compared with DPA–CuNCs. The nanosensor based on BSA/DPA–CuNCs gives ultrasensitive fluorescence response towards Ag+ owing to the synergistic effect between DPA and BSA. The analytical method provides the advantage of sensitivity, repeatability and stability.
2 Experimental
2.1 Materials
D-Penicillamine (DPA), bovine serum albumin (BSA), copper nitrate (Cu(NO3)2) and sodium hydroxide (NaOH) were purchased from Sigma-Aldrich (Mainland, China). Britton–Robinson buffer solution (BR buffer, H3PO4–HAc–H3BO3, 0.04 M) was prepared and its pH value was adjusted using a 0.2 M NaOH solution in the laboratory. Other reagents were of analytical regent grade and were purchased from Shanghai Chemical Company (Shanghai, China). Ultrapure water (18.2 MΩ cm) purified from the Milli-Q purification system was used throughout the experiment.2.2 Apparatus
A transmission electron microscope (TEM) image was captured on a JEOL 2010 FEG microscope at 200 keV. The sample was prepared by dispensing a small amount of dry powder in the PBS. Then, one drop of the suspension was dropped on 300 mesh copper TEM grids covered with thin amorphous carbon films. The infrared spectrum (IR) was recorded on a Nicolet FT-IR 6700 spectrometer. X-ray photoelectron spectroscopy (XPS) measurements were performed by using a PHI 5700 ESCA spectrometer with monochromated Al KR radiation (hν = 1486.6 eV). The pH was measured on the PHS-3D pH meter (Shanghai Precision Scientific Instruments Co., Ltd., China). The fluorescence spectrum and intensity were recorded on a Cary Eclipse fluorescence spectrophotometer (Agilent, Japan). Circular dichroism (CD) measurements were performed on a MOS-450 circular dichroism spectrometer using a 0.01 cm quartz cell. The zeta potential measurement was carried out in a ZETASIZER2000 Zeta Potential Analyzer. The absorbance and absorption spectrum were recorded on a TU-1901 spectrophotometer.2.3 Synthesis of CuNCs
In a typical synthesis, 24 mg of DPA was dissolved in 16 ml of ultrapure water, 1.0 ml of 4 mg ml−1 Cu(NO3)2 was added dropwise into the above solution under vigorous agitation. After stirring for 90 min, the solution was filtered using a 0.22 nm filter membrane to remove the larger product and by-products. Further, fluorescent DPA–CuNCs were collected by dialysis against deionized water through a dialysis membrane for 24 h. After that, 0.3 ml of 1 mg ml−1 BSA solution was added into DPA–CuNCs under agitation. The solution was continuously stirred for 10 min and followed by centrifugation at 4000 r min−1 for 10 min to remove the larger product. The collected DPA–CuNCs were stored in a refrigerator at 4 °C for until use.2.4 Quantum yield measurement
The quantum yield measurement was carried out by dissolving quinine sulphate into 0.1 M H2SO4 (used as reference). The CuNC dispersion was used as such. The absorbance of the respective sample was measured in the spectrophotometer. Quantum yield was calculated from following eqn (1):17 | (1) |
2.5 Synchronous fluorescence spectroscopy
For this measurement, the difference between the excitation and emission wavelength (Δλ) was set at 15 nm (for tyrosine residues), or at 60 nm (for tryptophan residues). Excitation and emission slit width were set at 2.5 nm.2.6 Resonance light scattering (RLS) measurement
In the case of RLS analysis, excitation and emission wavelengths were scanned simultaneously in the wavelength range of 200–800 nm with Δλ = 0.2.7 The procedure for fluorescence detection of silver ions
The BSA/DPA–CuNC solution (0.6 ml) was mixed with the BR buffer (pH 4.35, 0.4 ml). Then, the Ag+ standard solution with a known concentration or real water sample (0.6 ml) was added to the above solution. After 30 min incubation, it was subjected to fluorescence measurement on a Cary Eclipse fluorescence spectrophotometer with an excitation wavelength of 320 nm. For every Ag+ concentration, the fluorescence measurement was repeated thrice, and an average fluorescence signal was obtained.3 Results and discussion
3.1 Synthesis of BSA/DPA–CuNCs
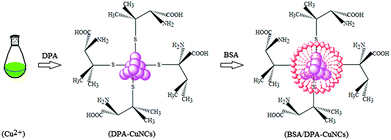
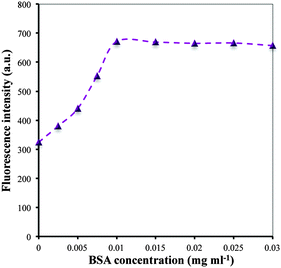
In this work, the role of BSA is mainly designed to improve the stability of DPA–CuNCs but their nanostructure and optical characteristics remain as such. The experiment reveals that choosing an appropriate adding order of BSA is essential to achieve the above aim. First, we attempted to add the mixture of DPA and BSA into the Cu2+ aqueous solution to prepare BSA/DPA–CuNCs. The resulting CuNCs display a fluorescence spectrum with two emission peaks at 420 nm, corresponding to BSA–CuNCs, and 642 nm, corresponding to DPA–CuNCs (shown in Fig. S1, ESI†). The fact confirms that the use of the above method will result in forming BSA–CuNCs and DPA–CuNCs. Because BSA–CuNCs or DPA–CuNCs in the mixture still maintains their intrinsic structure and performance, the use of double stabilizing agents is of no benefit to improve the optical properties of CuNCs by the above scheme. To overcome the problem, we adopted another scheme, in which all Cu2+ in the system were reduced into Cu0 in the presence of DPA to form DPA–CuNCs, and then BSA was introduced to further form BSA/DPA–CuNCs (shown in Fig. 1). The resulting CuNCs offer a similar fluorescence emission spectrum with sole DPA–CuNCs, verifying that the introduction of BSA does not lead to the formation of BSA–CuNCs and the damage of DPA–CuNCs. Due to avoiding the reaction of BSA with Cu2+, all BSA will be adsorbed on the surface of DPA–CuNCs to form an inert BSA shell on the DPA–CuNC surface. In addition, the reaction conditions for the synthesis of BSA/DPA–CuNCs were also optimized, including the reaction time for the preparation of DPA–CuNCs and amounts of BSA. Due to the weak reduction ability of DPA, the formation of DPA–CuNCs requires a relatively long process. Fig. S2 (ESI†) shows that the synthesis of DPA–CuNCs needs a 90 minute reaction time at least. The resulting DPA–CuNCs give a zeta potential of +35.2 mV, indicating a strong positive charge. In the study, the interaction of DPA–CuNCs with BSA was monitored by the zeta potential measurement. As BSA is negatively charged with electricity, their mixing will lead to rapid production of BSA/DPA–CuNCs by their electrostatic attraction. The zeta potential of the DPA–CuNC system immediately decreases upon adding BSA (shown in Fig. S3, ESI†), verifying the formation of BSA/DPA–CuNCs. The relationship of the peak fluorescence intensity with the amounts of BSA is presented in Fig. 2. The peak fluorescence intensity will rapidly increase with the increase of the BSA concentration when the BSA concentration is less than 0.01 mg ml−1. Then, the peak fluorescence intensity reaches its maximum value. Continuously increasing the concentration of BSA, the fluorescence intensity can remain almost unchanged. To obtain a high fluorescence emission, the BSA concentration of 0.02 mg ml−1 was employed for the synthesis.To further understand the interaction of DPA–CuNCs with BSA, synchronous fluorescence and CD technologies were used to investigate the effect of DPA–CuNCs on the structure of BSA. As shown in Fig. S4 (ESI†), the synchronous fluorescence intensities of BSA obviously increase after adding DPA–CuNCs for Δλ of both 15 nm and 60 nm. Often, Δλ of 15 nm or 60 nm may offer the characteristic information about the environmental changes of Tyr or Trp residues in BSA, respectively. Thus, the results demonstrate that the interaction of DPA–CuNCs with BSA changes the configuration of BSA, indicating an increased exposure of Tyr and Trp residues in the BSA. However, the results of CD analysis in Table S1 (ESI†) reveal that the change did not cause obvious damage of the secondary structures in BSA. Based on the above results, we suggest that the electrostatic attraction makes DPA–CuNCs and BSA close to each other and are accompanied by a small change in the configuration of BSA. Such a configuration change let DPA–CuNCs enter into the center of the BSA and finally form an inert BSA shell on the DPA–CuNC surface.
3.2 Structure characterization
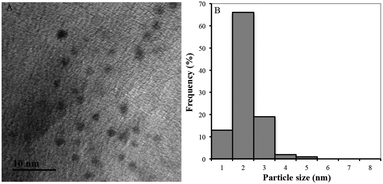
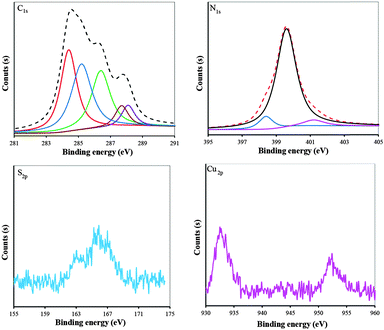
The as-prepared BSA/DPA–CuNC product was characterized by TEM and XPS technologies. The bright field TEM image (Fig. 3a) shows that most of the CuNCs exhibit approximately a spherical shape with low degree of agglomeration. Fig. 3b presents the particle size distribution histogram, which is obtained using an image processing software. The size of the CuNCs is distributed in a narrow range of 1–4 nm with the average particle size of ∼2.2 nm. The standard deviation value (0.4 nm) confirms the narrow size distribution of CuNCs.XPS technology is a powerful tool for studying the surface chemical properties of materials. The C1s, N1s, S2p and Cu2p XPS spectra of BSA/DPA–CuNCs are shown in Fig. 4. On the C1s XPS spectrum there are five peaks. The peaks located at 284.4, 286.6 and 288.1 eV can be assigned to C–C, C–O and C![[double bond, length as m-dash]](https://www.rsc.org/images/entities/char_e001.gif) O species, respectively.18 The XPS peak at 285 eV can be assigned to sp2 C bonded to N. The peak at 288.8 eV can be assigned to O
O species, respectively.18 The XPS peak at 285 eV can be assigned to sp2 C bonded to N. The peak at 288.8 eV can be assigned to O![[double bond, length as m-dash]](https://www.rsc.org/images/entities/char_e001.gif) C–O species. As the binding energy of the element is related to its chemical environment in the material, the binding energy of the element moves to a low energy position if the chemical environment of an element changes from a strong electron withdrawing environment to a relatively low one. The peak at 287.7 eV can be assigned to the sp3 C bonded to N, since the electronegative value of nitrogen is smaller than that of oxygen. On the N1s XPS spectrum the peak at 398.4 eV can be assigned to N2, corresponding to pyridinic N. The peak at 399.8 eV can be assigned to amine. The peak at 401 eV can be assigned to N4 and corresponds to graphitic N. It is noteworthy that the peak intensity of amine nitrogen is remarkably bigger than that of pyridinic nitrogen and graphitic N, implying that amine nitrogen was dominant in the as-prepared CuNCs. This is because the DPA on the surface of BSA/DPA–CuNCs contains many amino groups. On the S2p XPS spectrum there is a relatively strong peak at 165.7 eV, indicating the presence of chemisorbed S on the surface of CuNCs, which is supportive of the presence of Cu and S on the sample. On the Cu2p spectrum there are two prominent peaks. The peaks at 952.1 and 932.7 eV could be assigned to Cu2p1/2 and Cu2p3/2, which were characteristic peaks due to Cu0. The peak of Cu+ cannot distinguish from the peak of Cu0, occurring at 0.1 eV apart from Cu0.
C–O species. As the binding energy of the element is related to its chemical environment in the material, the binding energy of the element moves to a low energy position if the chemical environment of an element changes from a strong electron withdrawing environment to a relatively low one. The peak at 287.7 eV can be assigned to the sp3 C bonded to N, since the electronegative value of nitrogen is smaller than that of oxygen. On the N1s XPS spectrum the peak at 398.4 eV can be assigned to N2, corresponding to pyridinic N. The peak at 399.8 eV can be assigned to amine. The peak at 401 eV can be assigned to N4 and corresponds to graphitic N. It is noteworthy that the peak intensity of amine nitrogen is remarkably bigger than that of pyridinic nitrogen and graphitic N, implying that amine nitrogen was dominant in the as-prepared CuNCs. This is because the DPA on the surface of BSA/DPA–CuNCs contains many amino groups. On the S2p XPS spectrum there is a relatively strong peak at 165.7 eV, indicating the presence of chemisorbed S on the surface of CuNCs, which is supportive of the presence of Cu and S on the sample. On the Cu2p spectrum there are two prominent peaks. The peaks at 952.1 and 932.7 eV could be assigned to Cu2p1/2 and Cu2p3/2, which were characteristic peaks due to Cu0. The peak of Cu+ cannot distinguish from the peak of Cu0, occurring at 0.1 eV apart from Cu0.
3.3 The fluorescence intensity and photostability
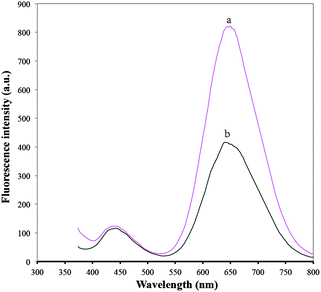
BSA/DPA–CuNCs as a novel optical probe offer higher fluorescence intensity compared with DPA–CuNCs (shown in Fig. 5). The intensity is more than 2-fold that of DPA–CuNCs, verifying that the introduction of BSA can remarkably enhance the fluorescence intensity. In addition, we also measured the quantum yields of CuNCs. The quantum yield of BSA/DPA–CuNCs is about 18.22%, which is higher than that of DPA–CuNCs (10.78%). The enhanced fluorescence intensity should be attributed to the electric neutralization and the isolation effect of BSA. DPA–CuNCs have strong positive charges, the withdrawing electron effect of these positive charges towards CuNCs will lead to an obvious decrease in the fluorescence intensity, leading to weak fluorescence intensity. However, the addition of negatively charged BSA into the positively charged DPA–CuNCs reduces the positive charge on the DPA–CuNC surface by electric neutralization. The action alleviates the withdrawing electron effect and enhances the fluorescence intensity. Thus, BSA/DPA–CuNCs show a stronger fluorescence compared with DPA–CuNCs. Besides, the use of BSA also results in the formation of an inert BSA shell on the CuNC surface. Such a BSA shell can effectively block the direct contact between the CuNC core and the water. This will greatly reduce the fluorescence quenching of water molecules towards CuNCs due to the solvent effect, further enhancing the fluorescence intensity.The photostability of BSA/DPA–CuNCs and DPA–CuNCs was investigated in this study. Here, a quartz cuvette filled with CuNCs was placed under xenon lamp irradiation (300 W) and its fluorescence spectrum was measured on the fluorescence spectrophotometer. Fig. 6 indicates that the fluorescence intensity of DPA–CuNCs slowly decreases with the increase of standing time, indicating a relatively poor photostability. This is because the part of the DPA–CuNC surface is exposed to the outside. This character makes it is easy to be oxidized by oxygen in air, leading to a poor photostability. However, Fig. 6b shows that the fluorescence intensity of BSA/DPA–CuNCs can keep almost unchanged within the irradiating time of 105 min, indicating excellent photostability. Such an excellent photostability should be attributed to the protection of the BSA shell on the CuNC surface.
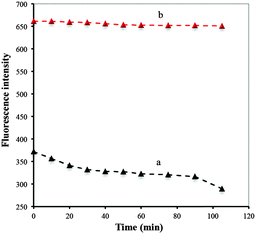 | ||
| Fig. 6 The peak fluorescence intensity of DPA–CuNCs (a) and BSA/DPA–CuNCs (b) with different standing time. | ||
3.4 Fluorescence response towards Ag+
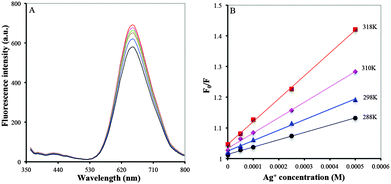
Fluorescence response of BSA/DPA–CuNCs towards Ag+ was investigated in the laboratory. Fig. 7 presents the fluorescence spectra of BSA/DPA–CuNCs in the presence and absence of 1.0 × 10⁻⁸ M Ag+. It can be seen that the addition of Ag+ brings an obvious fluorescence quenching. The peak fluorescence intensity change (ΔF) is up to 221 (about 36.8%). Based on the fluorescence quenching, the BSA/DPA–CuNC nanosensor was developed for the fluorescence detection of Ag+. As a control sample, DPA–CuNCs were also used for the fluorescence response test by using the same procedure. It was found that the addition of 1.0 × 10⁻⁸ M Ag+ only causes a small fluorescence quenching (about 8.5%), verifying that the BSA/DPA–CuNCs have more sensitive response towards Ag+ compared with DPA–CuNCs.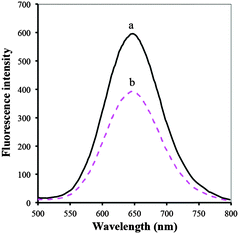 | ||
| Fig. 7 The fluorescence spectra of BSA/DPA–CuNCs in the presence and absence of 1.0 × 10⁻⁸ Ag+ at pH 4.35. | ||
The fluorescence quenching is generally classified as dynamic and static quenching. The former occurs due to collisional deexcitation of the fluorophore to the ground state while the latter takes place by forming a non-fluorescent ground state complex between the quencher and the fluorophore. Dynamic and static quenching behaviors can be distinguished by investigating the fluorescence quenching rate constant at different temperatures. To study the mechanism for the fluorescence response of BSA/DPA–CuNCs towards Ag+, the Stern–Volmer equation was used to investigate the fluorescence quenching data with respect to temperature:
 | (2) |
The fluorescence quenching in the presence of Ag+ should be attributed to the interaction of BSA/DPA–CuNCs with Ag+, leading to the formation of a non-fluorescent ground state complex. On the one hand, the amino group in the DPA combines with Ag+ to form a stable coordination bond, leading to fluorescence quenching. On the other hand, sulfydryl groups in the BSA combines with Ag+ to form a stable Ag–S covalent bond, further leading to fluorescence quenching. More importantly, the special structure of BSA/DPA–CuNCs allows Ag+ to simultaneously interact with the amino group and the sulfydryl group to form a stable complex. The action will result in a higher level of energy decrease compared with the sole amino group or the sulfydryl group.
3.5 Effects of the pH and ion strength
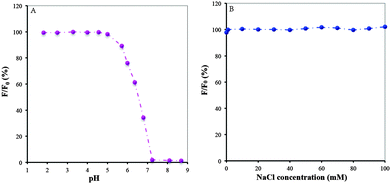
Effects of the pH in the medium on the detection of 1.0 × 10⁻⁸ Ag+ using BSA/DPA–CuNCs as a nanosensor were investigated in the laboratory. Fig. 9A shows the peak fluorescence retention rate (F/F0) of BSA/DPA–CuNCs after adding 1.0 × 10⁻⁸ Ag+ in the BR of different pH without NaCl. Here, F and F0 were the peak fluorescence intensity after and before adding Ag+, respectively. It can be seen that the F/F0 can remain almost unchanged at pH between 1.5 and 5. When the pH exceeds 5.0, the F/F0 rapidly decreases with the increase of pH. When the pH is more than 7.0, the F/F0 is close to zero. In order to understand the above effect, we measured the zeta potential and fluorescence intensity of BSA/DPA–CuNCs at different pHs, respectively. It was found that BSA/DPA–CuNCs have strong positive charge on the surface under acidic conditions (pH < 5). Due to strong electrostatic repulsion between different CuNCs, BSA/DPA–CuNCs exhibit an excellent stability under acidic conditions. More importantly, the repulsion greatly increases the distance between CuNCs. This behavior can effectively reduce the fluorescence quenching caused by the energy transfer between the CuNCs. However, the positive charge of BSA/DPA–CuNCs will rapidly reduce with the increase of pH. The loss of surface charge tends to create serious CuNC aggregation. The aggregation largely quickens the energy transfer between the CuNCs, thus resulting in fluorescence quenching and insensitive response towards Ag+. To obtain high sensitivity, the BR buffer of pH 4.35 was used in following experiments.Fig. 9B presents the peak fluorescence retention rate (F/F0) of BSA/DPA–CuNCs at the BR of pH 4.35 containing different NaCl concentrations after adding 1.0 × 10⁻⁸ Ag+. Here, F and F0 were the peak fluorescence intensity after and before adding Ag+, respectively. Even in 1 M NaCl, only a 15% decrease of the F/F0 was observed compared to that without NaCl, indicating that BSA/DPA–CuNCs could be applied in high ionic strength environments. The fluorescence intensity of CuNCs and the F/F0 remained almost constant when exposed to 0.0–100 mM NaCl solutions, indicating the ionic strength had no significant effect on the fluorescence detection of Ag+.
3.6 Analytical characteristics
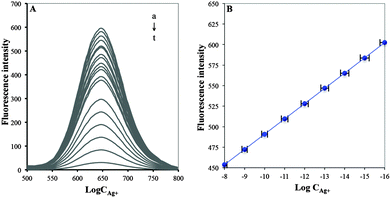
BSA/DPA–CuNCs were developed as new nanosensors for the fluorescence detection of Ag+. Fig. 10 shows the fluorescence response of the nanosensor for different concentrations of Ag+ and the calibration plot of logarithmic Ag+ content vs. corresponding peak fluorescence intensity. It can be seen that the fluorescence intensity decreases with the increase of Ag+ concentration. The peak fluorescence intensity will linearly decrease with the increase of Ag+ concentration in the range of 1.0 × 10⁻⁸–1.0 × 10⁻¹⁶ M. The linear equation was F = −18.583 × log![[thin space (1/6-em)]](https://www.rsc.org/images/entities/char_2009.gif) C + 305.13, with a statistically significant correlation coefficient of 0.9997, where F is the peak fluorescence intensity of BSA/DPA–CuNCs and C is Ag+ concentration (M) in the solution. The detection limit was found to be 4.3 × 10⁻¹⁷ M that was obtained from the signal-to-noise characteristics of these data (S/N = 3). The sensitivity is obviously higher than that of other optical methods listed in Table 1.
C + 305.13, with a statistically significant correlation coefficient of 0.9997, where F is the peak fluorescence intensity of BSA/DPA–CuNCs and C is Ag+ concentration (M) in the solution. The detection limit was found to be 4.3 × 10⁻¹⁷ M that was obtained from the signal-to-noise characteristics of these data (S/N = 3). The sensitivity is obviously higher than that of other optical methods listed in Table 1.
| Material | Linear range (nM) | Limit of detection (nM) | Detection technique | Sample | Ref. |
|---|---|---|---|---|---|
| Polyethylenimine-stabilized gold nanoparticles | 1.09–1.09 × 10² | 1.09 | Colorimetric method | Tap water drinking water | 20 |
| Thioflavin T/AgI supraparticle | 1.0 × 10²–1.0 × 10⁴ | 50 | Fluorescent method | Water | 21 |
| Gold nanostar@Raman-reporter@silica sandwich structurture via DNA hybridization | 0.001–10 | 1.7 × 10⁻³ | Surface-enhanced Raman scattering | Human saliva | 22 |
| E-3′,6′-Dihydroxy-2-(thiazol-2-ylmethylene)aminospiro [isoindoline-1,9′-xanthen]-3-one | 1.0 × 10²–1.0 × 10⁴ | 80 | Fluorescent method | Tap water, river water and lake water | 23 |
| Photoluminescent polymer carbon nanoribbons | 5–8.0 × 10⁴ | 1.73 | Fluorescent method | Biological sample | 24 |
| BSA/DPA–CuNCs | 1.0 × 10⁻⁷–10 | 4.3 × 10⁻⁸ | Fluorescent method | Natural water | Present work |
The nanosensor was repeatedly measured twenty times in 1.0 × 10⁻⁹ M of Ag+ standard solution under the same conditions. The relative standard deviation of 2.9% for the measurements was obtained, indicating good precision. The BSA/DPA–CuNC product was stored at 4 °C and its sensitivity for the detection of 1.0 × 10⁻⁹ M Ag+ was checked every week. The intensity can keep its initial response of 98.5% after the period of eighteen weeks, indicating excellent long-term stability. The interference from possible cations and anions existing in environmental water for the detection of 1.0 × 10⁻⁹ M Ag+ was investigated. K+, Na+, Ca2+, Mg2+, SO42−, CO32−, PO43−, NO3− and Cl− are main ions in environmental water. The results indicate that 50 mM of each ion leads to far less than 5% of fluorescence quenching. This is because the above ions do not react with the amino group in the DPA and the sulfydryl group in the BSA attached on the surface of CuNCs. Cu2+, Zn2+ and Ni2+ are at a trace level in environmental water. These ions can combine with the amino and sulfydryl groups to form chemical bonds, which may lead to fluorescence quenching. For example, the existence of 1.0 mM Cu2+ causes more than 42% of fluorescence quenching. To eliminate their interferences, ethylene diamine tetraacetic acid (termed as EDTA) was added into the water sample prior to BSA/DPA–CuNCs. Cu2+, Zn2+ and Ni2+ can react with EDTA to form stable complexes, which cannot interact with CuNCs and leads to fluorescence quenching. The results show that 0.5 mM of Cu2+, Zn2+ or Ni2+ do not interfere with the fluorescence detection of Ag+ when 1 mM of EDTA was used as a masking agent.
3.7 Detection of silver ions in water samples
Feasibility of the proposed method for possible applications was investigated by analyzing water samples. In this study, tap water, ground water, lake water and river water samples used were collected from Jiangsu province in China. The recovery experiments were performed by measuring the fluorescence responses to the sample, in which the known concentrations of Ag+ was added. The concentration of Ag+ in water samples was determined from the calibration curve and the value was used to calculate the concentration in the original sample. The results of detection of Ag+ in water samples are shown in Table 2. The recovery of Ag+ in water samples ranged from 95.6 to 104.6%. These indicated that the proposed method has good accuracy and precision.| Samples | Added (nM) | Found (nM) | Recovery (%) |
|---|---|---|---|
| Tap water | 0.0 | 1.29 | |
| 5.0 | 6.32 | 100.6 | |
| Ground water | 0.0 | 4.16 | |
| 5.0 | 9.10 | 98.8 | |
| Lake water | 0.0 | 0.83 | |
| 5.0 | 5.61 | 95.6 | |
| River water | 0.0 | 1.02 | |
| 5.0 | 6.25 | 104.6 |
4 Conclusions
This study demonstrated the synthesis of D-penicillamine and bovine serum albumin co-stabilized copper nanoclusters. The as-prepared copper nanoclusters exhibits a better fluorescence intensity, photostability and response towards Ag+ compared with D-penicillamine-stabilized copper nanoclusters. The copper nanoclusters have been used as novel nanosensor for fluorescence detection of Ag+. The analytical method provides the advantage of sensitivity, repeatability and stability compared with present optical sensors for Ag+. The study also opens a new avenue for the fabrication of functional metal nanoclusters that hold great promise in the potential applications such as nanosensors, biocatalysts and molecular carriers.Acknowledgements
The authors acknowledge financial support from Colleges and Universities Graduate Research Innovation Project of Jiangsu province (KYLX15_1159), Prospective Joint Research Project: Cooperative Innovation Fund (BY2014023-01), National Natural Science Foundation of China (21176101), Fundamental Research Funds for Central Universities (JUSRP51314B) and MOE & SAFEA for the 111 Project (B13025).Notes and references
- K. Schouteden, K. Lauwaet, E. Janssens, G. Barcaro, A. Fortunellic, C. V. Haesendonck and P. Lievens, Nanoscale, 2014, 6, 2170–2176 RSC.
- B. Khlebtsov, E. Tuchina, V. Tuchinbcd and N. Khlebtsov, RSC Adv., 2015, 5, 61639–61649 RSC.
- L. Gong, H. L. Kuai, S. L. Ren, X. H. Zhao, S. Y. Huan, X. B. Zhang and W. H. Tan, Chem. Commun., 2015, 51, 12095–12098 RSC.
- S. Meerod, B. Rutnakornpitud, U. Wichai and M. Rutnakornpituk, J. Magn. Magn. Mater., 2015, 392, 83–90 CrossRef CAS; X. Y. Zhou, R. Y. Li, X. F. Wu and Z. J. Li, Anal. Methods, 2014, 6, 2862–2869 RSC; X. Q. Liao, R. Y. Li, X. H. Long and Z. J. Li, RSC Adv., 2015, 5, 48835–48841 RSC.
- X. F. Wu, R. Y. Li and Z. J. Li, RSC Adv., 2014, 4, 9935–9941 RSC.
- X. Q. Liao, R. Y. Li, Z. J. Li, X. L. Sun, Z. P. Wang and J. K. Liu, New J. Chem., 2015, 39, 5240–5248 RSC.
- B. Pergolese, M. Muniz-Miranda and A. Bigotto, J. Phys. Chem. B, 2006, 110, 9241–9245 CrossRef CAS PubMed.
- C. X. Wang, H. Cheng, Y. J. Huang, Z. Z. Xu, H. H. Lin and C. Zhang, Analyst, 2015, 140, 5634–5639 RSC.
- X. F. Wu, R. Y. Li, Z. J. Li, J. K. Liu, G. L. Wang and Z. G. Gu, RSC Adv., 2014, 4, 24978–24985 RSC.
- C. Y. Ke, Y. T. Wu and W. L. Tseng, Biosens. Bioelectron., 2015, 69, 46–53 CrossRef CAS PubMed.
- T. Zhao, X. W. He, W. Y. Li and Y. K. Zhang, J. Mater. Chem. B, 2015, 3, 2388–2394 RSC.
- C. J. Yu, T. H. Chen, J. Y. Jiang and W. L. Tseng, Nanoscale, 2014, 6, 9618–9624 RSC.
- H. Huang, H. Li, A. J. Wang, S. X. Zhong, K. M. Fang and J. J. Feng, Analyst, 2014, 139, 6536–6541 RSC.
- Z. Y. Wang, L. Si, J. C. Bao and Z. H. Dai, Chem. Commun., 2015, 51, 6305–6307 RSC.
- D. Q. Feng, G. L. Liu and W. Wang, J. Mater. Chem. B, 2015, 3, 2083–2088 RSC.
- X. M. Yang, Y. J. Feng, S. S. Zhu, Y. W. Luo, Y. Zhuo and Y. Dou, Anal. Chim. Acta, 2014, 847, 49–54 CrossRef CAS PubMed.
- R. Ghosh, A. K. Sahoo, S. S. Ghosh, A. Paul and R. Chattopadhyay, ACS Appl. Mater. Interfaces, 2014, 6, 3822–3828 CAS.
- Z. G. Mou, X. Y. Chen, Y. K. Du, X. M. Wang, P. Yang and S. D. Wang, Appl. Surf. Sci., 2011, 258, 1704 CrossRef CAS.
- M. R. Eftink and C. A. Ghiron, Anal. Biochem., 1981, 114, 199–202 CrossRef CAS PubMed.
- Y. Liu, Y. Liu, Z. F. Li, J. S. Liu, L. Xu and X. Y. Liu, Analyst, 2015, 140, 5335–5343 RSC.
- Y. Y. Li, M. Zhang, L. F. Lu, A. W. Zhu, F. Xia, T. S. Zhou and G. Y. Shi, Analyst, 2015, 140, 6108–6113 RSC.
- P. Zheng, M. Li, R. Jurevic, S. K. Cushing, Y. X. Liu and N. Q. Wu, Nanoscale, 2015, 7, 11005–11012 RSC.
- D. S. Lin, J. P. Lai, H. Sun, Z. Yang and Y. Zuo, Anal. Methods, 2014, 6, 1517–1522 RSC.
- Z. X. Wang and S. N. Ding, Anal. Chem., 2014, 86, 7436–7445 CrossRef CAS PubMed.
Footnote |
| † Electronic supplementary information (ESI) available. See DOI: 10.1039/c5nj02615f |
| This journal is © The Royal Society of Chemistry and the Centre National de la Recherche Scientifique 2016 |

