Controllable synthesis of VO2(D) and their conversion to VO2(M) nanostructures with thermochromic phase transition properties†
Zhengdong
Song
a,
Liangmiao
Zhang
a,
Fang
Xia
b,
Nathan A. S.
Webster
c,
Jingchao
Song
d,
Bin
Liu
a,
Hongjie
Luo
ae and
Yanfeng
Gao
*ae
aSchool of Materials Science and Engineering, Shanghai University, 99 Shangda Rd, Shanghai, China. E-mail: yfgao@shu.edu.cn
bSchool of Engineering and Information Technology, Murdoch University, Murdoch, WA 6150, Australia
cCSIRO Mineral Resources, Private Bag 10, Clayton South, VIC 3169, Australia
dDepartment of Materials Science and Engineering, Monash University, Clayton, VIC 3800, Australia
eMaterials Genome Institute, Shanghai University, 99 Shangda Rd, Shanghai, China
First published on 2nd June 2016
Abstract
VO2(M) nanostructures of various shapes were synthesized by a hydrothermal-calcination method. First, VO2(D) nanoparticles were synthesized by the surfactant-free hydrothermal reduction of ammonium metavanadate by oxalic acid at 160–220 °C. Then, the produced VO2(D) was further calcined at 250–600 °C to obtain the VO2(M) nanoparticles. To understand the hydrothermal reduction processes, both in situ powder X-ray diffraction (PXRD) and ex situ characterization were carried out. The results indicate a sequential process starting from the reduction of ammonium metavanadate and nucleation of the vanadium precursor, followed by the formation of intermediate VO2(B) nanosheets or nanorods, and finally phase transformation from VO2(B) to VO2(D) with a variety of morphologies. A crystal growth mechanism based on self-assembly and Ostwald ripening was proposed to explain the formation process of these unique nanostructures. The as-prepared VO2(M) nanoaggregates exhibited a lower thermochromic phase transition temperature (41.0 °C) and a narrower thermal hysteresis width (6.6 °C) than those nanopowders prepared by other methods.
Introduction
Vanadium dioxide (VO2) has a number of polymorphs, including the thermodynamically stable phases monoclinic VO2(M)1 and rutile VO2(R),1 and the metastable phases including tetragonal VO2(A),2 monoclinic VO2(B),3 VO2(C)4 and VO2(D).5 The metal–insulator transition (MIT) occurs at a critical temperature of about 341 K![[thin space (1/6-em)]](https://www.rsc.org/images/entities/char_2009.gif) 1 between VO2(M) and VO2(R), resulting in remarkable changes in optical and electrical properties. Owing to this unique property, VO2(M) has been a key functional material for storage devices6 and switches,7 and is a promising candidate material for fabricating smart windows.8–10 In the recent years, much effort has been made aiming to prepare higher performing VO2(M) with a lower phase transition temperature (Tc)11,12 and enhanced optical and electrical properties.13
1 between VO2(M) and VO2(R), resulting in remarkable changes in optical and electrical properties. Owing to this unique property, VO2(M) has been a key functional material for storage devices6 and switches,7 and is a promising candidate material for fabricating smart windows.8–10 In the recent years, much effort has been made aiming to prepare higher performing VO2(M) with a lower phase transition temperature (Tc)11,12 and enhanced optical and electrical properties.13
There have been a number of difficulties encountered in the synthesis of VO2(M) nanoparticles.14,15 The most challenging difficulty is probably the precise control of the oxygen partial pressure within a narrow range, which has been rarely achieved by synthesis methods such as magnetron-sputtering,16 the vapor transport approach17 and the decomposition of vanadium compounds at elevated temperatures.18 Although the one-step hydrothermal synthesis of VO2(M) nanoparticles has been achieved in 2008,19 metastable phases such as VO2(B), VO2(A) or VO2(D) often present as impurities. More recently, these metastable vanadium dioxide phases have been highlighted as suitable precursors for synthesizing VO2(M) nanoparticles by high temperature calcination. For example, Popuri reported a rapid way to synthesize VO2(M1) by annealing VO2(B) nanoplates obtained by an economical hydrothermal synthesis.20 Corr prepared VO2(R) nanomaterials by the thermal treatment of VO2(B) nanorods.21 Zhang synthesized VO2(A) nanobelts by the transformation of VO2(B) under hydrothermal conditions, and VO2(A) was further converted to VO2(M) by a convenient annealing process.22 In 2011, Xie first synthesized VO2(D) microstructures by a mild hydrothermal route.5 Li synthesized star-shaped VO2(D) nanoparticles using ammonium metavanadate as the vanadium resource and formic acid as the reducing agent.23,24 It was found that the metastable monoclinic VO2(D) shares a similar structure and formation energy to VO2(M). Hence, both of the early studies obtained VO2(M) nanoparticles with excellent thermochromic performance by the post-annealing treatment of VO2(D).5,23,24 Nevertheless, few studies have been devoted to understanding the formation of the metastable monoclinic VO2(D) phase under hydrothermal conditions and its further phase transition to other phases.
Vanadium dioxides have been synthesized using NH4VO3 as the vanadium source and H2C2O4 as the reducing agent. A variety of polymorphs were obtained depending on different hydrothermal conditions. For example, Ni and co-workers reported the synthesis of metastable VO2(B) with different morphologies by simply tuning the molar ratios of NH4VO3 to H2C2O4 (7.26![[thin space (1/6-em)]](https://www.rsc.org/images/entities/char_2009.gif) :
:![[thin space (1/6-em)]](https://www.rsc.org/images/entities/char_2009.gif) 1, 5.8
1, 5.8![[thin space (1/6-em)]](https://www.rsc.org/images/entities/char_2009.gif) :
:![[thin space (1/6-em)]](https://www.rsc.org/images/entities/char_2009.gif) 1, 4.8
1, 4.8![[thin space (1/6-em)]](https://www.rsc.org/images/entities/char_2009.gif) :
:![[thin space (1/6-em)]](https://www.rsc.org/images/entities/char_2009.gif) 1) at 180–200 °C for 36 or 48 h.25 Li et al. prepared VO2(A) nanofibers via this system at 240 °C for 24 h by adjusting its pH value with H2SO4.26 Parkin and his team presented a two-step synthesis route for the preparation of VO2(M) nanoparticles using continuous flow synthesis under supercritical conditions (375 °C, 24.1 MPa) followed by a short post heat treatment step.27 The nanorod-like V2O5 was fabricated using NH4VO3 and H2C2O4 as reactants at 180 °C for 3.5 h by controlling the pH value with HCl.28
1) at 180–200 °C for 36 or 48 h.25 Li et al. prepared VO2(A) nanofibers via this system at 240 °C for 24 h by adjusting its pH value with H2SO4.26 Parkin and his team presented a two-step synthesis route for the preparation of VO2(M) nanoparticles using continuous flow synthesis under supercritical conditions (375 °C, 24.1 MPa) followed by a short post heat treatment step.27 The nanorod-like V2O5 was fabricated using NH4VO3 and H2C2O4 as reactants at 180 °C for 3.5 h by controlling the pH value with HCl.28
In this work, the VO2(D) polymorphs were also synthesized by reduction of ammonium metavanadate by oxalic acid under mild hydrothermal conditions. The effects of reaction temperature (160–220 °C), time (1–18 h), and solid content (2.8–10.0 wt%) were investigated thoroughly. This study not only provides insight into the formation mechanisms of the cucumber-like VO2(D) under hydrothermal conditions, but it also sheds light on the phase transition process of vanadium dioxide. These findings can help us to achieve the purpose of custom syntheses of different VO2 phases.
Experimental section
Materials and synthesis
Ammonium metavanadate (NH4VO3) and oxalic acid dihydrate (H2C2O4·2H2O) were purchased from Aladdin Ltd (Shanghai, China). In a typical synthesis, 30 mmol ammonium metavanadate and 40 mmol oxalic acid dihydrate were added to 16 mL H2O, and then the mixture solution was stirred for another 5 minutes. Subsequently, the precursor solution (17 mL) was transferred into a 25 mL Teflon-lined stainless autoclave and heated to the designed target temperature (160–220 °C) and maintained at the target temperature for a period of time (1–18 h). After that, the autoclave was cooled to room temperature naturally, and the resulting black precipitate was collected by centrifugation, washed with distilled water and ethanol three times, and ultimately dried at 60 °C for 12 h in a vacuum oven. The detailed experimental parameters and the hydrothermally produced phases and morphologies of VO2 are summarized in Table S1.† The hydrothermally synthesized VO2(D) was further calcined at 250–600 °C for 3 hours to obtain the VO2(M) nanostructures.Ex situ characterization
The crystallographic structure of the obtained powders was determined by X-ray diffraction (XRD, Rigaku D/Max-RB) with Cu-Kα radiation (λ = 1.5418 Å). The morphology, microstructure and particle size of the prepared powders were examined by field-emission scanning electron microscopy (FESEM, JSM-6700F, JEOL) and transmission electron microscopy (TEM, JEOL Model 2010). Differential scanning calorimetry (DSC, NETZSCH 200) was employed to measure the phase transition temperature, under a constant heating and cooling rate of 10 °C min−1.In situ PXRD monitoring the hydrothermal synthesis of VO2(D) nanoparticles
The in situ powder X-ray diffraction measurement was carried out using an Inel EQUINOX 3000 instrument with Mo-Kα radiation (λ = 0.7093 Å) at CSIRO Mineral Resources. The mixture of ammonium metavanadate (3.5097 mg), oxalic acid dihydrate (5.0428 mg) and 16 μL H2O was injected into a quartz glass capillary microreactor (1 mm in diameter, 0.1 mm in wall thickness and 40 mm in length). 3.0 MPa of N2 pressure was applied to the sealed capillary to prevent vaporization and boiling of the precursor solution when heated. The microreactor was fixed at the X-ray beam center, and heated to 80 °C with a heating rate of 2 °C min−1 by using a hot air blower. Then the temperature was increased to 200 °C rapidly in order to suppress the generation of bubbles. A K-type thermocouple was placed 3.5 mm beneath the capillary to monitor the temperature. During the heating process, the capillary was constantly rotated to ensure uniform heating of the capillary. Diffraction patterns were collected every 2 minutes, and the measurement was terminated when there were no obvious changes in the diffraction pattern. More details of our experimental setup have been described previously.29–31Results and discussion
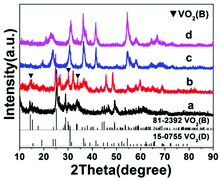
The hydrothermal synthesis of vanadium dioxide from ammonium metavanadate and oxalic acid was found to be very sensitive to reaction parameters, including temperature, time, and solid content, which is defined as the weight percent of solid precursors to the total weight of the reaction mixture. By adjusting these reaction parameters, VO2(B) or VO2(D) can be obtained with a variety of morphologies, from nanosheets, nanoaggregates to cucumber-, walnut-, or carambole-like nanostructures.Temperature has a profound influence on the formation of VO2 polymorphs as well as the corresponding morphologies (see Experiments A3, A4, A10, and A11 in Table S1†). Low reaction temperature (160–180 °C) favors the formation of VO2(B) while high temperature (180–220 °C) favors the formation of VO2(D). Also low reaction temperature tends to produce nanosheets while at high reaction temperature cucumber-like or carambole-like morphologies are likely to form. Fig. 1 and 2 show the XRD patterns and the SEM patterns of the corresponding samples synthesized at different temperatures for 18 h with a solid content of 10 wt%. At 160 °C (A3), XRD suggested that the synthesis produced phase pure VO2(B) phase (JCPDS card no. 81-2392) (Fig. 1a), which had a nanosheet morphology of 600 nm in length, 200 nm in width and 20–50 nm in thickness (Fig. 2a). At the high temperature of 180 °C (A4), the synthesis produced a mixture of VO2(B) and VO2(D) (Fig. 1b) having a loose aggregated microstructure with a diameter of 5 μm (Fig. 2b). At an even higher temperature of 200 °C (A10), the synthesis produced phase pure VO2(D) (Fig. 1c) with a cucumber-like nanostructure. The size of these uniform cucumber-like nanoparticles was 1 μm in length and 450 nm in diameter (Fig. 2c). At the highest temperature studied (220 °C) (A11), a carambole-like VO2(D) nanostructure with numerous surface grooves was obtained (Fig. 1d and 2d).
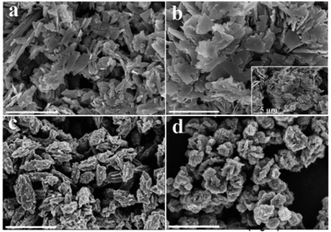 | ||
| Fig. 2 SEM images of the products synthesized from the same precursor with 10 wt% solid content at (a) 160 °C, (b) 180 °C, (c) 200 °C, and (d) 220 °C for 18 h. The scale bar is 2 μm. | ||
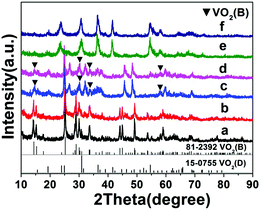
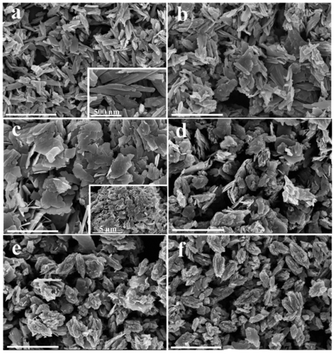
The influence of time on the synthesis is similar to that of temperature. For synthesis starting from a precursor of 10 wt% solid content and at 200 °C, a short reaction time (1–9 h) favors the formation VO2(B) nanorods or nanosheets (A5–A8), while a longer reaction time (9–18 h) produces the formation of VO2(D) and the cucumber-like morphology (A8–A10) (Fig. 3 and 4). After 1 h (A5), VO2(B) (JCPDS card no. 81-2392) could be obtained with a high yield, and its morphology consisted of nanorods with a size of 600 nm in length, 160 nm in width and 30–50 nm in thickness (Fig. 3a and 4a). After 3 h (A6), the VO2(B) nanorods grew further to a size of 700 nm in length, 200 nm in width and 40–50 nm in thickness (Fig. 3b and 4b). However, after a longer reaction time of 6 h (A7), some diffraction peaks belonging to the VO2(D) emerged and some peaks of VO2(B) disappeared at the same time (Fig. 3c), suggesting the formation of VO2(D) at the expense of VO2(B). Accompanied by this phase transition of VO2, the nanosheets tended to combine and assemble together to form an aggregated microstructure with a diameter of about 5 μm, as shown in Fig. 4c. The coexistence of VO2(B) and VO2(D) was also observed in Fig. 3d at a reaction time of 9 h (A8). The nanosheets were further attached together to the semi-finished cucumber-like nanostructure (Fig. 4d). Then, when the time was further prolonged to 12 h (A9), all the VO2(B) nanostructures were transformed into VO2(D) phases (Fig. 3e). Correspondingly, lots of semi-finished cucumber-like nanostructures composed of several combined nanosheets can be clearly observed, probably due to the effect of attaching or integration of nanosheets (Fig. 4e). Finally, the cucumber-like VO2(D) nanoparticles became uniform and no other morphology remained after reacting for 18 h (A10), as shown in Fig. 3f and 4f. The intermediate solid content (5.1 wt%) favors the transformation from VO2(B) nanorods to VO2(B + D) nanosheets and then to VO2(A + D) nanowalnuts, as shown in Fig. S1.† The fact that temperature and time have a similar effect on the synthesis suggests that the reaction kinetics rather than thermodynamics played a more important role in the determination of the final VO2 polymorph and morphology.
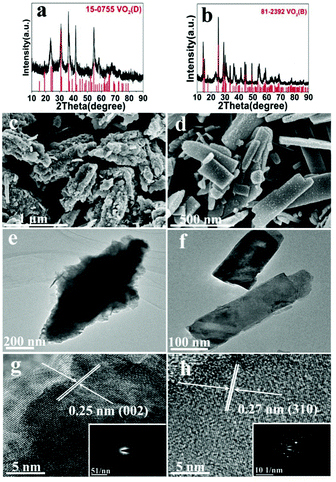
The effect of solid content was also discussed, at 200 °C (A1, A10) and 220 °C (A2, A11). At 200 °C low solid content (2.8 wt%) favors the formation of VO2(B) and nanosheets, while high solid content (10 wt%) favors the formation of VO2(D) and the cucumber-like morphology (Fig. 5a, c and e). When the solid content was high (10 wt%) (A10), pure monoclinic VO2(D) (JCPDS card no. 15-0755) was synthesized. The SEM image (Fig. 5c) showed that the products were uniform cucumber-like nanostructures with an average diameter of ca. 400 nm and length of ca. 1 μm. The cucumber-like nanostructures were confirmed by the TEM image (Fig. 5e). The HRTEM image showed clear lattice fringes and an interplanar distance of 0.25 nm which could be indexed to the (002) plane of the VO2(D) (Fig. 5g). On the other hand, when the solid content was low (2.8 wt%) (A1), VO2(B) rather than VO2(D) was synthesized (Fig. 5b, d and f). The calculated average size of the nanosheets was about 480 nm in length, 180 nm in width and 80 nm in thickness. The lattice fringes were clearly seen and the interplanar distance of 0.27 nm could be indexed to the (310) lattice planes of VO2(B) (Fig. 5h). The corresponding SAED data further demonstrated that the nanosheets were VO2(B) (inset in Fig. 5h).
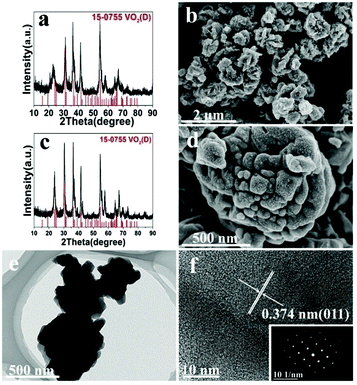
However, at a high temperature of 220 °C, temperature played a more important role than solid content in determining the structure of VO2, since both low and high solid content experiments (A2, A11) produced VO2(D), which is in agreement with what we have observed for the effect of temperature on the formation of the VO2 polymorph. However, solid content affected the morphology of VO2(D) nanostructures at this temperature: low solid content produced nanoaggregates (Fig. 6d) while high solid content formed the carambole-like morphology (Fig. 6b). Interestingly, TEM showed that the aggregates formed at low solid content had a lot of grooves on the surface (Fig. 6e). The average diameter of the aggregates was about 650 nm. High-resolution TEM (HRTEM) revealed well-resolved lattice fringes with a spacing of 0.374 nm, corresponding to the (011) lattice plane of the VO2(D) (Fig. 6f).
In order to reveal the hydrothermal synthesis in greater detail, an in situ X-ray diffraction (XRD) experiment was conducted. Compared with ex situ characterization, in situ XRD has the advantages of monitoring the phase evolution in real time under hydrothermal conditions, rather than characterizing quenched samples which may have experienced some changes during the quenching process. It is expected that the hydrothermal mechanism can be elaborated more clearly. In situ XRD results (Fig. 7) showed that the reaction mixture remained amorphous during the early stage of heating from room temperature to about 80 °C. This may mean the dissolution of precursor into water and the nucleation of VO2. Then, when temperature was further raised above 80 °C, bubbles were generated within the mixture which could be seen from the transparent capillary microreactor, suggesting intense reactions produced gases. The diffraction peaks belonging to VO2(D) appeared gradually and became stronger with increasing temperature and time (Fig. 7). Interestingly, crystalline VO2(D) formed directly from the amorphous mixture and no VO2(B) intermediate was observed. This contradicted the observation from ex situ characterization. Possible explanations are: (1) the metastable VO2(B) phase was formed during the quench process, or (2) the intermediate VO2(B) only presented for a very short time, preventing it from being captured by in situ PXRD. The second explanation may be reasonable because the reaction rate is often much faster in the microreactor when compared with the same reaction in laboratory autoclaves.30,32–35
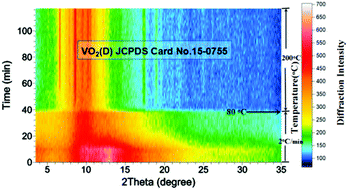 | ||
| Fig. 7 Accumulated time-resolved in situ PXRD patterns (viewed down the intensity axis) collected during the synthesis at 200 °C (λ = 0.7093 Å, solid content = 10 wt%). | ||
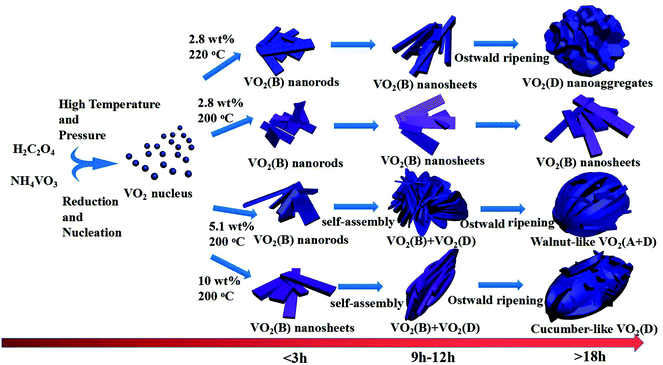
Based on the results of the ex situ and in situ experiments, a formation mechanism was proposed to elucidate the growth of the cucumber-like VO2(D), as illustrated in Scheme 1.36,37 Firstly, ammonium metavanadate dissolved to form the VO3− ions, then it was reduced and nucleated to form (NH4)2[(VO)2(C2O4)3] molecules. The basic reaction process of the vanadium precursor can be described by the following equations:38,39
 | (1) |
 | (2) |
| VOC2O4 → VO2 + CO + CO2 | (3) |
Subsequently, it was decomposed to VO2(B) nanorods or nanosheets assembled with corner- and edge-sharing VO6 octahedra units. Then, in order to reduce the systematic energy, the nanorods or sheets combined and attached together into cucumber-like or walnut-like nanoparticles under the synergistic effects of self-assembly40 and the Ostwald ripening41 processes. At a low solid content of 2.8 wt% at 200 °C, the VO2(B) nanosheets could be easily formed with the high anisotropy characteristics of VO2. The uniform nanorods or sheets grew longer and thicker with increased time. However, at a higher temperature of 220 °C for the same low solid content mixture, the VO2(D) nanoaggregates was obtained according to the Ostwald ripening mechanism by consuming the surrounding VO2(B) nanosheets.
Once VO2(D) was obtained by the hydrothermal synthesis, VO2(M) can be easily obtained by calcining VO2(D) in vacuum. Fig. 8 presents the XRD patterns and SEM images of the as-obtained VO2(M) thermally treated VO2(D) cucumber-like or aggregate particles at 550 °C for 3 h. All the diffraction peaks shown in Fig. 8a and c could be well indexed to the monoclinic VO2(M) phase (JCPDS card no. 43-1051). After calcination treatment in a vacuum, the cucumber-like morphology and nanoaggregates of VO2(D) could be completely preserved as VO2(M) (Fig. 8b and d).
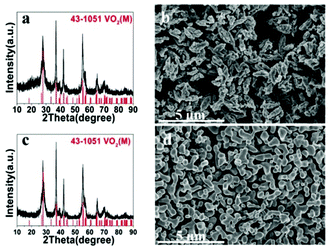 | ||
| Fig. 8 XRD patterns and SEM images of the as-obtained cucumber shaped VO2(M) (a, b) and VO2(M) nanoaggregates (c, d). | ||
To demonstrate the metal–insulator transition property of the synthesized VO2(M) nanoparticles, differential scanning calorimetry (DSC) measurements were conducted. The DSC results for the cooling and heating cycles of the different morphologies of the VO2(M) obtained at different calcining temperatures are summarized in Table 1. Fig. 9 shows the DSC curves of the cucumber-like VO2(M) calcined at temperatures of 500, 550 and 600 °C. We can see that the phase transition temperature (Tc) showed a monotonous increase from 66.2 °C to 67.5 °C during the heating cycle and from 56.8 °C to 57.9 °C during the cooling cycle, while the thermal hysteresis width calculated from the DSC curves was also increased from 9.4 °C to 9.6 °C.
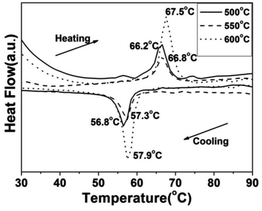 | ||
| Fig. 9 DSC curves of the cucumber-like VO2(M) transformed from the VO2(D) phase at different calcining temperatures (—: 500 °C, --: 550 °C, ⋯: 600 °C) in vacuum (solid content = 10 wt%). | ||
| Phase morphology | T calcining (°C) | T c-heating (°C) | T c-cooling (°C) | ΔT (°C) |
|---|---|---|---|---|
| Cucumber-like VO2(M) | 500 | 66.2 | 56.8 | 9.4 |
| 550 | 66.8 | 57.3 | 9.5 | |
| 600 | 67.5 | 57.9 | 9.6 | |
| VO2(M) | 250 | 47.6 | 41.0 | 6.6 |
| Nanoaggregates | 300 | 60.6 | 51.2 | 9.4 |
| 350 | 67.8 | 58.0 | 9.8 | |
| Ref. 24 | 300 | 50.5 | 40.3 | 10.2 |
| Ref. 42 | 230–300 | 67.2 | 60.1 | 7.1 |
| VO2@TiO2 core/shell nanocomposites43 | 65.5 | 42.0 | 23.5 |
Fig. 10 shows the DSC curves of the VO2(M) aggregates calcined at temperatures of 250, 300 and 350 °C in vacuum. We found that the Tc showed a monotonous increase from 47.6 °C to 67.8 °C during the heating cycle and from 41.0 °C to 58.0 °C during the cooling cycle, while the thermal hysteresis width calculated from the DSC curves was also increased from 6.6 °C to 9.8 °C. It could be seen that the lowest phase transition was as low as 41.0 °C, which is much lower than that of 68 °C for bulk VO2 and some nanoparticles reported in the literature.42,43 The VO2(M) nanoaggregates showed a similar tendency with regard to Tc and hysteresis width. It was worth noting that the calcining temperature was as low as 250 °C. Thus, this is an economical way to synthesize VO2(M) on a large scale. The VO2(M) nanoaggregates exhibited a Tc (about 41.0 °C) and low hysteresis width (6.6 °C), which are the desired features for smart window application. These results showed that a higher calcining temperature would result in a higher Tc and a wide hysteresis width of VO2(M). The lower the phase transition temperature, the narrower the hysteresis width, which is in agreement with Li's work.23,24 The change tendency of Tc and hysteresis width was different from the results in Lopez's work,44 in which bigger nanoparticles would lead to higher Tc and a narrower hysteresis width because of the reduced number of defects. However, in this work, an nonconformity phenomenon was observed that the growth trend in the Tc during the heating process was accompanied by an increase in the hysteresis width. The decrease of Tc could be ascribed to a series of factors45 including defects,23 doping,46 size effect,47 stress48 and non-stoichiometry.49 We ascribed this discrepancy to the competition between size and interfacial defects, which jointly determined the Tc and hysteresis width. The latent heat of the phase transition of the VO2(M) nanoaggregates obtained at low calcining temperature (250 °C) was quite small (2.375 J g−1), which indicated the poor crystallinity of the VO2(M) nanoaggregates involving a large quantity of defects (such as oxygen vacancies and dislocations). These defects acted as nucleation sites for the heterogeneous phase transition and were of benefit for triggering the phase transformation from VO2(M) to VO2(R), which leads to the decrease of Tc. However, the effect of size was more apparent than that of interfacial defects at a higher calcining temperature, which resulted in a larger hysteresis and a higher Tc of VO2(M).
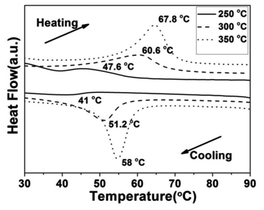 | ||
| Fig. 10 DSC curves of the VO2(M) nanoaggregates transformed from the VO2(D) phase at different calcining temperatures (—: 250 °C, --: 300 °C, ⋯: 350 °C) in a vacuum (solid content = 2.8 wt%). | ||
Conclusions
In summary, VO2(D) nanostructures with a variety of morphologies were successfully synthesized through a simple and scalable hydrothermal method. The reaction temperature, time and the solid content played key roles in determining the crystal structure of VO2 nanostructures. Combined with ex situ and in situ characterization, we propose a mechanism that the VO2(B) phase was formed first at the initial stage of hydrothermal crystallization, while the VO2(D) phase was obtained at a much higher temperature or longer reaction time. A growth mechanism of self-assembly and Ostwald ripening was proposed to illustrate the formation of the cucumber-like or walnut-like VO2(D) and nanoaggregates. Importantly, the D phase of VO2 could be converted to the M phase by calcination treatment without changing its morphology. The thermal hysteresis width of the obtained VO2(M) was no more than 10 °C, which is obviously lower than most reported vanadium dioxide materials. The VO2(M) nanoaggregates can be obtained easily at a very low calcining temperature of only 250 °C. The obtained VO2(M) has a low phase transformation temperature (about 41.0 °C) and a low hysteresis width (6.6 °C) making it a suitable candidate for smart windows.Acknowledgements
The authors are grateful for the financial support from the National Natural Science Foundation of China (51325203), the Ministry of Science and Technology of China (2014AA032802), the Science and Technology Commission of Shanghai Municipality (15XD1501700 and 13521102100), the Materials Genome Institute of Shanghai University (14DZ2261200). We also acknowledge the Australian Synchrotron for the beam time award, from which we conducted an early in situ XRD experiment.Notes and references
- F. J. Morin, Phys. Rev. Lett., 1959, 3, 34 CrossRef CAS.
- Y. Oka, T. Yao, S. Sato and N. Yamamoto, J. Solid State Chem., 1998, 140, 219 CrossRef CAS.
- C. Leroux, G. Nihoul and G. V. Tendeloo, Phys. Rev. B: Condens. Matter, 1998, 57, 5111 CrossRef CAS.
- D. Hagrman, J. Zubieta, C. J. Warren, L. M. Meyer, M. M. J. Treacy and R. C. Haushalter, J. Solid State Chem., 1998, 138, 178 CrossRef CAS.
- B. Y. Qu, L. Liu, Y. Xie and B. C. Pan, Phys. Lett. A, 2011, 375, 3474 CrossRef CAS.
- I. Balberg and S. Trokman, J. Appl. Phys., 1975, 46, 2111–2119 CrossRef CAS.
- C. B. Greenberg, Thin Solid Films, 1994, 251, 81 CrossRef CAS.
- M. F. Becker, A. B. Buckman, R. W. Walser, T. Lepine, P. Georges and A. Brun, Appl. Phys. Lett., 1994, 65, 1507 CrossRef CAS.
- Y. F. Gao, H. J. Luo, Z. T. Zhang, L. T. Kang, Z. Chen, J. Du, M. Kanehira and C. X. Cao, Nano Energy, 2012, 1, 221 CrossRef CAS.
- Y. F. Gao, S. B. Wang, H. J. Luo, L. Dai, C. X. Cao, Y. L. Liu, Z. Chen and M. Kanehira, Energy Environ. Sci., 2012, 5, 6104 CAS.
- N. Shen, B. Dong, C. Cao, Z. Chen, H. J. Luo and Y. F. Gao, RSC Adv., 2015, 5, 108015 RSC.
- R. M. Wentzcovitch, W. W. Schulz and P. B. Allen, Phys. Rev. Lett., 1994, 72, 3389 CrossRef CAS PubMed.
- Z. Chen, Y. F. Gao, L. T. Kang, C. X. Cao, S. Chen and H. J. Luo, J. Mater. Chem. A, 2014, 2, 2718 CAS.
- J. M. Booth and P. S. Casey, ACS Appl. Mater. Interfaces, 2009, 1, 1899 CAS.
- Z. D. Lu, C. G. Li and Y. D. Yin, J. Mater. Chem., 2011, 21, 14766 RSC.
- Y. Y. Luo, L. Q. Zhu, Y. X. Zhang, S. S. Pan, S. C. Xu, M. Liu and G. H. Li, J. Appl. Phys., 2013, 113, 183520 CrossRef.
- C. J. Patridge, L. Whittaker, B. Rave and S. Banerjee, J. Phys. Chem. C, 2012, 116, 3728 CAS.
- X. D. Xiao, H. Zhang, G. Q. Chai, Y. M. Sun, T. Yang, H. L. Cheng, L. H. Chen, L. Miao and G. Xu, Mater. Res. Bull., 2014, 51, 6 CrossRef CAS.
- C. X. Cao, Y. F. Gao and H. J. Luo, J. Phys. Chem. C, 2008, 112, 18810 CAS.
- S. R. Popuri, M. Miclau, A. Artemenko, C. Labrugere, A. Villesuzanne and M. Pollet, Inorg. Chem., 2013, 52, 4780 CrossRef CAS PubMed.
- S. A. Corr, M. Grossman, Y. Shi, K. R. Heier, G. D. Stucky and R. Seshadri, J. Mater. Chem., 2009, 19, 4362 RSC.
- Y. F. Zhang, M. J. Fan, X. H. Liu, G. Y. Xie, H. B. Li and C. Huang, Solid State Commun., 2012, 152, 253 CrossRef CAS.
- M. Li, X. Wu, L. Li, Y. X. Wang, D. B. Li, J. Pan, S. J. Li, L. T. Sun and G. H. Li, J. Mater. Chem. A, 2014, 2, 4520 CAS.
- L. Zhong, M. Li, H. Wang, Y. Y. Luo, J. Pan and G. H. Li, CrystEngComm, 2015, 17, 5614 RSC.
- J. Ni, W. T. Jiang, K. Yu, Y. F. Gao and Z. Q. Zhu, Electrochim. Acta, 2011, 56, 2122 CrossRef CAS.
- S. T. Li, Y. M. Li, M. Jiang, S. D. Ji, H. J. Luo, Y. F. Gao and P. Jin, ACS Appl. Mater. Interfaces, 2013, 5, 6453 CAS.
- M. J. Powell, P. Marchand, C. J. Denis, J. C. Bear, J. A. Darr and I. P. Parkin, Nanoscale, 2015, 7, 18686 RSC.
- J. Chu, Z. Z. Kong, D. Y. Lu, W. L. Zhang, X. S. Wang, Y. F. Yu, S. Li, X. Q. Wang, S. X. Xiong and J. Ma, Mater. Lett., 2016, 166, 179 CrossRef CAS.
- J. C. Song, F. Xia, M. Zhao, Y. L. Zhong, W. Li, K. P. Loh, R. A. Caruso and Q. L. Bao, Chem. Mater., 2015, 27, 3471 CrossRef CAS.
- F. Xia, D. H. Chen, N. V. Y. Scarlett, L. C. Madseen, D. Lau, M. Leoni, J. Llavsky, H. E. A. Brand and R. A. Caruso, Chem. Mater., 2014, 26, 4563 CrossRef CAS.
- W. Li, D. H. Chen, F. Xia, J. Z. Y. Tan, J. C. Song, W. G. Song and R. A. Caruso, Chem. Commun., 2016, 52, 4481 RSC.
- W. Li, F. Xia, J. Qu, P. Li, D. Chen, Z. Chen, Y. Yu, Y. Lu, R. A. Caruso and W. G. Song, Nano Res., 2014, 7, 903 CrossRef CAS.
- J. C. Song, J. Yuan, F. Xia, J. Y. Liu, Y. P. Zhang, Y. L. Zhong, J. L. Zheng, Y. Liu, S. J. Li, M. Zhao, Z. M. Tian, R. A. Caruso, K. P. Loh and Q. L. Bao, Adv. Electron. Mater., 2016, 2, 1600077 Search PubMed.
- L. M. Zhang, F. Xia, Z. D. Song, N. A. S. Webster, H. J. Luo and Y. F. Gao, RSC Adv., 2015, 5, 61371 RSC.
- L. M. Zhang, F. Xia, Z. D. Song, N. A. S. Webster, J. C. Song, H. J. Luo and Y. F. Gao, Inorg. Chem. Front., 2016, 3, 117 RSC.
- X. H. Cheng, H. F. Xu, Z. Z. Wang, K. R. Zhu, G. Li and S. W. Jin, Mater. Res. Bull., 2013, 48, 3383 CrossRef CAS.
- C. J. Niu, J. S. Meng, C. Han, K. N. Zhao, M. Y. Yan and L. Q. Mai, Nano Lett., 2014, 14, 2873 CrossRef CAS PubMed.
- D. N. Sathyanarayana and C. C. Patel, Bull. Chem. Soc. Jpn., 1964, 37, 1736 CrossRef.
- D. N. Sathyanarayana and C. C. Patel, Bull. Chem. Soc. Jpn., 1967, 40, 794 CrossRef CAS.
- M. Li, D. B. Li, J. Pan, J. C. Lin and G. H. Li, Eur. J. Inorg. Chem., 2013, 1207 CrossRef CAS.
- S. D. Zhang, Y. M. Li, C. Z. Wu, F. Zheng and Y. Xie, J. Phys. Chem. C, 2009, 113, 15058 CAS.
- B. R. Dong, N. Shen, C. X. Cao, Z. Chen, H. J. Luo and Y. F. Gao, CrystEngComm, 2016, 18, 558 RSC.
- Y. M. Li, S. D. Ji, Y. F. Gao, H. J. Luo and P. Jin, ACS Appl. Mater. Interfaces, 2013, 5, 6603 CAS.
- R. Lopez, T. E. Haynes, L. A. Boatner, L. C. Feldman and R. F. Haglund, J. Appl. Phys., 2002, 92, 4031 CrossRef CAS.
- S. D. Ji, F. Zhang and P. Jin, J. Solid State Chem., 2011, 184, 2285 CrossRef CAS.
- J. Du, Y. F. Gao, H. J. Luo, L. T. Kang, Z. T. Zhang, Z. Chen and C. X. Cao, Sol. Energy Mater. Sol. Cells, 2011, 95, 469 CrossRef CAS.
- K. Appavoo and R. F. Haglund, Nano Lett., 2011, 11, 1025 CrossRef CAS PubMed.
- H. Guo, K. Chen, Y. Oh, K. Wang, C. Dejoie, S. A. S. Asif, O. L. Warren, Z. W. Shan, J. Wu and A. M. Minor, Nano Lett., 2011, 11, 3207 CrossRef CAS PubMed.
- J. Jeong, N. Aetukuri, T. Graf, T. D. Schladt, M. G. Samant and S. S. P. Parkin, Science, 2013, 339, 1402 CrossRef CAS PubMed.
Footnote |
| † Electronic supplementary information (ESI) available: Table S1, PXRD patterns and SEM images of the products obtained at 200 °C with a solid content of 5.1 wt%. See DOI: 10.1039/c6qi00102e |
| This journal is © the Partner Organisations 2016 |

