β-NaYF4:Yb,Tm: upconversion properties by controlling the transition probabilities at the same energy level†
Min
Li
a,
Xiaoyang
Liu
a,
Li
Liu
b,
Bing
Ma
a,
Benxian
Li
a,
Xudong
Zhao
a,
Wenming
Tong
a and
Xiaofeng
Wang
*a
aState Key Laboratory of Inorganic Synthesis and Preparative Chemistry, Jilin University, Changchun 130012, China. E-mail: wangxf103@jlu.edu.cn; Fax: +86-431-85168601; Tel: +86-431-85168601
bDepartment of Chemistry, Northeast Normal University, Changchun 130024, China
First published on 14th June 2016
Abstract
A series of Yb3+/Tm3+ co-doped β-NaYF4 (β-NaYF4:Yb,Tm) crystals have been successfully synthesized via the molten salt synthesis (MSS) method. A unique strong green emission of Tm3+ was observed, which cannot be obtained by any other method. The red, green and blue (RGB) light emissions have been obtained simultaneously in the presence of a single activator (Tm3+). The influencing factors of crystal growth have been studied in detail, in order to understand the change of the transition probabilities of Tm3+. Subsequent studies indicate that the RGB light emissions of Tm3+ can be effectively tuned by varying the concentration of sensitizers (Yb3+ and Mn2+) and the reaction time. Consequently, the effective multicolor upconversion (UC) luminescence was obtained, especially a strong white light, which was not obtained in the β-NaYF4:Yb,Tm system earlier. To our knowledge, it is the first time that the UC properties in the β-NaYF4:Yb,Tm system have been investigated by altering the transition probabilities at the same energy level of Tm3+.
1. Introduction
Rare-earth element (REE) doped materials with upconversion (UC) luminescence have been the focus of materials research owing to their applications in solid-state blue-green lasers, three-dimensional color displays, solar cells, and fluorescent bio-labels.1–4 In particular, RE3+-doped materials that are capable of white-light UC emission have attracted enormous attention.5–11 Many efforts have been made to obtain white-light UC emission with a high color rendering index by mixing three monochromatic light sources red, green and blue (RGB).12–15 NaYF4 with a hexagonal structure is one of the most efficient host materials with UC luminescence due to the relatively low lattice phonon energy.16–21 Meanwhile, in the RE3+-doped UC luminescent materials, Tm3+ is generally considered to be one of the most efficient RE3+ for obtaining laser emission, frequency UC luminescence, as well as to be used in optical amplifiers.22Recently, research has been focused on the development of different methods for the design and fabrication of materials with multicolor UC luminescence, especially white-light UC emission. One commonly used method of tuning UC luminescence is to control the type and concentration of the doping ions, or the range of pump power. For example, Zhao et al. significantly enhanced the UC luminescence of nanocrystals by increasing the activator (Tm3+) concentration, in combination with elevation of irradiance excitation in Yb3+/Tm3+ co-doped NaYF4 nanocrystals.23 Garry Glaspell et al. obtained RGB and white light emission by adjusting the concentrations of the RE3+ (Yb3+, Er3+, Ho3+, and Tm3+) in the Y2O3 nanocrystals.24 Yang et al. adjusted the UC color by controlling the range of pump power.25 However, there is almost no reference mentioned about the green light emission (1D2 → 3H5, 550 nm) of Tm3+ and controlling of the transition probabilities of the 1D2 level.25–34 Notably, in our past research,35 the 1D2 level transitions of Tm3+ are changed greatly in the Yb3+/Tm3+ co-doped KMnF3 system. Accordingly, the transition probability ratio of 1D2 → 3F4 (450 nm, blue) to 1D2 → 3H5 (550 nm, green) at the same 1D2 level exhibited a significant change. As a result, a strong green emission was firstly observed, which originated from the excitation of the activator (Tm3+). In the previous reports, UC luminescence has been widely studied and applied. The UC luminescence system of doping Yb3+/Tm3+ is mainly limited to the ternary doped systems, such as Yb3+/Er3+/Tm3+![[thin space (1/6-em)]](https://www.rsc.org/images/entities/char_2009.gif) 36 or Yb3+/Ho3+/Tm3+
36 or Yb3+/Ho3+/Tm3+![[thin space (1/6-em)]](https://www.rsc.org/images/entities/char_2009.gif) 25 systems. No simultaneous generation of red, green and blue emissions was demonstrated with a single activator.37–41 Few investigations have focused on single activator ions.
25 systems. No simultaneous generation of red, green and blue emissions was demonstrated with a single activator.37–41 Few investigations have focused on single activator ions.
To our knowledge, the research of Tm3+ with green UC emission, which is an important and necessary supplement to the NIR to visible light UC materials, is still not sufficient compared with the more frequently studied Er3+. In general, multicolor UC luminescence is observed in the tri-doped Yb3+, Tm3+, and Er3+ system, which consists of blue (1D2 → 3F4, 1G4 → 3H6 of Tm3+), green (2H11/2/4S3/2 → 4I15/2 of Er3+), and red (4F9/2 → 4I15/2 of Er3+, 1G4 → 3F4 of Tm3+) UC emissions. In fact, green light emission (1D2 → 3H5) can also be produced by the energy level transition of Tm3+, despite that it is weak or not detectable due to the low transition probabilities. Assumpção et al. observed a faint green emission (1D2 → 3H5 of Tm3+) after the figure of UC emission spectra was magnified 4200 times.42 Poirier et al. have presented that the transition probability ratio of blue emission (1D2 → 3F4, 450 nm) to green emission (1D2 → 3H5, 550) is 22![[thin space (1/6-em)]](https://www.rsc.org/images/entities/char_2009.gif) 357.96
357.96![[thin space (1/6-em)]](https://www.rsc.org/images/entities/char_2009.gif) :
:![[thin space (1/6-em)]](https://www.rsc.org/images/entities/char_2009.gif) 98.48 by theoretical calculations.22 Our group acquired a strong green emission (1D2 → 3H5, 550 nm) of Tm3+ from the Yb3+/Tm3+ co-doped KMnF3, which resulted in the RGB light emissions being obtained simultaneously in the presence of a single activator (Tm3+).35 Consequently, it is possible to realize multicolor UC luminescence by controlling the intensities and ratios of the RGB light emissions output from a single activator (Tm3+) in the Yb3+/Tm3+ co-doped fluoride system.
98.48 by theoretical calculations.22 Our group acquired a strong green emission (1D2 → 3H5, 550 nm) of Tm3+ from the Yb3+/Tm3+ co-doped KMnF3, which resulted in the RGB light emissions being obtained simultaneously in the presence of a single activator (Tm3+).35 Consequently, it is possible to realize multicolor UC luminescence by controlling the intensities and ratios of the RGB light emissions output from a single activator (Tm3+) in the Yb3+/Tm3+ co-doped fluoride system.
In this paper, a series of Yb3+/Tm3+ co-doped β-NaYF4 (β-NaYF4:Yb,Tm) crystals have been synthesized by utilizing the MSS method. The reaction factors (the concentration of the doping ions, the reaction time, and the pump power) have been investigated in detail, in order to understand the impact of these factors on the UC luminescence properties in this system. The research results showed that the RGB light emissions were simultaneously obtained with a single activator (Tm3+) in our work. It not only simplifies the production process and reduces production costs, but also provides a new method for adjustable UC luminescence. It is noteworthy that the outer electron level of Tm3+ can be changed by the MSS system, which resulted in the transition probabilities at the same energy level that can be changed by controlling some reaction factors mentioned above, which makes it possible to obtain multicolor UC luminescence (including white UC luminescence). In other words, it is the first time that the UC properties in the β-NaYF4:Yb,Tm system have been investigated by controlling the transition probabilities at the same energy level.
2. Materials and methods
2.1 Chemicals and materials
All reagents were purchased and directly used without further purification. NaCl (A.R., 99.5%), MnCl2·4H2O (A.R., 99.0%), and NH4HF2 (A.R., 98.0%) were purchased from Sinopharm Chemical Reagent Co., Ltd (China). Yb(NO3)3·5H2O (A.R., 99.9%), Tm(NO3)3·6H2O (A.R., 99.99%), and YN3O9·6H2O (A.R., 99.5%) were purchased from Aladdin Industrial Corporation.2.2 Preparation
The typical synthesis of Yb3+,Tm3+ co-doped β-NaYF4via the MSS method can be described as follows: NaCl, NH4HF2, YN3O9·6H2O, Yb(NO3)3·5H2O, and Tm(NO3)3·6H2O were added into a closed Teflon-lined stainless steel autoclave with 50.0 mL capacity with a molar ratio of 1![[thin space (1/6-em)]](https://www.rsc.org/images/entities/char_2009.gif) :
:![[thin space (1/6-em)]](https://www.rsc.org/images/entities/char_2009.gif) 10
10![[thin space (1/6-em)]](https://www.rsc.org/images/entities/char_2009.gif) :
:![[thin space (1/6-em)]](https://www.rsc.org/images/entities/char_2009.gif) x
x![[thin space (1/6-em)]](https://www.rsc.org/images/entities/char_2009.gif) :
:![[thin space (1/6-em)]](https://www.rsc.org/images/entities/char_2009.gif) y
y![[thin space (1/6-em)]](https://www.rsc.org/images/entities/char_2009.gif) :
:![[thin space (1/6-em)]](https://www.rsc.org/images/entities/char_2009.gif) 0.5% (x + y = 99.5%), and maintained at 180 °C for 24 h. After cooling down to room temperature naturally, the resulting products were washed with deionized water several times and dried at 60 °C for 12 h.
0.5% (x + y = 99.5%), and maintained at 180 °C for 24 h. After cooling down to room temperature naturally, the resulting products were washed with deionized water several times and dried at 60 °C for 12 h.
2.3 Characterization
All the samples were characterized by powder X-ray diffraction (XRD, Cu Kα radiation, Rigaku D/max 2550VB, Japan) with a scanning rate of 8° min−1 within the 2θ range of 10° to 80°. The morphology and particle size of the samples were determined by scanning electron microscopy (SEM, JSM-6700F, JEOL, Japan). The upconversion emission spectra were recorded with an Edinburgh Instruments FLS920 spectrophotometer from 300 to 900 nm with an external 0–600 mW adjustable continuous-wave 980 nm laser as the excitation source. All the measurements were performed at room temperature.3. Results and discussion
3.1 Phase and morphology
The crystalline structures of the as-synthesized products were identified by powder X-ray diffraction (XRD). Fig. S1† shows the XRD patterns of the as-synthesized NaYF4 samples, as well as the standard XRD data of the pure hexagonal NaYF4 phase as a reference. All the diffraction peaks can be well indexed in the hexagonal phase of NaYF4 (JCPDS no. 16-0334), indicating the high purity of the as-synthesized products.The scanning electron microscopy (SEM) image of the β-NaYF4:10% Yb,0.5% Tm samples prepared at 180 °C for 24 h is exhibited in Fig. S2,† in which the resulting crystals are clearly hexagonal prisms.
3.2 UC luminescence properties
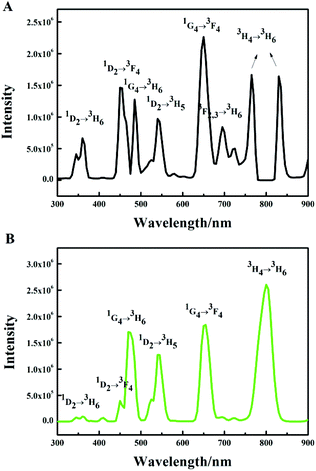
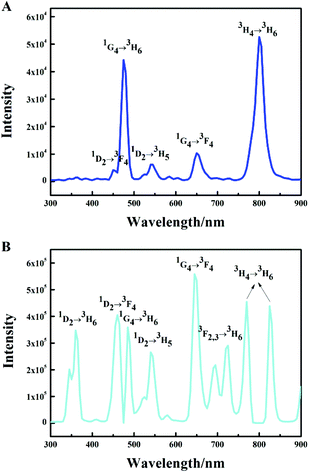
The UC emission spectrum of the β-NaYF4:10% Yb,0.5% Tm crystals prepared at 180 °C for 24 h is shown in Fig. 1A. The spectrum was divided into three groups according to the initial Tm3+ levels: the 3F2,3 and 3H4 groups (two photon transition group), with 700 nm, 750 nm and 800 nm peaks, the 1G4 group (three photon transition group), with 475 nm and 650 nm peaks, and the 1D2 group (four photon transition group), with peaks at 360 nm, 450 nm and 550 nm. Notably, we observed a prominent band at 550 nm (1D2 → 3H5) in Fig. 1A. The RGB light emissions can be obtained simultaneously by a single activator in the Yb3+/Tm3+ co-doped NaYF4 system, which are the red light emission (1G4 → 3F4, 650 nm), green light emission (1D2 → 3H5, 550 nm) and blue light emission (1D2 → 3F4, 450 nm, 1G4 → 3H6, 475 nm). A similar phenomenon can be observed in the Yb3+/Tm3+ co-doped KMnF3 system reported recently by our group, which has never been reported before.43,44Subsequently, various reaction factors (the concentration of the doping ions, the reaction time, and the pump power) were studied in detail, in order to understand the influence of these factors on the UC luminescence properties of the β-NaYF4:Yb,Tm system. Here, we mainly studied the influence of the reaction factors on the transitions at the same energy level, which has been seldom studied earlier.
The emission intensity diagrams of the β-NaYF4:xYb,0.5% Tm samples with different concentrations of Yb3+ are shown in Fig. 2. A slight change of the overall integrated emission intensities (Fig. 2A) and the integrated intensities of two photon transition (Fig. 2B) with increasing the Yb3+ concentration was observed. The emission intensities of different transitions in the 1G4 group are shown in Fig. 2C. The emission intensity ratios between the 1G4 → 3H6 and 1G4 → 3F4 transitions remained the same while the concentration of Yb3+ increased from 10% to 70%. The blue emissions (1G4 → 3H6, 475 nm) were significantly enhanced at the Yb3+ concentration of 5% and 99.5%, which indicated that the three photon transition group was enhanced. As shown in Fig. 1B and 2D, the green emission (1D2 → 3H5, 550 nm) was extremely strong, whereas the ultraviolet emissions (1D2 → 3H6, 350 nm) and blue emission (1D2 → 3F4, 450 nm) were very weak when the concentration of Yb3+ was 5%, the intensity ratio of the blue emission (1D2 → 3F4, 450 nm) and green emission (1D2 → 3H5, 550 nm) is approximately 1![[thin space (1/6-em)]](https://www.rsc.org/images/entities/char_2009.gif) :
:![[thin space (1/6-em)]](https://www.rsc.org/images/entities/char_2009.gif) 9. The intensity ratio of the emission peaks at 450 nm to 550 nm was close to 3
9. The intensity ratio of the emission peaks at 450 nm to 550 nm was close to 3![[thin space (1/6-em)]](https://www.rsc.org/images/entities/char_2009.gif) :
:![[thin space (1/6-em)]](https://www.rsc.org/images/entities/char_2009.gif) 2 while the concentration of Yb3+ was in the range of 10% to 99.5%, despite that their intensities are both decreased significantly at the Yb3+ concentration of 99.5%, which could be due to the weakened four photon transition. The results of the experiments showed that the outer electron energy levels of Tm3+ must be affected by the MSS method. The blue emission (1D2 → 3F4, 450 nm) was suppressed and replaced by the green emission (1D2 → 3H5, 550 nm). This inhibition of the blue emission (1D2 → 3F4, 450 nm) was weakened by the doped Yb3+. The inhibition could only be fully realized with the low concentration of Yb3+ (5%), and cannot be eliminated even in the NaYbF4 (Yb3+ 99.5%):Tm sample.
2 while the concentration of Yb3+ was in the range of 10% to 99.5%, despite that their intensities are both decreased significantly at the Yb3+ concentration of 99.5%, which could be due to the weakened four photon transition. The results of the experiments showed that the outer electron energy levels of Tm3+ must be affected by the MSS method. The blue emission (1D2 → 3F4, 450 nm) was suppressed and replaced by the green emission (1D2 → 3H5, 550 nm). This inhibition of the blue emission (1D2 → 3F4, 450 nm) was weakened by the doped Yb3+. The inhibition could only be fully realized with the low concentration of Yb3+ (5%), and cannot be eliminated even in the NaYbF4 (Yb3+ 99.5%):Tm sample.
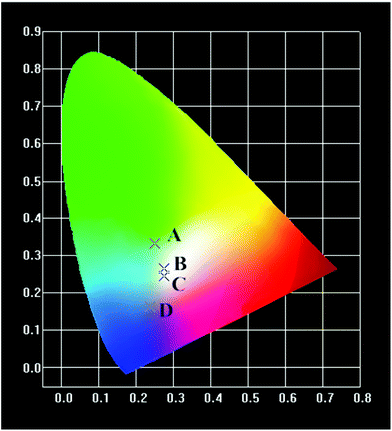
All the UC emission spectra of the β-NaYF4:xYb,0.5% Tm samples prepared with different concentrations of Yb3+ can be readily converted to the CIE-1931 chromaticity diagrams, as plotted in Fig. 3. The corresponding chromaticity coordinates of the samples were calculated based on the emission spectra, which were (0.249, 0.3313), (0.2745, 0.2659), (0.2738, 0.246) and (0.2369, 0.1625), respectively. As shown in the chromaticity diagrams, the color tone of the samples gradually shifted from green to blue whitish, and blue with the increasing concentration of Yb3+.
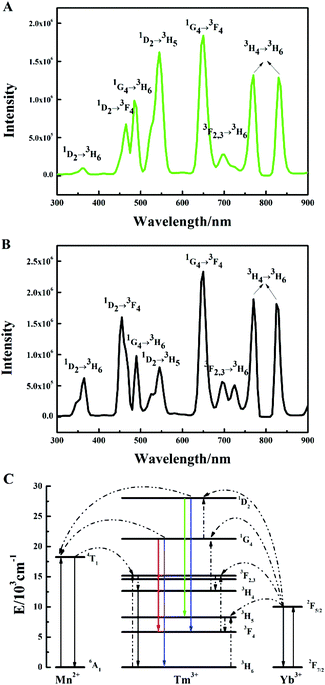
The emission intensity diagrams of the β-NaYF4:10% Yb,xMn,0.5% Tm samples with different concentrations of Mn2+ are shown in Fig. 4. The emission intensities of the overall integrated transitions (Fig. 4A), the two photon transition (Fig. 4B), and the three photon transition in the 1G4 group (Fig. 4C) all underwent slight changes with increasing Mn2+ concentrations. Also, Mn2+ had a great influence on the four photon transition, as exhibited in Fig. 4D. In particular, the green emission (1D2 → 3H5, 550 nm) was significantly enhanced when the concentration of Mn2+ is 0.5%, whereas the ultraviolet emissions (1D2 → 3H6, 350 nm) and the blue emission (1D2 → 3F4, 450 nm) seemed weak. The enhancement of green emission was also further confirmed by the UC emission spectrum (Fig. 5A), which was quite different from the spectrum of the β-NaYF4:10% Yb,0.5% Tm samples (Fig. 1A). In general, the emission intensity ratio of the 1D2 → 3H5 to 1D2 → 3F4 transition gradually decreased with increasing Mn2+ concentrations. The spectrum (Fig. 5B) indicated that the effect of Mn2+ disappeared when the concentration of Mn2+ reached 8.0%, which was nearly the same with the spectrum without doping Mn2+ (Fig. 1A). The results of the experiments showed that a small amount of Mn2+ (0.5%) can be doped in the position of Y3+,45 so as to promote the change of the outer electron energy levels of Tm3+. At the same concentration of 10% Yb3+, the blue emission (1D2 → 3F4, 450 nm) was totally suppressed. With the increase of Mn2+ concentration, the doping of Mn2+ gradually destroyed the order in the crystal structure, and the fluorescence was basically not changed with or without 8.0% Mn2+ in the β-NaYF4:10% Yb,0.5% Tm samples.
The results indicated that a small amount of Mn2+ could promote the green light emission. It suggested that the order of the crystal was destroyed, which transformed to the regular arrangement with increasing Mn2+ concentration. Meanwhile, the blue and green light emissions were slightly adjusted by the remaining transfer function of Mn2+.
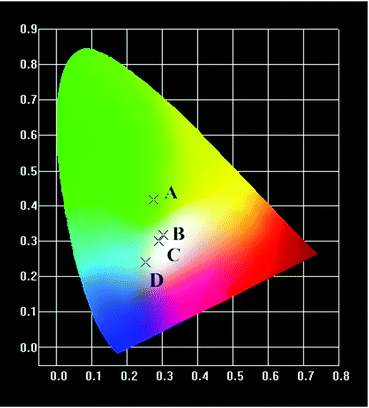
All the UC emission spectra of the β-NaYF4:10% Yb,xMn,0.5% Tm samples prepared with different concentrations of Mn2+ can be readily converted to the CIE-1931 chromaticity diagrams, as shown in Fig. 6. The corresponding chromaticity coordinates of samples were calculated based on the emission spectra, which were (0.2748, 0.4187), (0.3032, 0.3181), (0.2902, 0.301) and (0.2532, 0.2396), respectively. As shown in the chromaticity diagrams, the color tone of the samples gradually shifted from green to white, and ultimately to blue with the increasing concentration of Mn2+.
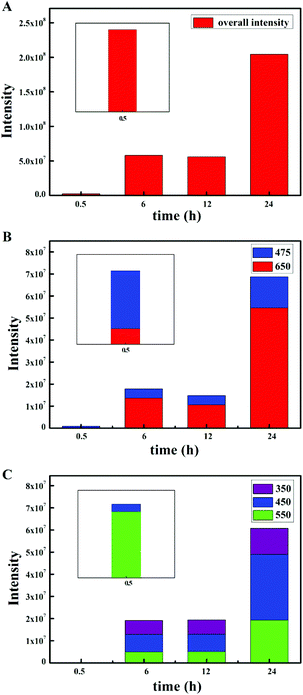
The emission intensity diagrams of the β-NaYF4:10% Yb,0.5% Tm samples prepared with different reaction times are shown in Fig. 8. The overall integrated emission intensity gradually increased with the extension of reaction time (Fig. 8A), which was due to the increase of the crystal size and the crystallinity. In particular, when the reaction time was 0.5 h, the transition possibility at the same level changed, and the transition probability ratio of 1D2 → 3H5 (550 nm) to 1D2 → 3F4 (450 nm) increased significantly, as illustrated in Fig. 8B and C. Although the overall integrated emission intensity was fairly low at 0.5 h, the transition intensities of 1G4 → 3H6 (475 nm) and 1D2 → 3H5 (550 nm) were specifically enhanced in the 1G4 and 1D2 groups respectively. The results of the experiments showed that a shorter reaction time, and a lower crystallization degree, is more conducive to changing the outer electron energy levels of Tm3+, thereby the blue emission (1D2 → 3F4, 450 nm) was totally suppressed. However, when the reaction time is over 6 hours, the effect was lost with the larger crystal size and the higher crystallization degree. In other words, the small size and low degree of crystallization were more advantageous to generate the green light emission.
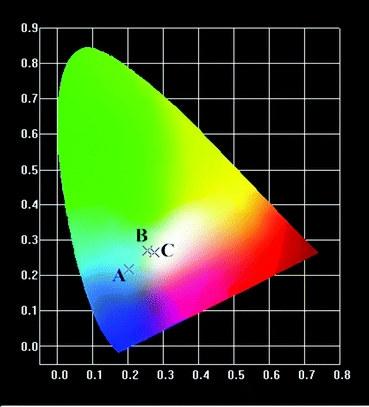
All the UC emission spectra of the β-NaYF4:10% Yb,0.5% Tm samples prepared with different reaction times can be readily converted to the CIE-1931 chromaticity diagrams, as shown in Fig. 9. The corresponding chromaticity coordinates of samples were calculated based on the emission spectra, which were (0.2021, 0.2184), (0.2561, 0.2708) and (0.2745, 0.2659), respectively. As shown in the chromaticity diagrams, the color tone of the samples gradually shifted from blue to blue whitish with the increasing of reaction time.
4. Conclusions
In conclusion, we have successfully synthesized the Yb3+/Tm3+ co-doped β-NaYF4 crystals with the MSS method. The 1D2 level transition of Tm3+ underwent a special change in this system, which resulted in a strong green emission from Tm3+. The influence of reaction factors on the transition probability at the same energy level was studied in detail. Subsequent studies indicated that a small amount of doped ions (Yb3+ and Mn2+) will promote the green light emission of Tm3+, and lose efficacy with higher concentrations. The green light emission of Tm3+ will be more significant by a low degree of crystallization, which has nothing to do with the doping concentration of Tm3+ itself as well as the pump power. In conclusion, the special changes of the 1D2 level transition probability of Tm3+ were investigated and described in detail in the Yb/Tm co-doped fluoride system, following the corresponding characteristics: the RGB light emissions from a single activator (Tm3+), a variety of multicolor adjustment methods, and the absence of the concentration quenching effect. This study not only provided a novel way for the generation of multicolor UC luminescence, but also raised the possibility of constructing high-quality UC luminescent crystals with desirable optical properties beyond the limitation of the nanosize materials.Acknowledgements
This work was supported by the National Sciences Foundation of China (no. 21271082 and 21301066).Notes and references
- F. Auzel, Chem. Rev., 2004, 104, 139–173 CrossRef CAS PubMed
.
- E. Downing, L. Hesselink, J. Ralston and R. M. Macfarlance, Science, 1996, 273, 1185–1189 CrossRef CAS
.
- E. D. Rosa, P. Salas, H. Desirenca, C. Angeles and R. A. Rodríguez, Appl. Phys. Lett., 2005, 87, 241912 CrossRef
.
- F. Van de Rijke, H. Zijlmans, S. Li, T. Vail, A. K. Raap, R. S. Niedbala and H. J. Tanke, Nat. Biotechnol., 2001, 19, 273–276 CrossRef CAS PubMed
.
- S. Sivakumar, J.-C. Boyer, E. Bovero and F. C. J. M. van Veggel, J. Mater. Chem., 2009, 19, 2392–2399 RSC
.
- G. Li, D. Geng, M. Shang, Y. Zhang, C. Peng, Z. Cheng and J. Lin, J. Phys. Chem. C, 2011, 115, 21882–21892 CrossRef CAS
.
- M.-S. Wang, S.-P. Guo, Y. Li, L.-Z. Cai, J.-P. Zou, G. Xu, W.-W. Zhou, F.-K. Zheng and G.-C. Guo, J. Am. Chem. Soc., 2009, 131, 13572–13573 CrossRef CAS PubMed
.
- N. Guo, H. You, Y. Song, M. Yang, K. Liu, Y. Huang and H. Zhang, J. Mater. Chem., 2010, 20, 9061–9067 RSC
.
- K. Zheng, D. Zhang, D. Zhao, N. Liu, F. Shi and W. Qin, Phys. Chem. Chem. Phys., 2010, 12, 7620–7625 RSC
.
- T. Passuello, F. Piccinelli, M. Pedroni, M. Brttinelli, F. Mangiarini, R. Naccache, F. Vetrone, J. A. Capobianco and A. Speghini, Opt. Mater., 2011, 33, 643–646 CrossRef CAS
.
- C. Zhang, P. Ma, C. Li, G. Li, S. Huang, D. Yang, M. Shang, X. Kang and J. Lin, J. Mater. Chem., 2011, 21, 717–723 RSC
.
- C. Zhang, S. Huang, D. Yang, X. Kang, M. Shang, C. Peng and J. Lin, J. Mater. Chem., 2010, 20, 6674–6680 RSC
.
- J. Yang, C. Zhang, C. Peng, C. Li, L. Wang, R. Chai and J. Lin, Chem. – Eur. J., 2009, 15, 4649–4655 CrossRef CAS PubMed
.
- X. Liu, C. Lin and J. Lin, Appl. Phys. Lett., 2007, 90, 081904 CrossRef
.
- J. R. DiMaio, B. Kokuoz and J. Ballato, Opt. Express, 2006, 14, 11412–11417 CrossRef CAS PubMed
.
- N. Niu, P. Yang, F. He, X. Zhang, S. Gai, C. Li and J. Lin, J. Mater. Chem., 2012, 22, 10889–10899 RSC
.
- J.-C. Boyer, F. Vetrone, L. A. Cuccia and J. A. Capobianco, J. Am. Chem. Soc., 2006, 128, 7444–7445 CrossRef CAS PubMed
.
- D. Tu, L. Liu, Q. Ju, Y. Liu, H. Zhu, R. Li and X. Chen, Angew. Chem., Int. Ed., 2011, 50, 6306–6310 CrossRef CAS PubMed
.
- A. Yin, Y. Zhang, L. Sun and C. Yan, Nanoscale, 2010, 2, 953–959 RSC
.
- Y. Wang, Y. Liu, Q. Xiao, H. Zhu, R. Li and X. Chen, Nanoscale, 2011, 3, 3164–3169 RSC
.
- F. Wang and X. Liu, Chem. Soc. Rev., 2009, 38, 976–989 RSC
.
- G. Poirier, V. A. Jerez, C. B. de Araújo, Y. Messaddeq, S. J. L. Ribeiro and M. Poulain, J. Appl. Phys., 2003, 93, 1493–1497 CrossRef CAS
.
- J. Zhao, D. Jin, E. P. Schartner, Y. Lu, Y. Liu, A. V. Zvyagin, L. Zhang, J. M. Dawes, P. Xi, J. A. Piper, E. M. Goldys and T. M. Monro, Nat. Nanotechnol., 2013, 8, 729–734 CrossRef CAS PubMed
.
- G. Glaspell, J. Anderson, J. R. Wilkins and M. S. El-Shall, J. Phys. Chem. C, 2008, 112, 11527–11531 CrossRef CAS
.
- L. W. Yang, H. L. Han, Y. Y. Zhang and J. X. Zhong, J. Phys. Chem. C, 2009, 113, 18995–18999 CrossRef CAS
.
- C.-H. Huang, W.-R. Liu and T.-M. Chen, J. Phys. Chem. C, 2010, 114, 18698–18701 CrossRef CAS
.
- J. Capobianco, J. C. Boyer, F. Vetrone, A. Speghini and M. Bettinelli, Chem. Mater., 2002, 14, 2915–2921 CrossRef CAS
.
- A. Patra, P. Ghosh, P. S. Chowdhury, M. A. R. Alencar, W. Lozano, N. Rakov and G. S. Maciel, J. Phys. Chem. B, 2005, 109, 10142–10146 CrossRef CAS PubMed
.
- G.-S. Yi and G.-M. Chow, J. Mater. Chem., 2005, 15, 4460–4464 RSC
.
- H. Zhang, Y. Li, Y. Lin, Y. Huang and X. Duan, Nanoscale, 2011, 3, 963–966 RSC
.
- K. W. Krämer, D. Biner, G. Frei, H. U. Güdel, M. P. Hehlen and S. R. Lüthi, Chem. Mater., 2004, 16, 1244–1251 CrossRef
.
- F. Wang and X. Liu, J. Am. Chem. Soc., 2008, 130, 5642–5643 CrossRef CAS PubMed
.
- F. Wang, R. Deng, J. Wang, Q. Wang, Y. Han, H. Zhu, X. Chen and X. Liu, Nat. Mater., 2011, 10, 968 CrossRef CAS PubMed
.
- F. Vetrone, V. Mahalingam and J. A. Capobianco, Chem. Mater., 2009, 21, 1847–1851 CrossRef CAS
.
- B. Ma, X. Liu, L. Liu, Y. Meng, B. Li, X. Zhao, P. Pu and X. Wang, RSC Adv., 2014, 4, 63100–63104 RSC
.
- Y. Li, J. Zhang, Y. Luo, X. Zhang, Z. Hao and X. Wang, J. Mater. Chem., 2011, 21, 2895 RSC
.
- B. Shao, Y. Feng, Y. Song, M. Jiao, W. Lü and H. You, Inorg. Chem., 2016, 55, 1912–1919 CrossRef CAS PubMed
.
- D. Li, W. Qin, S. Liu, W. Pei, Z. Wang, P. Zhang, L. Wang and L. Huang, J. Alloys Compd., 2015, 653, 304–309 CrossRef CAS
.
- A. A. Ansari, R. Yadav and S. B. Rai, RSC Adv., 2016, 6, 22074–22082 RSC
.
- L.-L. Li, R. Zhang, L. Yin, K. Zheng, W. Qin, P. R. Selvin and Y. Lu, Angew. Chem., Int. Ed., 2012, 124, 6225–6229 CrossRef
.
- Q. Chen, C. Wang, L. Cheng, W. He, Z. Cheng and Z. Liu, Biomaterials, 2014, 35, 2915–2923 CrossRef CAS PubMed
.
- T. A. A. Assumpção, D. M. da Silva, L. R. P. Kassab and C. B. de Araújo, J. Appl. Phys., 2009, 106, 063522 CrossRef
.
- J.-C. Zhou, Z.-L. Yang, W. Dong, R.-J. Tang, L.-D. Sun and C.-H. Yan, Biomaterials, 2011, 32, 9059–9067 CrossRef CAS PubMed
.
- Y. Wei, F. Lu, X. Zhang and D. Chen, J. Alloys Compd., 2007, 427, 333–340 CrossRef CAS
.
- G. Tian, Z. Gu, L. Zhou, W. Yin, X. Liu, L. Yan, S. Jin, W. Ren, G. Xing, S. Li and Y. Zhao, Adv. Mater., 2012, 24, 1226–1231 CrossRef CAS PubMed
.
Footnote |
| † Electronic supplementary information (ESI) available: XRD, SEM, UC emission spectra and CIE. See DOI: 10.1039/c6qi00121a |
| This journal is © the Partner Organisations 2016 |

