Radical pathways and O2 participation in benzyl alcohol oxidation, and catechol and o-aminophenol oxidase activity studies with novel zinc complexes: an experimental and theoretical investigation†
Ashish Kumar
Dhara
,
Udai P.
Singh
and
Kaushik
Ghosh
*
Department of Chemistry, Indian Institute of Technology Roorkee, Uttrakhand, India. E-mail: ghoshfcy@iitr.ernet.in
First published on 20th September 2016
Abstract
Diphenoxo bridged dinuclear zinc complexes [Zn2(OMe-Phimp)2(Cl)2] (1) (OMe-PhimpH = (E)-4-methoxy-2-((2-phenyl-2-(pyridin-2-yl)hydrazono)methyl)phenol), [Zn2(Me-Phimp)2(Cl)2] (2) (Me-PhimpH = (E)-4-methyl-2-((2-phenyl-2-(pyridin-2-yl)hydrazono)methyl)phenol), [Zn2(N-Phimp)2(Cl)2]·CH3CN (3·CH3CN) (N-PhimpH = (E)-1-((2-phenyl-2-(pyridin-2-yl)hydrazono)methyl)naphthalen-2-ol) and [Zn2(Phimp)2(Cl)2] (4) (PhimpH = (E)-2-((2-phenyl-2-(pyridin-2-yl)hydrazono)methyl)phenol) were synthesized and spectroscopically characterized. The molecular structures of 1 and 3·CH3CN were determined using X-ray crystallography. DFT and TD-DFT calculations were performed to optimize the molecular geometry, interpret the spectroscopic results and investigate the contribution of the ligands to the redox properties of the complexes. Phenoxyl radical complexes were generated in solution via chemical oxidation using ceric ammonium nitrate (CAN) and the redox properties were examined through cyclic voltammetric measurements. All the dinuclear zinc complexes were found to be highly active in catalyzing the oxidation of the primary alcohols 3,5-di-tert-butylcatechol and o-aminophenol. The catalytic activity was found to be in the order of complex 1 > complex 2 > complex 4 > complex 3 for both calechol oxidation and o-aminophenol oxidation. An EPR experiment clearly hinted at the generation of a radical during the oxidation of catechol and o-aminophenol. Reaction models for these processes were proposed and theoretical studies were performed to support the proposed mechanism. ESI-MS spectra clearly indicate the formation of a catalyst–substrate adduct by removal of one Cl− ion.
Introduction
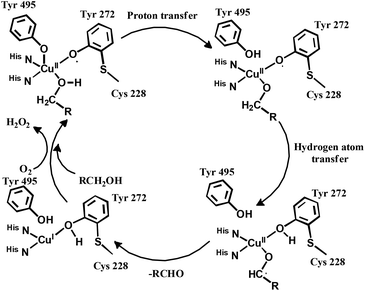
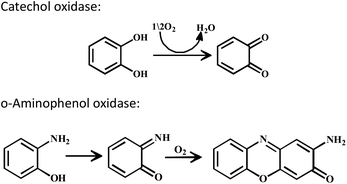
The enzyme galactose oxidase (GO) is responsible for the oxidation of primary alcohols to aldehydes in the presence of molecular oxygen.1 In the metal-site of GO, a type-2 copper centre was found to be coordinated to histidine and tyrosine residues. Investigation of the mechanism of the oxidation of primary alcohols revealed the role of a stable phenoxyl radical in the catalytic cycle.2 A thioether group close to the site of oxyl-radical formation was found to be responsible for the stability of the phenoxyl radical.3,4 Post-translational modification of a cysteine side-chain and tyrosine residue gave rise to a thioether functional group ortho to the site of the phenoxyl radical generation5,6 (Scheme 1). For structural and functional modelling of the GO enzyme, several research groups have generated phenoxyl radical complexes utilising a bulky alkyl group, –OMe group and thioether function in the vicinity of the site for radical generation.7,8,9a,b,10 We have been studying the reactivities of complexes capable of generating a stable phenoxyl radical11,12 and recently reported diphenoxo-bridged dinuclear zinc complexes which afforded stable phenoxyl radical generation at room-temperature.12 Oxidative nuclease activity was examined during regeneration of the diphenoxo-bridged zinc complexes from the corresponding phenoxyl radical complexes.12Three important features of the reported complexes prompted us to perform the present study. First, these complexes could generate a stable phenoxyl radical (at room temperature) even though no substituent group was present on the phenyl ring containing the phenolato function. Second, the crystal structure of these complexes revealed a cis-arrangement of the ligand as well as chloride ions along the Zn–Zn axis, which could allow ligation of a bidentate ligand. The third important feature is the redox activity possessed by these complexes. Knowing the stability of the generated phenoxyl radical in these complexes, alcohol oxidation was investigated for functional mimicking of the GO enzyme.9b,c On the other hand, we were interested in studying the interactions of catechol (substrate for catecholase activity studies) and o-aminophenol (substrate for phenoxazinone synthase activity studies) with our complexes. Catechol oxidase is an enzyme with a type-3 active site that catalyzes the oxidation of catechols to the corresponding o-quinones with reduction of O2 to H2O.13–20 On the other hand, o-aminophenol oxidase is also a copper containing enzyme,21 which is responsible for the synthesis of actinomycin. Although –NH2 and –OH are two isoelectronic functional groups, investigation of the mechanisms clearly indicated a completely different fate of the two substrates via oxidation chemistry (shown in Scheme 2).
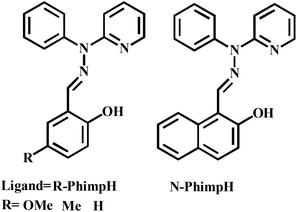
Investigation of the literature clearly exposed that there are very few reports22,23 on the catecholase activity of phenoxo-bridged dinuclear zinc complexes. To the best of our knowledge, systematic studies on catecholase-like processes as well as o-aminophenol oxidation with zinc complexes capable of generating a stable phenoxyl radical complex have not been reported in the literature. Herein, we report the synthesis and characterization of four zinc(II) complexes [Zn2(OMe-Phimp)2(Cl)2] (1), [Zn2(Me-Phimp)2(Cl)2] (2), [Zn2(N-Phimp)2(Cl)2]·CH3CN (3·CH3CN), and [Zn2(Phimp)2(Cl)2] (4) derived from the ligands OMe-PhimpH, Me-PhimpH, N-PhimpH and PhimpH respectively (shown in Scheme 3).24 The complexes were characterized using different spectroscopic studies. The molecular structures of complexes 1 and 3·CH3CN were determined using X-ray crystallography. We have investigated the oxidation of benzyl alcohol, catechol and o-aminophenol through experimental studies and theoretical calculations. Reaction pathways for these oxidations will be scrutinized and probable mechanisms are suggested.
Results and discussion
Syntheses and characterization
The Schiff-base ligands were obtained by refluxing a 1![[thin space (1/6-em)]](https://www.rsc.org/images/entities/char_2009.gif) :
:![[thin space (1/6-em)]](https://www.rsc.org/images/entities/char_2009.gif) 1 mixture of 2-(1-phenylhydrazinyl)pyridine and the corresponding substituted aldehyde in methanolic solution. The yellow colored ligands were obtained in good yield and showed good solubility in organic solvents like dichloromethane and acetonitrile, and were less soluble in methanol. The Schiff-base ligands on treatment with zinc salts in situ provided the four complexes.12 The complexes were characterized using IR, 1H NMR and 13C NMR studies (ESI, Fig. S1–S14†). All the complexes exhibited bands due to C
1 mixture of 2-(1-phenylhydrazinyl)pyridine and the corresponding substituted aldehyde in methanolic solution. The yellow colored ligands were obtained in good yield and showed good solubility in organic solvents like dichloromethane and acetonitrile, and were less soluble in methanol. The Schiff-base ligands on treatment with zinc salts in situ provided the four complexes.12 The complexes were characterized using IR, 1H NMR and 13C NMR studies (ESI, Fig. S1–S14†). All the complexes exhibited bands due to C![[double bond, length as m-dash]](https://www.rsc.org/images/entities/char_e001.gif) N stretching in the range of 1630–1685 cm−1 and skeletal vibrations in the range of 1540–1598 cm−1. 1H NMR spectra of the complexes showed a singlet signal in the range of δ ≈ 8.2–8.5 ppm, corresponding to the imine hydrogen. The peaks between δ 6.5 ppm and 7.5 ppm were found to be due to the aromatic hydrogens. For complexes 1 and 2, multiplet signals from the methylene hydrogens were found in the range of δ ≈ 1.8–3.0 ppm. Electronic absorption spectra of the complexes in dry acetonitrile solvent show two characteristic bands near 300 and 400 nm (shown in Fig. S15†). These two transitions are probably due to intraligand charge transfer (ILCT) or metal to ligand charge transfer (MLCT).29,30 These data were also supported by TD-DFT calculations described later (vide infra).
N stretching in the range of 1630–1685 cm−1 and skeletal vibrations in the range of 1540–1598 cm−1. 1H NMR spectra of the complexes showed a singlet signal in the range of δ ≈ 8.2–8.5 ppm, corresponding to the imine hydrogen. The peaks between δ 6.5 ppm and 7.5 ppm were found to be due to the aromatic hydrogens. For complexes 1 and 2, multiplet signals from the methylene hydrogens were found in the range of δ ≈ 1.8–3.0 ppm. Electronic absorption spectra of the complexes in dry acetonitrile solvent show two characteristic bands near 300 and 400 nm (shown in Fig. S15†). These two transitions are probably due to intraligand charge transfer (ILCT) or metal to ligand charge transfer (MLCT).29,30 These data were also supported by TD-DFT calculations described later (vide infra).
Description of the crystal structure
Crystals were obtained from dichloromethane and acetonitrile solutions (1![[thin space (1/6-em)]](https://www.rsc.org/images/entities/char_2009.gif) :
:![[thin space (1/6-em)]](https://www.rsc.org/images/entities/char_2009.gif) 1) of complexes 1 and 3·CH3CN after slow evaporation. The molecular structures of complexes 1 and 3·CH3CN are depicted in Fig. 1 and 2, respectively, and selected bond distances and bond angles are shown in Table 1.
1) of complexes 1 and 3·CH3CN after slow evaporation. The molecular structures of complexes 1 and 3·CH3CN are depicted in Fig. 1 and 2, respectively, and selected bond distances and bond angles are shown in Table 1.
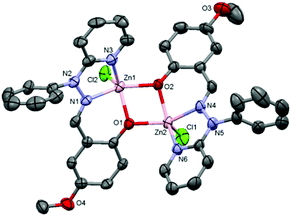 | ||
| Fig. 1 ORTEP diagram (40% probability level) of the complex [Zn2(OMe-Phimp)2(Cl)2] (1). Hydrogen atoms and solvent molecules are omitted for clarity. | ||
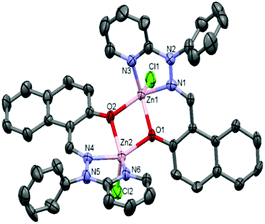 | ||
| Fig. 2 ORTEP diagram (40% probability level) of the complex [Zn2(N-Phimp)2(Cl)2] (3·CH3CN). All hydrogen atoms and solvent molecules are omitted for clarity. | ||
| 1 | 3·CH3CN | ||
|---|---|---|---|
| Bond lengths [Å] | |||
| Zn(1)–O(1) | 2.039(4) | Zn(1)–O(1) | 2.021(4) |
| Zn(1)–O(2) | 2.044(4) | Zn(1)–O(2) | 2.081(4) |
| Zn(1)–N(1) | 2.159(5) | Zn(1)–N(1) | 2.148(6) |
| Zn(1)–N(3) | 2.119(5) | Zn(1)–N(3) | 2.071(7) |
| Zn(1)–Zn(2) | 3.155(12) | Zn(1)–Zn(2) | 3.170(12) |
| Zn(2)–O(1) | 2.039(4) | Zn(2)–O(1) | 2.042(4) |
| Zn(2)–O(2) | 2.064(4) | Zn(2)–O(2) | 2.026(4) |
| Zn(2)–N(4) | 2.149(5) | Zn(2)–N(4) | 2.135(6) |
| Zn(2)–N(6) | 2.110(5) | Zn(2)–N(6) | 2.084(6) |
| Zn(2)–Cl(1) | 2.231(2) | Zn(2)–Cl(2) | 2.230(2) |
| Bond angles [°] | |||
| O(1)–Zn(1)–O(2) | 78.59(16) | O(1)–Zn(1)–O(2) | 78.29(15) |
| O(1)–Zn(1)–N(3) | 130.19(18) | O(1)–Zn(1)–N(3) | 131.7(3) |
| O(2)–Zn(1)–N(3) | 97.31(19) | N(3)–Zn(1)–O(2) | 97.4(2) |
| O(1)–Zn(1)–N(1) | 81.12(17) | O(1)–Zn(1)–N(1) | 80.7(2) |
| O(2)–Zn(1)–N(1) | 144.49(17) | N(3)–Zn(1)–N(1) | 75.3(2) |
| N(3)–Zn(1)–N(1) | 74.40(2) | O(2)–Zn(1)–N(1) | 143.6(2) |
| O(1)–Zn(1)–Cl(2) | 117.66(12) | O(1)–Zn(1)–Cl(1) | 113.4(2) |
| O(2)–Zn(1)–Cl(2) | 110.85(13) | N(3)–Zn(1)–Cl(1) | 112.79(18) |
| N(3)–Zn(1)–Cl(2) | 110.19(15) | O(2)–Zn(1)–Cl(1) | 111.7(2) |
| N(1)–Zn(1)–Cl(2) | 104.33(14) | N(1)–Zn(1)–Cl(1) | 103.82(17) |
| O(1)–Zn(2)–O(2) | 78.13(16) | O(2)–Zn(2)–O(1) | 79.09(16) |
| O(1)–Zn(2)–N(6) | 101.43(19) | O(2)–Zn(2)–N(6) | 130.0(3) |
| O(2)–Zn(2)–N(6) | 136.93(18) | O(1)–Zn(2)–N(6) | 98.6(2) |
| O(1)–Zn(2)–N(4) | 143.53(18) | O(2)–Zn(2)–N(4) | 81.7(2) |
| O(2)–Zn(2)–N(4) | 80.54(18) | O(1)–Zn(2)–N(4) | 148.1(2) |
| N(6)–Zn(2)–N(4) | 75.20(2) | N(6)–Zn(2)–N(4) | 75.0(2) |
| O(1)–Zn(2)–Cl(1) | 110.86(12) | O(2)–Zn(2)–Cl(2) | 115.6(2) |
| O(2)–Zn(2)–Cl(1) | 113.72(13) | O(1)–Zn(2)–Cl(2) | 112.8(2) |
| N(6)–Zn(2)–Cl(1) | 106.64(15) | N(6)–Zn(2)–Cl(2) | 111.22(18) |
| N(4)–Zn(2)–Cl(1) | 104.71(15) | N(4)–Zn(2)–Cl(2) | 98.41(18) |
| Zn(1)–O(1)–Zn(2) | 102.03(18) | Zn(1)–O(1)–Zn(2) | 101.85(19) |
| Zn(1)–O(2)–Zn(2) | 101.01(18) | Zn(2)–O(2)–Zn(1) | 100.39(17) |
Complex 1 adopted a dinuclear structure, consisting of two pentacoordinated zinc atoms bridged by two phenolato functional groups. Structural index parameter (τ)12,29 calculations for complex 1 afforded τ values of 0.23 and 0.11 for the Zn1 and Zn2 centers respectively. These values clearly indicate a distorted square pyramidal geometry of the ligands around both the zinc centres.
Similarly, in complex 3·CH3CN, the dinuclear unit consisted of two pentacoordinated zinc atoms bridged by the two phenolato moieties of two deprotonated OMe-PhimpH ligands. Structural index parameter (τ)12,29 calculations for complex 3·CH3CN afforded τ values of 0.19 and 0.30 for the Zn1 and Zn2 centers respectively, which clearly supports a distorted square pyramidal geometry of the ligands around both the zinc centres. Interestingly, in both metal complexes 1 and 3·CH3CN, two chloride ions (Cl1 and Cl2) were found to be on the same side of the Zn–Zn axis, and consequently the ligands (OMe-Phimp− and N-Phimp−) occupied the other side giving rise to an overall unique cis configuration in complexes 1 and 3·CH3CN respectively (shown in Fig. 3). The cis arrangement of chloride ions along the Zn–Zn axis is different to the structure reported by Reedijk and coworkers.29 The Zn–Cl bond distances in complexes 1 and 3·CH3CN are consistent with the literature values.12,31 Also, all the Zn–N (Nimine as well as Npyridine) distances were found to be consistent with the reported literature.12,31
 | ||
| Fig. 3 The cis configuration of complex 1, as viewed along the Zn–Zn axis, and a polyhedron representation of the Zn2O2 unit. | ||
We have reported12 that the Zn–Zn distance in these types of complexes was found to be in the range of 2.94 Å–3.24 Å. The Zn–Zn distances obtained for complex 1 (3.15 Å) and complex 3·CH3CN (3.17 Å) were found to be in the higher side of this range. In the case of complexes 1 and 3·CH3CN, the Zn–O (phenolato) bond lengths were found to be in a range from 2.064 Å to 2.039 Å and 2.079 Å to 2.022 Å respectively. These distances are similar to the data reported by Das and co-workers,22 and Reedijk and co-workers.29
Noncovalent interactions, like π–π stacking interactions and hydrogen bonding networks, play an important role in supramolecular chemistry, crystal engineering and biology.32 For complexes 1 and 3·CH3CN, intermolecular as well as intramolecular hydrogen bonding interactions were observed between the chloride ions and aryl hydrogens of the phenyl ring, and the interactions are depicted in Fig. S38 and S39 respectively in the ESI.†
From the crystal structure, complex 1 possessed intermolecular as well as intramolecular hydrogen bonding interactions between the chloride ions and aryl hydrogens of the phenyl ring with distances of 2.763 Å (intermolecular hydrogen bonding), and 2.799 Å and 2.791 Å (intramolecular hydrogen bonding interactions). Similarly, complex 3·CH3CN also possessed both intermolecular and intramolecular hydrogen bonding interactions between the chloride ions and aryl hydrogens of the phenyl ring with distances of 2.845 Å (intermolecular hydrogen bonding), and 2.769 Å and 2.840 Å (intramolecular hydrogen bonding interactions). The non-covalent interactions found in complexes 1 and 3·CH3CN are described in the ESI (Table S1†).
Theoretical calculations
Density functional theory (DFT) calculations were performed to obtain better insight into the electronic properties of all the dinuclear zinc complexes. For complexes 1 and 3·CH3CN, the bond lengths and bond angles were found to be approximately similar to data obtained from the X-ray crystallographic studies (Table S2†). The frontier molecular orbital composition and energy levels of complexes 1 and 2 in the singlet ground state are shown in Table 2 and the data for the other complexes are in the ESI (Tables S5 and S6†). It is important to note here that for all the complexes the electron density of the HOMO orbital was mainly found to be on the ligand part and the contribution from the metal for the HOMO of complexes 1, 2, 3·CH3CN and 4 was found to be negligible. These data clearly indicate the non-innocent behavior of the ligands in these complexes. Moreover, we also observed that the contribution from the ligand, excluding the phenolato ring, was found to be about 30% for all of the four complexes. The contribution from the phenyl ring containing phenolato function was around 70%; however, 73% was observed for the –OMe substituted phenyl ring in complex 1. Further investigation of the contribution from the ligand afforded a contribution of around 23% for the phenolato ring in the LUMO of complexes 1, 3·CH3CN and 4. A 38% contribution from the phenolato ring was observed for complex 2. The contribution from the rest of the ligand for the LUMO was found to be around 75% for complexes 1, 3 and 4. However, for complex 2, this contribution was calculated to be 61%. A major share (∼73%) of the HOMO clearly indicated a better stabilization of the phenoxyl radical complex for 1 and this will be discussed later (in the section describing generation of the phenoxyl radical complex, vide infra). The LUMO for all the dinuclear zinc complexes originates from a π* orbital contribution of the whole ligand; however, L+4 and L+5 originate from the ligand part also with 0% contribution from the phenolato moiety. It was found that the HOMO and LUMO gap (3.40 eV) in complex 1 is slightly less than for the other complexes, which may result from an increase in resonance in the complex (Fig. S40†). The HOMO LUMO energy gaps for all the complexes were calculated and are shown in Fig. S40.†| Orbital | Energy (eV) | % Contribution | Main bond type | |||
|---|---|---|---|---|---|---|
| Zn | O | Phenolato ring | Ligand | |||
| Complex 1 | ||||||
| L+4 | −1.1643 | 0 | 0 | 0 | 96 | π*(L) |
| L+3 | −1.2650 | 0 | 1 | 11 | 100 | π*(L) + π*(phenolato ring) |
| L+2 | −1.3194 | 0 | 0 | 10 | 100 | π*(L) + π*(phenolato ring) |
| L+1 | −1.7729 | 1 | 2 | 25 | 98 | π*(L) + π*(phenolato ring) |
| L | −1.7956 | 1 | 2 | 25 | 99 | π*(L) + π*(phenolato ring) |
| H | −5.1985 | 0 | 19 | 73 | 99 | π (L) + π(phenolato ring) |
| H−1 | −5.2787 | 1 | 15 | 69 | 97 | π (L) + π(phenolato ring) |
| H−2 | −6.0020 | 0 | 1 | 30 | 84 | π(L) + π(phenolato ring) + n(Cl) |
| H−3 | −6.0953 | 1 | 1 | 28 | 71 | π(L) + π(phenolato ring) + n(Cl) |
| H−4 | −6.1231 | 4 | 0 | 2 | 6 | π(L)) + n(Cl) |
| Complex 2 | ||||||
| L+4 | −1.2465 | 0 | 0 | 0 | 100 | π*(L) |
| L+3 | −1.3796 | 0 | 1 | 14 | 100 | π*(L) + π*(phenolato ring) |
| L+2 | −1.4261 | 0 | 0 | 13 | 100 | π*(L) + π*(phenolato ring) |
| L+1 | −1.8805 | 1 | 4 | 39 | 99 | π*(L) + π*(phenolato ring) |
| L | −1.8969 | 1 | 3 | 38 | 99 | π*(L) + π*(phenolato ring) |
| H | −5.3712 | 0 | 11 | 67 | 98 | π (L) + π(phenolato ring) |
| H−1 | −5.4314 | 1 | 9 | 66 | 96 | π (L) + π(phenolato ring) |
| H−2 | −6.1302 | 2 | 6 | 39 | 47 | π(L) + π(phenolato ring) + n(Cl) |
| H−3 | −6.1800 | 5 | 1 | 2 | 3 | π(L) + π(phenolato ring) + n(Cl) |
| H−4 | −6.2020 | 3 | 1 | 4 | 7 | π(L)) + n(Cl) + π(phenolato ring) |
The nature of the bonding interactions of all the dinuclear zinc complexes has been investigated (ESI, Tables S9, S10, S12, S13, S15, S16, S18 and S19†).57,59 The composition and occupancy of the calculated C–O, C–N and N–N natural bond orbitals (NBOS) for complex 1 are given in Table S9.† The data for complexes 2, 3·CH3CN and 4 are also given in the ESI (Tables S12, S15 and S18†).
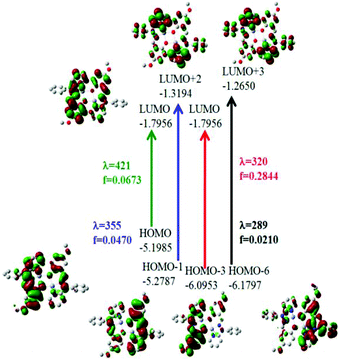
On the basis of natural bond orbitals, the electronic arrangement of Zn(1) in complex 1 is: [Ar]4s0.303d9.984p0.425p0.01 with 10.70 valence electrons, while the electronic arrangement of Zn(2) in complex 1 is: [Ar]4s0.313d9.984p0.425p0.01 with 10.70 valence electrons. So both metal centres have the same electronic configuration. The occupancies for the zinc (filled d10 system having two electrons in each orbital) were found to be similar for both the metal centres in 1 and the electronic distribution could be written as: dxy1.996dyz1.997dzx1.997dx2−y21.996dz21.995. Similarly for complex 2 the electronic arrangement of the Zn centre is: [Ar] 4s0.303d9.984p0.425p0.01 with 10.70 valence electrons, which is similar to the electronic arrangement of complex 1. Complexes 3·CH3CN and 4 also have similar electronic arrangements. All complexes have fully filled d orbitals at the metal centre, in a similar fashion. Therefore, the zinc centre does not have any effective role, rather the participation of the ligand in catecholase and o-aminophenol oxidase type-processes is extremely important for the present study. The strength of the interactions between the donor and acceptor sites can be calculated using the second order perturbation theory (ESI, Tables S11, S14, S17 and S20†).33a,b A higher value of E2 (kcal mol−1) indicates a better interaction of the orbitals inside a molecule.33a,b For complex 1, the values of E2 for the interactions LP (3) O75 → BD*(2) C42–C66, LP (3) O76 → BD*(2) C12–C65, LP (1) N80 → BD*(2) C43–N79 and LP (1) N 80 → BD*(2) C56–C57 are 35.02 kcal mol−1, 33.46 kcal mol−1, 24.04 kcal mol−1 and 39.68 kcal mol−1 respectively. However, the values of E2 for the interactions LP (2)O 75 → LP*(7)Zn 2, LP (2) O75 → LP*(8)Zn 2, LP (2) O 76 → LP*(7)Zn 1 and LP (2)O 76 → LP*(8)Zn1 are 17.23 kcal mol−1, 10.27 kcal mol−1, 17.78 kcal mol−1 and 10.67 kcal mol−1 respectively. Comparison of the above two sets of E2 values for complex 1 indicates that the interactions between O and Zn are not effective and that the intraligand interactions are more effective. The rest of the data calculated for the other complexes are present in the ESI (Tables S11, S14, S17 and S20†). We have performed calculations through time dependent density functional theory (TD-DFT) at the ground state (S0). The data obtained for complexes 1 and 2 after the TD-DFT calculations are shown in Table S7,† while the TD-DFT data of complexes 3·CH3CN and 4 are also present in the ESI (Table S8†). Five main transitions were observed for complex 1. The main transitions are (1) S0 → S3 (H−1 → L), 412 nm, f = 0.0246, (2) S0 → S4 (H−1 → L+1), 405 nm, f = 0.1239, and (3) S0 → S7 (H−1 → L+2), 355 nm, f = 0.0470. The peak at ca. 412 nm was recognized as mostly due to an intraligand (ILCT) charge transfer transition with minor contributions from H−1 → L+1 and H → L+1.
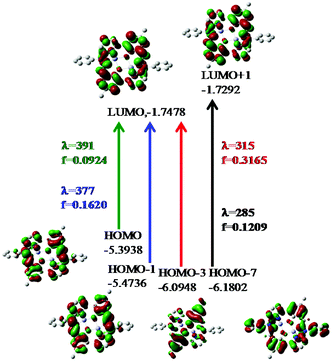
The TD-DFT spectrum of complex 2 showed four transitions at 377 nm, 340 nm, 315 nm and 285 nm, with oscillator strengths of 0.1620, 0.0859, 0.3165 and 0.1209 respectively, which were assigned to H−1 → L+1, H → L+3, H−3 → L+1 and H−8 → L+1 respectively. These transitions in the spectrum can be assigned to ILCT (pπ → pπ*) transitions. The probable electronic transitions of complexes 1 and 2 are shown in Fig. 4 and 5. Similarly, complexes 3·CH3CN and 4 also showed three and four transitions respectively, which can also be assigned to ILCT transitions. In the case of complex 3, the three main transitions are (1) S0 → S4 (H−1 → L+1), 391 nm, f = 0.3822, (2) S0 → S15 (H−2 → L), 329 nm, f = 0.1934, and (3) S0 → S60 (H → L+11, H−1 → L+10), 273 nm, f = 0.0575. Similarly, complex 4 showed four transitions at 378 nm, 331 nm, 312 nm and 282 nm, with oscillator strengths of 0.1164, 0.0795, 0.3405 and 0.1441 respectively, which were assigned to H → L, H → L+3, H−5 → L+1 and H−1 → L+6 transitions respectively.
Electrochemistry
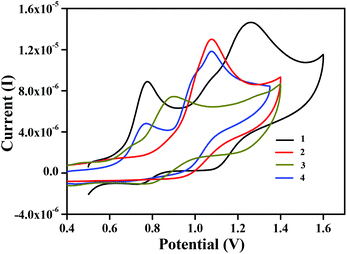
The redox behavior of complexes 1, 2, 3·CH3CN, and 4 was examined. Interestingly, we have redox inactive metal centres ligated to redox-active ligands in these complexes. Data obtained from cyclic voltammetry at 298 K under an inert atmosphere in acetonitrile solvent are shown in Table 3 and the voltammograms are displayed in Fig. 6. Complexes 1 and 2 displayed quasi-reversible redox waves, centred at E1/2 = 0.75 V and 1.17 V for complex 1 and E1/2 = 1.00 V for complex 2. These are mainly due to the successive oxidation of coordinating phenolates to phenoxyl radicals.29 Similarly, for complexes 3·CH3CN and 4 the voltammograms exhibited single quasireversible redox waves in the positive region of the potential. These were centred at E1/2 = 0.83 V for complex 3·CH3CN and E1/2 = 0.73 V and 0.98 V for complex 4.Generation of phenoxyl radical complexes
Phenoxyl radical complexes were generated when the complexes were treated with ceric ammonium nitrate ((NH4)2[CeIV(NO3)6], CAN) in an acetonitrile solution. Representative spectra of complex 1 are shown in Fig. 7 and the other spectra are present in the ESI (Fig. S23–S25†). A UV–visible spectrophotometer was used for investigation of the generation of the phenoxyl radical complexes, and the oxidation of complexes 1, 2, 3·CH3CN and 4 was performed through addition of CAN. In acetonitrile solution, complexes 1, 2 and 4 were found to be green in color, whereas complex 3·CH3CN was yellow in color.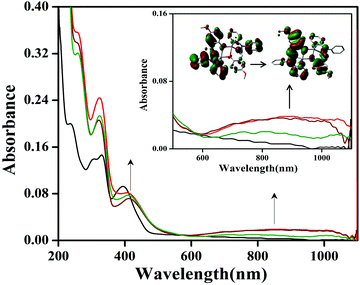 | ||
Fig. 7 Generation of phenoxyl radicals with complex 1 (10 × 10−5 M) after addition of CAN ( 1 equivalent, 1 equivalent,  2 equivalents, 2 equivalents,  3 equivalents). 3 equivalents). | ||
After the addition of an acetonitrile solution of CAN into a solution of complex 1, the band at 390 nm disappeared, and a new band at 410 nm and a broad band of low intensity at around 800 nm were observed, which clearly indicated the formation of phenoxyl radical (Fig. 7).
A similar absorption spectrum (414 and 800 nm) was also obtained during the oxidation of complex 2 (Fig. S23†). For complex 3·CH3CN, after the addition of CAN a band at 420 nm disappeared and a band at around 800 nm was observed, which shows the radical generation (Fig. S24†). However, for complex 4 the phenoxyl radical generation was performed using a procedure reported in our previous work12 (Fig. S25†). It is well known from the literature that an absorption band at around 420 nm can be assigned to a π–π* transition of the phenoxyl radical.12 In the case of complex 1, the oxidized species 1˙+ have filled d10 orbitals at the zinc centre, hence this oxidized species was found to be paramagnetic (EPR active) due to the presence of one unpaired electron in 1˙+. Interestingly, it was found that complex 1 is as such a radical complex. So complex 1 has a tendency to be oxidized due to the signature of the EPR signal. The EPR spectrum was also obtained, which exhibited a very sharp signal at g = 2.001 for radical complex 1˙+ and this gave rise to information on the generated phenoxyl radical (S = ½) species.12 The X-band EPR spectrum of the phenoxyl radical complex derived from 1 in CH3CN at room temperature is shown in the ESI (shown in Fig. S22†).
It was found that the contribution from the ring containing the phenolato function was 73% for the HOMO due to the +R effect of the –OMe group present in complex 1. This value is more than those obtained for complexes 2, 3·CH3CN and 4, and a high contribution from the phenolato ring in the HOMO gives rise to a higher electron density and consequently stabilization of the phenoxyl (cationic and electron deficient) radical.8 We performed TD-DFT calculations for the complex 1˙+ and we found that two main transitions in the NIR region are observed for complex 1˙+. The transitions are (1) (H−7 → L), 751 nm, f = 0.0068, and (2) (H−8 → L), 1119 nm, f = 0.0282, which was recognized as mostly due to an intraligand charge transfer (ILCT) transition.
Reactivity studies
Benzyl alcohol oxidation
Oxidation of benzylic alcohols was investigated using the dinuclear zinc complexes in the presence of TBHP and TBHP/TEMPO with a small amount of base. A combination of TBHP, TEMPO, air and the complexes 1–4 afforded benzaldehyde (conversion was up to 60%) (shown in Table 4). We would like to mention that a combination of TBHP and the complexes gave rise to benzaldehyde and benzoic acid, with a conversion up to 52% for the aldehyde in these reactions.| Complex | Reactant | Oxidant | Product | TON | % Conversion |
|---|---|---|---|---|---|
| 1 | Benzyl alcohol | TEMPO/TBHP | Benzaldehyde | 300 | 60 |
| TBHP | Benzaldehyde | 260 | 52 | ||
| p-Methoxy benzyl alcohol | TEMPO/TBHP | p-Methoxy benzaldehyde | 325 | 65 | |
| TBHP | p-Methoxy benzaldehyde | 320 | 64 | ||
| 2 | Benzyl alcohol | TEMPO/TBHP | Benzaldehyde | 155 | 31 |
| TBHP | Benzaldehyde | 130 | 26 | ||
| p-Methoxy benzyl alcohol | TEMPO/TBHP | p-Methoxy benzaldehyde | 180 | 36 | |
| TBHP | p-Methoxy benzaldehyde | 90 | 18 | ||
| 3 | Benzyl alcohol | TEMPO/TBHP | Benzaldehyde | 100 | 20 |
| TBHP | Benzaldehyde | 115 | 23 | ||
| p-Methoxy benzyl alcohol | TEMPO/TBHP | p-Methoxy benzaldehyde | 150 | 30 | |
| TBHP | p-Methoxy benzaldehyde | 75 | 15 | ||
| 4 | Benzyl alcohol | TEMPO/TBHP | Benzaldehyde | 150 | 44 |
| TBHP | Benzaldehyde | 180 | 36 | ||
| p-Methoxy benzyl alcohol | TEMPO/TBHP | p-Methoxy benzaldehyde | 140 | 28 | |
| TBHP | p-Methoxy benzaldehyde | 285 | 57 | ||
In the oxidation of the primary alcohols, complex 1 was found to be most effective. On the other hand, complex 3 was found to be least effective. These data clearly indicate the importance of generation of a stable phenoxyl radical in solution during the catalytic process.
The oxidation capability of complexes 1–4 was consistent with results reported by Wieghardt and coworkers.9b,c The addition of a base plays an important role in activation of the alcohol.9b,c In our study, potassium carbonate (K2CO3) was found to be effective for the alcohol oxidation, however other bases such as triethylamine can also be employed.9c
Complex 1 was found to be capable of oxidizing primary alcohols to the corresponding aldehyde, through a 2e− reduction and forming the 2e− reduced form. The mechanism of TEMPO-catalyzed oxidation of primary alcohols with zinc complexes could not be established. The reaction could progress via the mechanism proposed by Wieghardt and coworkers.9b,c
Catecholase activity
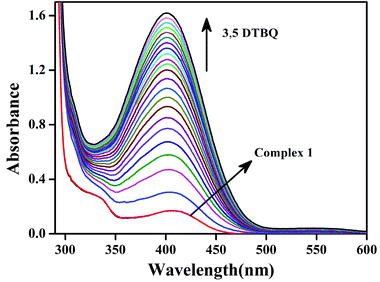
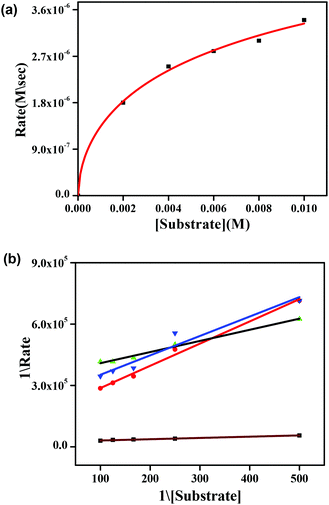
Earlier we discussed that complexes 1–4 have two chloride ions that are cis to each other with respect to the Zn–Zn axis (vide supra). This prompted us to study the reactivity of these complexes with 3,5-DTBC, which is the substrate for studying catecholase activity.34–45 Addition of 3,5-DTBC to acetonitrile solutions of the complexes gave rise to generation of a spectral band near 400 nm (ref. 38 and 39), as shown in Fig. 8 for complex 1 and rest of the spectra are shown in the ESI (Fig. S26, S27 and S28†). Side reactions such as ring-opening are prevented due to the presence of bulky substituents in 3,5-DTBC and formation of a very stable oxidized product 3,5-DTBQ afforded an absorption maxima near 400 nm.46–56Fig. 9a shows the initial rate of the oxidation of 3,5 DTBC for complex 1 and the other spectra are shown in the ESI (Fig. S32, S33 and S34†). Lineweaver–Burk plots for complexes 1–4 are shown in Fig. 9b. All the dinuclear complexes showed saturation kinetics and a treatment based on the Michaelis–Menten model seemed to be appropriate. The values of the Michaelis binding constant (Km), the maximum velocity (Vmax), and the rate constant for dissociation of substrates (i.e., turnover number, kcat) were calculated for the complexes from the graphs of 1/V vs. 1/[S] (Fig. 9b), known as a Lineweaver–Burk graph, using the equation 1/V = {Km/Vmax}{1/[S]} + 1/Vmax, and the kinetic parameters are presented in Table 5.34
| Complex | V max (M s−1) | K m (M) | k cat (h−1) |
|---|---|---|---|
| 1 | (6.59 ± 0.08) × 10−4 | (8.4 ± 0.06) × 10−3 | 2.3 × 10⁴ |
| 2 | (6.09 ± 0.13) × 10−4 | (6.3 ± 0.11) × 10−3 | 2.1 × 10⁴ |
| 3 | (3.85 ± 0.16) × 10−4 | (2.2 ± 0.09) × 10−3 | 1.3 × 10⁴ |
| 4 | (4.65 ± 0.22) × 10−4 | (1.3 ± 0.10) × 10−2 | 1.8 × 10⁴ |
Phenoxazinone synthase activity
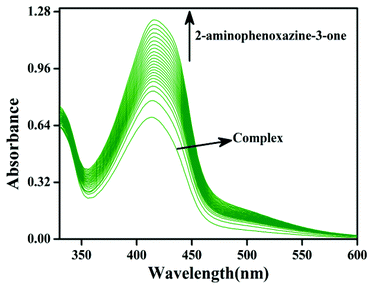
The phenoxazinone synthase activity of all the four complexes 1–4 was investigated through the oxidation of o-aminophenol (OAPH) in dioxygen-saturated acetonitrile solution at 25 °C.21 Before beginning a detailed kinetic investigation, it is necessary to obtain an estimation of the ability of the complexes to oxidize o-aminophenol.For this purpose, 1.0 × 10⁻⁴ M solutions of the complexes were mixed with a 1.0 × 10⁻² M solution of OAPH, and spectra were recorded for up to 2 h in dioxygen saturated acetonitrile at 25 °C. For complex 1, the spectral changes after the addition of OAPH are shown in Fig. 10. However, for the other complexes, the plots are present in the ESI (Fig. S29–S31†). The spectral scans revealed a progressive increase of the peak intensity at ca. 425 nm, characteristic of a phenoxazinone chromophore, suggesting catalytic conversion of the OAPH to 2-aminophenoxazine-3-one under aerobic conditions. A blank experiment without the catalyst under identical conditions did not show significant growth of the band at 425 nm. The spectral results allowed us to conclude that all the complexes exhibit phenoxazinone synthase-like activity under aerobic conditions. Kinetic studies were performed to understand the extent of the catalytic activity. For this purpose, 1 × 10⁻⁴ M solutions of 1, 2, 3·CH3CN and 4 were treated with at least a 100-fold more concentrated substrate solution so as to maintain the pseudo-first-order conditions.
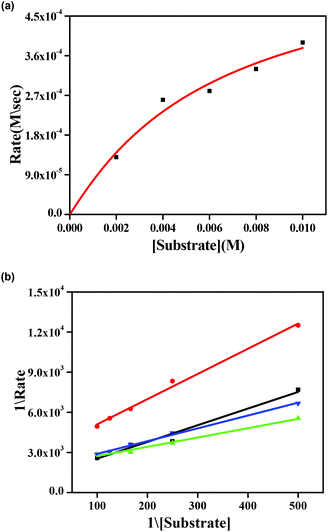
All the kinetic experiments were carried out at a constant temperature of 25 °C, and monitored with a UV-Visible spectrophotometer under aerobic conditions. For a particular complex–substrate mixture, timed scans of the maximum band of 2-aminophenoxazine-3-one were performed for a period of one hour. For complex 1, a plot of the initial rate of the reaction versus the concentration of the substrate showed rate saturation kinetics, as can be seen from Fig. 11a. While for the other complexes, the plots of initial rate versus concentration are present in the ESI (Fig. S35–S37†). This observation indicates that 2-aminophenoxazine-3-one formation proceeds through a relatively stable intermediate, a complex–substrate adduct, followed by redox decomposition of the intermediate. This type of saturation rate dependency can easily cause recall of the Michaelis–Menten model, originally developed for enzymatic kinetics, which on linearization provides a double reciprocal Lineweaver–Burk plot that can enable analysis of the values of various parameters like Vmax, Km, and kcat. The Lineweaver–Burk plots for complexes 1, 2, 3·CH3CN and 4 are shown in Fig. 11b. Analysis of the experimental data yielded the Michaelis binding constant Km and Vmax, and the turnover number (kcat) value was obtained by dividing the Vmax by the concentration of the complex used. These parameters are listed in Table 6. Moreover, for a particular substrate concentration, on varying the complex concentration a linear relationship for the initial rates was obtained, which shows a first-order dependence on the complex concentration. The kinetic parameters, such as the maximum velocity (Vmax), turnover number (kcat) and Michaelis binding constant (Km), of all the complexes are listed in Table 6. During investigation of the catecholase activity, it was found that complex 1, which contains a methoxy group on the phenolato donor, provided a stable phenoxyl radical, showing greater activity with a turnover number of 2.3 × 10⁴. Similarly, for the phenoxazinone synthase activity, complex 1 was also found to be more active with a turnover number of 2.6 × 10³. It was clearly indicated that the activity of the phenoxyl radical complexes follows the order OMe (1) > Me (2) > H (4) > Naph (3), due to the stability of the phenoxyl radical in both the catecholase as well as the phenoxazinone synthase activity investigations. This explanation is also supported by the data reported by Belle and co-workers in which the catecholase activity follows the order OMe > Me > F > CF3, with OMe showing the highest activity.35,36 Another group, Torelli and co-workers,36 also investigated the catecholase activity of copper complexes, and they found a drastic change in response to the effect of the para subtituents and observed that the activity was decreased by a small extent when the ligand had an electron withdrawing F atom as substituent.
| Complex | V max (M s−1) | K m (M) | k cat (h−1) |
|---|---|---|---|
| 1 | (7.3 ± 0.11) × 10−5 | (1.3 ± 0.08) × 10−2 | 2.6 × 10³ |
| 2 | (5.78 ± 0.3) × 10−6 | (4.4 ± 0.17) × 10−3 | 2.0 × 10² |
| 3 | (2.7 ± 0.24) × 10−6 | (6.4 ± 0.19) × 10−3 | 0.97 × 10² |
| 4 | (4.9 ± 0.09) × 10−6 | (1.4 ± 0.06) × 10−3 | 1.76 × 10² |
Reaction pathway
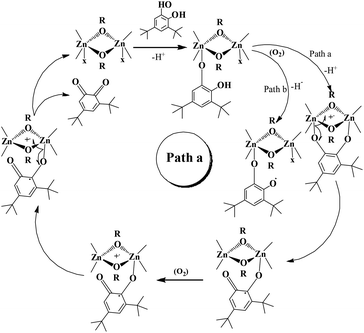
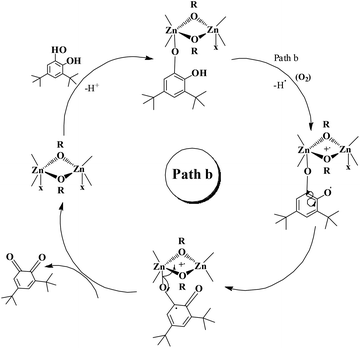
Investigation of the literature revealed that catechol will come and binds to one of the zinc centre present in the molecule. A similar kind of coordination was found in the mechanism for oxidation of a primary alcohol to an aldehyde in a galactose oxidase enzyme model.56 However, we can't deny bidentate chelation of the catechol.Probably monoligation as well as bidentate ligation of catechol is happening during the reaction. The substrate, after bidentate chelation, would undergo oxidation due to the presence of a non-innocent and redox active ligand in these complexes. In the case of monodentate ligation, oxidation of the catechol could also occur and at the end of the reaction o-quinone would be produced (vide infra). Both the reaction models are shown in Schemes 4 and 5. We have performed EPR spectral studies of the dinuclear zinc complex as well as a mixture of zinc complex 1 and catechol. Complex 1 provided an EPR signal with a g value of 2.001. This data is consistent with the data reported by Reedijk and co-workers.29
We would like to mention here that the zinc complexes capable of generating stable phenoxyl radicals did not provide sharp NMR signals and broadening of the signals was observed.12 The EPR signal clearly indicates the presence of radical species in complex 1 due to the redox nature of the ligand. The other complexes did not provide this g ≈ 2 EPR signal. This may be due to inferior stabilization of the phenoxyl radical in these complexes. Addition of 3,5-DTBC to the zinc complexes provided an EPR signal with a g value of 2.00. We examined the EPR signals of complex 2 in the presence of catechol and in the absence of catechol. The generation of an EPR signal after catechol addition clearly indicated the formation of a ligand centered radical species in the solution mixture (vide infra).
To investigate the possible binding modes of 3,5-DTBC with the dinuclear zinc complexes, the Gibbs free energies were calculated and compared for the different binding modes of catechol to a dinuclear zinc complex (Fig. 12).58 The ΔG value was found to be 22.90 kcal mol−1 when the catechol binds to the dinuclear zinc complex in a monodentate fashion (I). However, in the case of bidentate chelation (II), the ΔG value was found to be 67.17 kcal mol−1. We concluded that in the case of a bidentate binding mode for catechol the value of the Gibbs free energy (ΔG) is three times more than the monodentate binding mode. This may be due to steric hindrance and suggested that the monodentate binding mode of catechol, as an intermediate, is more favourable during the oxidation of catechol. The energies for the possible binding modes of catechol with dinuclear zinc complex 4 and the possible intermediates are shown in Fig. 13.
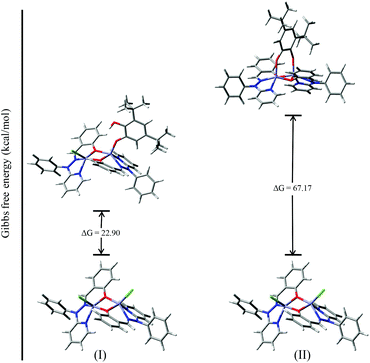 | ||
| Fig. 12 ΔG values and optimized structures of the possible intermediates for the catecholase reaction using complex 4. | ||
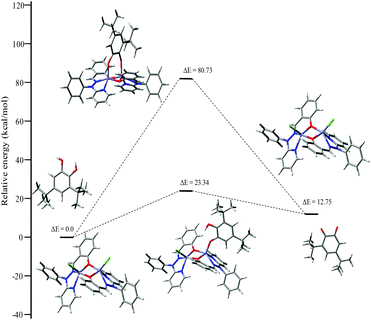 | ||
| Fig. 13 Energy profile diagram for complex 4 during the catecholase reaction, with the possible intermediates. | ||
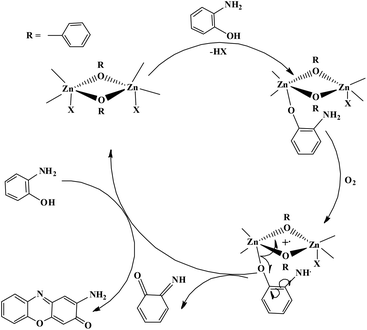
Our catecholase activity results are consistent with the data reported by Das and co-workers22 and Biswas and co-workers,23 and we speculate that such a conversion has a radical dependent pathway. The more facile the generation of the phenoxyl radical, the more easy oxidation of the catechol will be. We have investigated the phenoxazinone synthase activity of our zinc complexes. We would like to mention here that the rate of formation of phenoxazinone is greater with those zinc complexes capable of generating a stable phenoxyl radical. Consistent with our concept of phenoxyl radical complexes, we found out that a molecule capable of generating a stable phenoxyl radical is efficient at performing the catecholase reaction as well as the o-aminophenol oxidase reaction. The mechanistic pathway for the phenoxazinone synthase process clearly indicates the role of the radical generation, as shown in Scheme 6.
For authentication of the binding mode of the o-aminophenol with the dinuclear zinc complexes, Gibbs free energies were also calculated and compared for the different binding modes of o-aminophenol with a dinuclear zinc complex. The ΔG value was found to be 20.79 kcal mol−1 when the phenolic group (after deprotonation) binds to the zinc complex in a monodentate fashion (I, Fig. 14). However, the ΔG value calculated for deprotonation of the amine group in the same way (II, Fig. 14) was found to be 37.01 kcal mol−1. In the case of step (III), where the neutral amine of o-aminophenol is bound to the dinuclear zinc complex, the value of Gibbs free energy (ΔG) was found to be 161.88 kcal mol−1. Analysis of the above data clearly suggested that the monodentate binding mode of the o-aminophenol in step (I) is more favourable than steps (II) and (III) during the o-aminophenol oxidase reaction.
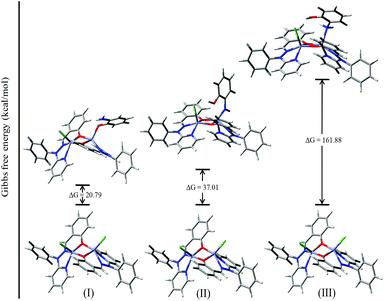 | ||
| Fig. 14 ΔG values and optimized structures for the possible intermediates during the phenoxazinone synthase reaction using complex 4. | ||
Mechanistic investigation results with the possible binding modes of o-aminophenol with the dinuclear zinc complex are shown in Fig. 14 and a relative energy diagram for the possible intermediates during the o-aminophenol oxidase reaction with complex 4 is shown in Fig. 15.
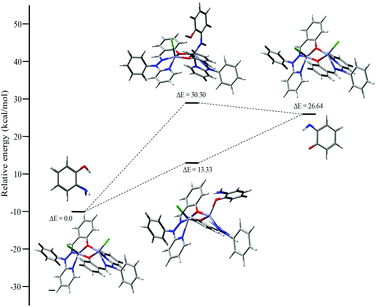 | ||
| Fig. 15 Energy profile diagram for complex 4 during the o-aminophenol oxidase reaction, with the possible intermediates. | ||
Molecules with a Zn2O2 moiety have a tendency to form phenoxyl radical complexes, and this was mentioned in our previous report.12 We also mentioned that the NMR spectra signals were found to be broad for the complexes. This prompted us to study the EPR spectra of the complexes. It is well known from the literature that a OMe group stabilizes phenoxyl radical complexes.34 Complex 1 by itself provided the EPR signal shown in Fig. 16a at 25 °C. On the other hand, complex 2 did not provide an EPR signal under the same conditions. However, an EPR study (at 25 °C) was performed immediately after mixing complex 2 and 3,5-DTBC under aerobic conditions, and the spectrum obtained is shown in Fig. 16b.
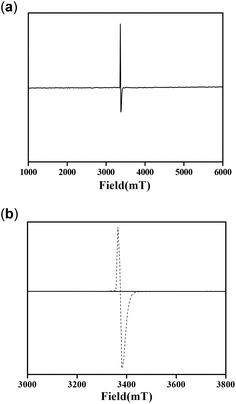 | ||
| Fig. 16 EPR spectra of (a) complex 1, (b) complex 2 (solid line) and a mixture of complex 2 and 3,5-DTBC (dotted line) at 25 °C. | ||
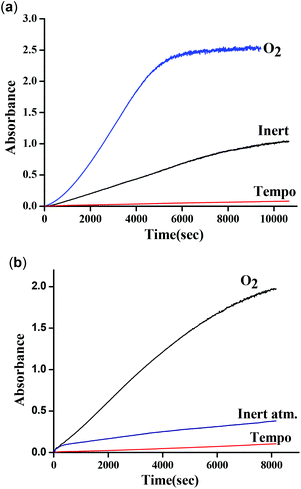
These results clearly indicate the radical nature of the complex, as for complex 1. It is important to note that our data are consistent with the reported data by Reedijk and co-workers.29 To confirm the participation of radical species during the oxidation of 3,5-DTBC, the reaction was performed in the presence of a radical scavenger TEMPO (TEMPO = 2,2,6,6-tetramethylpiperidinoxyl).22 Oxidation of 3,5-DTBC was not observed in the presence of TEMPO (significant decrease in the reaction rate), which clearly indicated the generation of a radical during the catechol oxidation (Fig. 17a). Moreover, when this catalytic reaction was performed under an inert atmosphere, very little formation of 3,5-DTBQ was observed. Similarly, oxidation of o-aminophenol was investigated under similar conditions to those described above. The desired activity (oxidation of o-aminophenol) was not observed in the presence of TEMPO (Fig. 17b). All these results clearly express the role of dioxygen, as well as radical intermediates, in this catalytic reaction.
ESI-MS study for mechanistic pathway
For investigation of the possible intermediates formed during the catecholase and phenoxazinone synthase activity studies, an ESI-MS technique was used to analyse a mixture of complex 4 and 3,5-DTBC in a 1![[thin space (1/6-em)]](https://www.rsc.org/images/entities/char_2009.gif) :
:![[thin space (1/6-em)]](https://www.rsc.org/images/entities/char_2009.gif) 100 molar ratio, and complex 4 and o-aminophenol (OAPH) in a 1
100 molar ratio, and complex 4 and o-aminophenol (OAPH) in a 1![[thin space (1/6-em)]](https://www.rsc.org/images/entities/char_2009.gif) :
:![[thin space (1/6-em)]](https://www.rsc.org/images/entities/char_2009.gif) 100 ratio, respectively. The most abundant species was found at m/z 797.05, with line to line separation in the recorded spectrum, and was analogous to the sodium aggregate of complex 4 and it can be formulated as [NaZn2(Phimp)2(Cl)2]+ in both cases (shown in Fig. 18 and 19). In Fig. 18, another peak at m/z 739.05 was assigned to [Zn2(Phimp)2Cl]+. Complex 4 exhibits a peak at m/z 983.22, which was assigned to [NaZn2(Phimp)2Cl(3,5-DTBCH)]+. The peak at m/z 243.14 was well matched to the quinone sodium aggregate [3,5-DTBQNa]+(Fig. 18). However, in Fig. 19, complex 4 exhibits several peaks at m/z 797.05, 774.02, and 739.03 with line to line separation and these peaks were assigned to [NaZn2(Phimp)2(Cl)2]+, [Zn2(Phimp)2(Cl)2]+ and [Zn2(Phimp)2Cl]+. When complex 4 reacted with o-aminophenol (OAPH), the spectrum showed dissociation of one chloride ion to form a monoadduct of o-aminophenol with the sodium aggregate, which was assigned as [NaZn2(Phimp)2Cl(OAP)]+, and this peak appeared at m/z 870.07 (shown in Fig. 19). Two other peaks at m/z 213.04 and 235.05 were attributed to the protonated species of 2-aminophenoxazine-3-one and a sodium aggregate of 2-aminophenoxazine-3-one respectively (Fig. 19). These data show the dissociation of a chloride ion, which will facilitate the monodentate chelation of catechol and o-aminophenol to the zinc complexes, and support our mechanistic pathway.
100 ratio, respectively. The most abundant species was found at m/z 797.05, with line to line separation in the recorded spectrum, and was analogous to the sodium aggregate of complex 4 and it can be formulated as [NaZn2(Phimp)2(Cl)2]+ in both cases (shown in Fig. 18 and 19). In Fig. 18, another peak at m/z 739.05 was assigned to [Zn2(Phimp)2Cl]+. Complex 4 exhibits a peak at m/z 983.22, which was assigned to [NaZn2(Phimp)2Cl(3,5-DTBCH)]+. The peak at m/z 243.14 was well matched to the quinone sodium aggregate [3,5-DTBQNa]+(Fig. 18). However, in Fig. 19, complex 4 exhibits several peaks at m/z 797.05, 774.02, and 739.03 with line to line separation and these peaks were assigned to [NaZn2(Phimp)2(Cl)2]+, [Zn2(Phimp)2(Cl)2]+ and [Zn2(Phimp)2Cl]+. When complex 4 reacted with o-aminophenol (OAPH), the spectrum showed dissociation of one chloride ion to form a monoadduct of o-aminophenol with the sodium aggregate, which was assigned as [NaZn2(Phimp)2Cl(OAP)]+, and this peak appeared at m/z 870.07 (shown in Fig. 19). Two other peaks at m/z 213.04 and 235.05 were attributed to the protonated species of 2-aminophenoxazine-3-one and a sodium aggregate of 2-aminophenoxazine-3-one respectively (Fig. 19). These data show the dissociation of a chloride ion, which will facilitate the monodentate chelation of catechol and o-aminophenol to the zinc complexes, and support our mechanistic pathway.
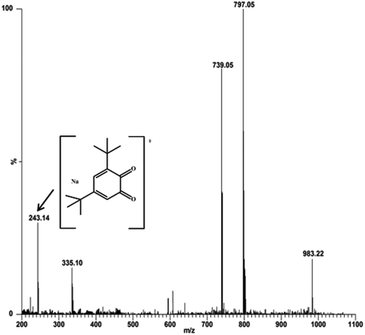 | ||
Fig. 18 Electrospray ionization mass spectrum (ESI-MS positive mode) of a 1![[thin space (1/6-em)]](https://www.rsc.org/images/entities/char_2009.gif) : :![[thin space (1/6-em)]](https://www.rsc.org/images/entities/char_2009.gif) 100 mixture of complex 4 and 3,5-DTBC in methanol, recorded after 30 minutes. 100 mixture of complex 4 and 3,5-DTBC in methanol, recorded after 30 minutes. | ||
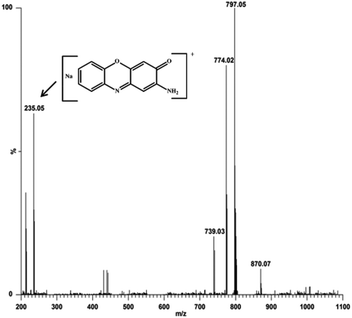 | ||
Fig. 19 Electrospray ionization mass spectrum (ESI-MS positive mode) of a 1![[thin space (1/6-em)]](https://www.rsc.org/images/entities/char_2009.gif) : :![[thin space (1/6-em)]](https://www.rsc.org/images/entities/char_2009.gif) 100 mixture of complex 4 and o-aminophenol in methanol/acetonitrile, recorded after 30 minutes. 100 mixture of complex 4 and o-aminophenol in methanol/acetonitrile, recorded after 30 minutes. | ||
Das and co-workers22 described a mechanism for zinc complexes derived from compartmental ligands that involved the reduction of an imine function during the catecholase activity study. We would like to mention that the following few observations prompted us to predict that the above reaction pathway occurs with our diphenoxo-bridged dinuclear zinc complexes. First, these complexes (1–4) have a tendency to be oxidised to generate phenoxyl radical complexes. EPR spectra of complex 1 authenticated the same. The complexes also provided broad NMR signals and we did not find generation of reduced species in the cyclic voltammetry studies. Second, the DFT calculations clearly depicted the presence of electron density close to the phenolato function. Third, these complexes are similar to the complexes reported by Reedijk and co-workers,29 which have a Zn2O2 moiety and provided oxidative activity.
Conclusions
The following are the major findings and conclusions of our study.(a) Diphenoxo bridged dinuclear zinc complexes derived from meridional tridentate ligands were synthesized and characterized. The molecular structures of representative complexes 1 and 3·CH3CN were determined using X-ray crystallography and a cis orientation of the chloride ions along the Zn–Zn axis gave rise to coordination of catechol and o-aminophenol and their oxidation.
(b) We performed theoretical calculations and discovered the non-innocent behavior of the ligands in these complexes. The HOMO and LUMO were found to have a negligible contribution from the zinc. TD-DFT calculations were used to explain the spectral bands obtained during the UV-Vis absorption spectral studies and the transitions were mainly of the intraligand charge transfer (ILCT) type.
(c) Electron donating substituent(s) (–OMe) on the phenyl ring containing phenolato function afforded a better stability of the phenoxyl radical complexes. Complex 1 gave rise to a stable phenoxyl radical complex and the order of the stability of the generated phenoxyl radicals was found to be complex 1 > complex 2 > complex 4 > complex 3.
(d) The complexes were utilized for catalytic oxidation of benzyl alcohol. A combination of the zinc complex and TBHP/TEMPO was found to be suitable for oxidation of the benzyl alcohol to benzaldehyde. Complex 1 was found to be most effective and complex 3 was found to be the least effective for such an oxidation.
(e) These complexes exhibited catechol oxidase and o-aminophenol oxidase activity and this was investigated. We proposed a possible mechanism for the catechol oxidase as well as the o-aminophenol oxidase reaction and performed theoretical calculations to support our mechanism. Participation of radical intermediate(s) during the oxidase activity studies was confirmed through EPR as well as ESI-MS spectral studies.
(f) The order of the activity was found to be complex 1 > complex 2 > complex 4 > complex 3 for both the catechol oxidase and o-aminophenol oxidase processes. Hence we found that the complex will be more active if the complex is capable of generating a more stable phenoxyl radical. Compared to reported results, complex 1 was found to be more efficient in terms of the catecholase activity when compared with the activity of other known complexes.22
Experimental section
Physical methods and materials
Chemicals were purchased from Sigma, S. D. Fine, Alfa Aesar and Merck, and used without further purification. Solvents were dried according to a standard method and distilled prior to use. 2-Hydroxy-5-methylbenzaldehyde and 2-hydroxy-5-methoxylbenzaldehyde were prepared according to a literature method.25 Anhydrous zinc chloride was purchased from S. D. Fine. Elemental analyses (carbon, hydrogen, and nitrogen) were performed using a Perkin-Elmer 240C analyzer. Infrared spectra (4000–400 cm−1) were obtained at 25 °C with a Thermo FTIR-8400S using KBr as the medium. Electronic spectra (800–200 nm) were obtained at 25 °C using a Shimadzu UV-3101 PC, where dry acetonitrile was used as the medium as well as the reference. Mass spectra were obtained using a direct inlet system (70 eV) with a detector (ES, 4000 V) and a Perkin Elmer GC-MS. The electron paramagnetic resonance (EPR) experiments were conducted at 25 °C in pure methanol and a methanol + acetonitrile solvent system using a Bruker ECS-106 instrument equipped with an Oxford Instruments variable-temperature liquid helium cryostat with a 9.86 GHz microwave frequency and 100 KHz modulation frequency. Cyclic voltammetry studies were performed using acetonitrile solutions containing 0.1 M TBAP (tetrabutyl ammonium perchlorate) at 25 °C using a three-electrode configuration (Pt working electrode, Pt counter electrode, Ag/AgCl reference) and a PC controlled PAR model 273A electrochemistry system. 1H NMR spectra (400 MHz) were recorded in (CD3)2SO solvent using a Jeol Resonance ECX 400II NMR spectrometer.Synthesis of the ligands
The ligands were prepared using the same experimental method as that reported earlier.11,12 Substituted salicylaldehydes were prepared by formylation of the corresponding phenols using a reported procedure.25,26Synthesis of the metal complexes
![[double bond, length as m-dash]](https://www.rsc.org/images/entities/char_e001.gif) N), 1652, 1561, 1485, 1415, 1346, 1020, 651. UV-vis (acetonitrile) λmax (nm) [ε in M−1 cm−1]: 298 (27
N), 1652, 1561, 1485, 1415, 1346, 1020, 651. UV-vis (acetonitrile) λmax (nm) [ε in M−1 cm−1]: 298 (27![[thin space (1/6-em)]](https://www.rsc.org/images/entities/char_2009.gif) 660), 413 (523).
660), 413 (523).
![[double bond, length as m-dash]](https://www.rsc.org/images/entities/char_e001.gif) N), 1648, 1561, 1479, 1424, 1332, 1305, 1289, 1020, 850, 753, 703, 552. UV-vis (acetonitrile) λmax (nm) [ε in M−1 cm−1]: 380 (18
N), 1648, 1561, 1479, 1424, 1332, 1305, 1289, 1020, 850, 753, 703, 552. UV-vis (acetonitrile) λmax (nm) [ε in M−1 cm−1]: 380 (18![[thin space (1/6-em)]](https://www.rsc.org/images/entities/char_2009.gif) 600), 410 (532).
600), 410 (532).
![[double bond, length as m-dash]](https://www.rsc.org/images/entities/char_e001.gif) N), 1651, 1651, 1565, 1478, 1413, 1330, 1308, 1283, 1225, 1191, 1082, 1018, 962, 830, 761, 648. UV-vis (acetonitrile) λmax (nm) [ε in M−1 cm−1]: 310 (35
N), 1651, 1651, 1565, 1478, 1413, 1330, 1308, 1283, 1225, 1191, 1082, 1018, 962, 830, 761, 648. UV-vis (acetonitrile) λmax (nm) [ε in M−1 cm−1]: 310 (35![[thin space (1/6-em)]](https://www.rsc.org/images/entities/char_2009.gif) 052), 426 (439).
052), 426 (439).
![[double bond, length as m-dash]](https://www.rsc.org/images/entities/char_e001.gif) N), 1661, 1605, 1559, 1484, 1439, 1348, 1305, 1211, 1155, 1067, 960, 898, 810, 765, 696, 565. UV-vis (acetonitrile) λmax (nm) [ε in M−1 cm−1]: 330 (16
N), 1661, 1605, 1559, 1484, 1439, 1348, 1305, 1211, 1155, 1067, 960, 898, 810, 765, 696, 565. UV-vis (acetonitrile) λmax (nm) [ε in M−1 cm−1]: 330 (16![[thin space (1/6-em)]](https://www.rsc.org/images/entities/char_2009.gif) 501), 367 (15
501), 367 (15![[thin space (1/6-em)]](https://www.rsc.org/images/entities/char_2009.gif) 263).
263).
Computational details
DFT calculations were performed for all the ligands, namely OMe-PhimpH, Me-PhimpH, N-PhimpH and PhimpH, as well as their dinuclear zinc complexes 1, 2, 3·CH3CN and 4. The geometrical structures were optimized using DFT27 and time-dependent DFT(TDDFT)27 methods with the B3LYP exchange correlation function.27 On the basis of the optimized geometry structures of the ligands, absorption values were calculated using time-dependent density functional theory (TDDFT). Due to the presence of an electronic correlation in the TDDFT (B3LYP) method, it can yield more accurate electronic excitation energies. The basis set LANL2DZ was used for the valence shell.27 Frontier molecular orbitals were prepared using the GaussView 5.0 software. All the DFT calculations were performed with the help of a Gaussian 09 W software package.28 GaussSum 2.1 was used to calculate the molecular orbital contributions from particular groups or atoms.Benzyl alcohol oxidation
Oxidation of the benzyl alcohol (primary alcohol) was carried out in the presence of molecular oxygen. The reactions of benzyl alcohol oxidation were performed in 50 mL round-bottom flasks equipped with condensers under molecular oxygen. Two different types of reaction set up were investigated for this oxidation chemistry. The first TEMPO and TBHP method: to 5.0 mL of a 1![[thin space (1/6-em)]](https://www.rsc.org/images/entities/char_2009.gif) :
:![[thin space (1/6-em)]](https://www.rsc.org/images/entities/char_2009.gif) 2 (v/v) MeCN/0.1 M K2CO3 aqueous solution, 3.0 mmol of benzyl alcohol, 3 μmol (0.1 mol% vs. substrate) of the catalyst, 0.15 mmol (5 mol% vs. substrate) of TEMPO and 0.5 mmol of TBHP were added. For the second method, complexes (1–4) (0.01 mmol) were dissolved in 15 mL of acetonitrile solvent. Then to this solution, 1 mmol of benzyl alcohol and 0.5 mmol of a TBHP solution (20% solution in methanol) were added. For both reaction methods, the reaction mixture was allowed to stir under oxygen at 70 °C. After 24 hours, the organic layer was extracted with heptane. The combined organic layers were washed with water (pH = 4), then dried over anhydrous Na2SO4, and the organic products were quantified using GC-MS. In the absence of TEMPO and TBHP, negligible reaction product was observed.
2 (v/v) MeCN/0.1 M K2CO3 aqueous solution, 3.0 mmol of benzyl alcohol, 3 μmol (0.1 mol% vs. substrate) of the catalyst, 0.15 mmol (5 mol% vs. substrate) of TEMPO and 0.5 mmol of TBHP were added. For the second method, complexes (1–4) (0.01 mmol) were dissolved in 15 mL of acetonitrile solvent. Then to this solution, 1 mmol of benzyl alcohol and 0.5 mmol of a TBHP solution (20% solution in methanol) were added. For both reaction methods, the reaction mixture was allowed to stir under oxygen at 70 °C. After 24 hours, the organic layer was extracted with heptane. The combined organic layers were washed with water (pH = 4), then dried over anhydrous Na2SO4, and the organic products were quantified using GC-MS. In the absence of TEMPO and TBHP, negligible reaction product was observed.
Catecholase and o-aminophenol oxidase activity
The catecholase activity was investigated by examining the oxidation of 3,5-di-tert-butylcatechol (the standard substrate) in acetonitrile solution. For this purpose, 10−4 M solutions of complexes 1, 2, 3·CH3CN and 4 were added to 100 equivalents of the substrate in acetonitrile under aerobic conditions at 25 °C, and the activity was measured using a UV-vis spectrophotometer. The same experiment was repeated under two different experimental conditions. First, the reaction was performed in the presence of TEMPO. Second, the same reaction was repeated under anaerobic conditions.Similarly for the o-aminophenol oxidase (phenoxazinone synthase) activity, o-aminophenol was used as the substrate. A 10−1 M stock solution of o-aminophenol in methanol was prepared. For this activity study, 10−4 M solutions of the complexes were added to 100 equivalents of the substrate in acetonitrile under aerobic conditions at 25 °C, and the activity was measured using a UV-vis spectrophotometer. After completion of the reaction, the solution of the mixture was passed through a silica gel column and then eluted with methanol solvent, and after that the product was quantified using the GC mass instrument. Similar to the catecholase activity study, the reactions were investigated in the presence of TEMPO and under anaerobic conditions for creation of the radical mechanism.
Acknowledgements
K. G. is thankful to SERB-DST (SR/S1/IC-47/2012 dated Oct 2013), New Delhi, India for financial assistance. AKD is thankful to UGC for financial assistance. We are thankful for the Central Instrumental Facility, IIT Roorkee.References
- A. B. Jazdzewski and B. W. Tolman, Coord. Chem. Rev., 2000, 200–212, 633–685 CrossRef
.
- L. Que and W. B. Tolman, Nature, 2008, 455, 333–340 CrossRef CAS PubMed
.
- J. W. Whittaker, Chem. Rev., 2003, 103, 2347–2363 CrossRef CAS PubMed
.
- C. D. Borman, C. G. Saysell and A. Sokolowski, Coord. Chem. Rev., 1999, 190–192, 771–779 CrossRef CAS
.
- C. T. Lyons and P. D. Stack, Coord. Chem. Rev., 2013, 257, 528–540 CrossRef CAS PubMed
.
- M. M. Whittaker, Y. Y. Chuang and J. W. Whittaker, J. Am. Chem. Soc., 1993, 115, 10029–10035 CrossRef CAS
.
- S. Itoh, H. Kumei, S. Nagatomo, T. Kitagawa and S. Fukuzumi, J. Am. Chem. Soc., 2001, 123, 2165–2175 CrossRef CAS PubMed
.
- M. Orio, C. Philouze, O. Jariaves, F. Neese and F. Thomas, Inorg. Chem., 2010, 49, 646–658 CrossRef CAS PubMed
.
-
(a) E. Bill, J. Muller, T. Weyhermuller and K. Wieghardt, Inorg. Chem., 1999, 38, 5795–5802 CrossRef CAS
; (b) A. Sokolowski, J. Muller, T. Weyhermuller, R. Schnepf, P. Hildebrandt, K. Hildenbrand, E. Bothe and K. Wieghardt, J. Am. Chem. Soc., 1997, 119, 8889–8900 CrossRef CAS
; (c) P. Chaudhuri, M. Hess, J. Muller, K. Hildenbrand, E. Bill, T. Wayhermuller and K. Wieghardt, J. Am. Chem. Soc., 1999, 121, 9599–9610 CrossRef CAS
.
- K. Ghosh, P. Kumar, N. Tyagi, U. P. Singh, V. Aggarwal and M. C. Baratto, Eur. J. Med. Chem., 2010, 45, 3770–3779 CrossRef CAS PubMed
.
- K. Ghosh, P. Kumar, V. Mohan, S. Kasiri and S. S. Mandal, Inorg. Chem., 2012, 51, 3343–3345 CrossRef CAS PubMed
.
- K. Ghosh, P. Kumar, N. Tyagi and U. P. Singh, Inorg. Chem., 2010, 49, 7614–7616 CrossRef CAS PubMed
.
- I. A. Koval, P. Gamez, C. Belle, K. Selmeczi and J. Reedijk, Chem. Soc. Rev., 2006, 35, 814–840 RSC
.
- R. Than, A. A. Feldmann and B. Krebs, Coord. Chem. Rev., 1996, 182, 211–241 CrossRef
.
- E. I. Solomon, U. M. Sundaram and T. E. Machonkin, Chem. Rev., 1996, 96, 2563–2606 CrossRef CAS PubMed
.
- N. Kitajima and Y. Morooka, Chem. Rev., 1994, 94, 737–757 CrossRef CAS
.
- T. Klabunde, C. Eicken, J. C. Sacchettini and B. Krebs, Nat. Struct. Biol., 1998, 5, 1084–1090 CrossRef CAS PubMed
.
- C. Eicken, B. Krebs and J. C. Sacchettini, Curr. Opin. Struct. Biol., 1999, 9, 677–683 CrossRef CAS PubMed
.
- C. Ger demann, C. Eicken and B. Krebs, Acc. Chem. Res., 2002, 35, 183–191 CrossRef CAS
.
- S. Majumder, S. Sarkar, S. Sasmal, E. C. Sanudo and S. Mohanta, Inorg. Chem., 2011, 50, 7540–7554 CrossRef CAS PubMed
.
- A. W. Smith, A. C. Artigas, M. Wang, J. P. Allen and W. A. Francisco, Biochemistry, 2006, 45, 4378–4387 CrossRef CAS PubMed
.
- A. Guha, T. Chattopadhyay, N. D. Paul, M. Mukherjee, S. Goswami, T. K. Mondal, E. Zangrando and D. Das, Inorg. Chem., 2012, 51, 8750–8759 CrossRef CAS PubMed
.
- D. Dey, G. Kaur, A. Ranjani, L. Gayathri, P. Chakraborty, J. Adhikary, J. Pasan, D. Dhanasekaran, A. R. Choudhury, M. A. Akbarsha, N. Kole and B. Biswas, Eur. J. Inorg. Chem., 2014, 3350–3358 CrossRef CAS
.
- K. Ghosh, N. Tyagi, P. Kumar, U. P. Singh and N. Goel, J. Inorg. Biochem., 2010, 104, 9–18 CrossRef CAS PubMed
.
- N. U. Hofsløkken and L. Skattebøl, Acta Chem. Scand., 1999, 53, 258–262 CrossRef
.
- T. V. Hansena and L. Skattebøl, Tetrahedron Lett., 2005, 46, 3357–3358 CrossRef
.
-
(a)
T. H. Dunning, Jr. and P. J. Hay, Modern Theoretical Chemistry, Plenum, New York, 1976, vol. 3 Search PubMed
; (b) P. J. Hay and W. R. Wadt, J. Chem. Phys., 1985, 82, 270–283 CrossRef CAS
; (c) A. D. Becke, Phys. Rev. A: At., Mol., Opt. Phys., 1988, 38, 3098 CrossRef CAS
; (d) A. D. Becke, J. Chem. Phys., 1993, 98, 5648–5652 CrossRef CAS
; (e) C. Lee, W. Yang and R. G. Parr, Phys. Rev. B: Condens. Matter, 1988, 37, 785–789 CrossRef CAS
; (f) P. J. Hay and W. R. Wadt, J. Chem. Phys., 1985, 82, 299–310 CrossRef CAS
; (g) P. J. Hay and W. R. Wadt, J. Chem. Phys., 1985, 82, 284–298 CrossRef
.
-
M. J. Frisch, G. W. Trucks, H. B. Schlegel, G. E. Scuseria, M. A. Robb, J. R. Cheeseman, G. Scalmani, V. Barone, B. Mennucci, G. A. Petersson, H. Nakatsuji, M. Caricato, X. Li, H. P. Hratchian, A. F. Izmaylov, J. Bloino, G. Zheng, J. L. Sonnenberg, M. Hada, M. Ehara, K. Toyota, R. Fukuda, J. Hasegawa, M. Ishida, T. Nakajima, Y. Honda, O. Kitao, H. Nakai, T. Vreven, Jr.J. A. Montgomery, J. E. Peralta, F. Ogliaro, M. Bearpark, J. J. Heyd, E. Brothers, K. N. Kudin, V. N. Staroverov, T. Keith, R. Kobayashi, J. Normand, K. Raghavachari, A. Rendell, J. C. Burant, S. S. Iyengar, J. Tomasi, M. Cossi, N. Rega, J. M. Millam, M. Klene, J. E. Knox, J. B. Cross, V. Bakken, C. Adamo, J. Jaramillo, R. Gomperts, R. E. Stratmann, O. Yazyev, A. J. Austin, R. Cammi, C. Pomelli, J. W. Ochterski, R. L. Martin, K. Morokuma, V. G. Zakrzewski, G. A. Voth, P. Salvador, J. J. Dannenberg, S. Dapprich, A. D. Daniels, O. Farkas, J. B. Foresman, J. V. Ortiz, J. Cioslowski and D. J. Fox, Gaussian 09, Revision A01, Gaussian, Inc., Wallingford, CT, 2009 Search PubMed
.
- P. U. Maheswari, S. Barends, S. O. Yaman, P. D. Hoog, H. Casellas, S. J. Teat, C. Massera, M. Lutz, A. L. Spek, G. P. V. Wezel, P. Gamez and J. Reedijk, Chem. – Eur. J., 2007, 13, 5213–5222 CrossRef CAS PubMed
.
- P. D. Hoog, L. D. Pachon, P. Gamez, M. Lutz, A. L. Spek and J. Reedijk, Dalton Trans., 2004, 2614–2615 RSC
.
- K. Ghosh, P. Kumar and N. Tyagi, Inorg. Chim. Acta, 2011, 375, 77–83 CrossRef CAS
.
-
G. R. Desiraju and T. Steiner, The Weak Hydrogen Bond in Structural Chemistry and Biology, Oxford University Press, New York, 1999 Search PubMed
.
-
(a) S. Ghosh, G. K. Chaitanya and K. Bhanuprakash, Inorg. Chem., 2006, 45, 7600–7611 CrossRef CAS PubMed
; (b) A. S. Smirnov, E. S. Butukhanova, N. A. Bokach, G. L. Starova, V. V. Gurzhiy, M. L. Kuznetsov and V. Y. Kukushkin, Dalton Trans., 2014, 43, 15798–15811 RSC
.
- K. S. Banu, T. Chattopadhyay, A. Banerjee, S. Bhattacharaya, E. Suresh, M. Nethaji, E. Zangrando and D. Das, Inorg. Chem., 2008, 47, 7083–7093 CrossRef CAS PubMed
.
- C. Belle, C. Beguin, I. Gautier-Luneau, S. Hamman, C. Philouze, J. L. Pierre, F. Thomas and S. Torelli, Inorg. Chem., 2002, 41, 479–491 CrossRef CAS PubMed
.
- S. Torelli, C. Belle, I. Gautier-Luneau, J. L. Pierre, E. Saint-Aman, J. M. Latour, L. Le Pape and D. Luneau, Inorg. Chem., 2000, 39, 3526–3536 CrossRef CAS PubMed
.
- K. D. Karlin, Y. Gultneh, T. Nicholson and J. Zubieta, Inorg. Chem., 1985, 24, 3725–3727 CrossRef CAS
.
- J. Reim and B. Krebs, J. Chem. Soc., Dalton Trans., 1997, 3793–3804 RSC
.
- A. Mondal, S. Sarkar, D. Chopra, T. N. Guru Row, K. Pramanik and K. K. Rajak, Inorg. Chem., 2005, 44, 703–708 CrossRef CAS PubMed
.
- S. Itoh and S. Fukuzumi, Acc. Chem. Res., 2007, 40, 592–600 CrossRef CAS PubMed
.
- M. Ruf, B. C. Noll, M. D. Groner, G. T. Yee and C. G. Pierpont, Inorg. Chem., 1997, 36, 4860–4865 CrossRef CAS PubMed
.
- S. Fukuzumi, L. Tahsini, Y. M. Lee, K. Ohkubo, W. Nam and K. D. Karlin, J. Am. Chem. Soc., 2012, 134, 7025–7035 CrossRef CAS PubMed
.
- S. Majumder, S. Mondal, P. Lemonie and S. S. Mohanta, Dalton Trans., 2013, 42, 4561–4569 RSC
.
- M. R. Mendoza-Quijano, G. Ferrer-Sueta, M. Flores-Alamo, N. Aliaga-Alcalde, V. Gomez-Vidales, V. M. Ugalde-Saldívar and L. Gasque, Dalton Trans., 2012, 41, 4985–4997 RSC
.
- A. Banerjee, S. Sarkar, D. Chopra, E. Colacio and K. K. Rajak, Inorg. Chem., 2008, 47, 4023–4031 CrossRef CAS PubMed
.
- A. Biswas, L. K. Das, M. G. B. Drew, C. Diaz and A. Ghosh, Inorg. Chem., 2012, 51, 10111–10121 CrossRef CAS PubMed
.
- A. Neves, L. M. Rossi, A. J. Bortoluzzi, B. Szpoganicz, C. Wiezbicki, E. Schwingel, W. Haase and S. Ostrovsky, Inorg. Chem., 2002, 41, 1788–1794 CrossRef CAS PubMed
.
- S. Majumder, S. Sarkar, S. Sasmal, E. C. Sanudo and S. Mohanta, Inorg. Chem., 2011, 50, 7540–7554 CrossRef CAS PubMed
.
- N. A. Rey, A. Neves, A. J. Bortoluzzi, C. T. Pich and H. Terenzi, Inorg. Chem., 2007, 46, 348–350 CrossRef CAS PubMed
.
- A. Biswas, L. K. Das, M. G. B. Drew, G. Aromí, P. Gamez and A. Ghosh, Inorg. Chem., 2012, 51, 7993–8001 CrossRef CAS PubMed
.
- L. K. Das, A. Biswas, J. S. Kinyon, N. S. Dalal, H. Zhou and A. Ghosh, Inorg. Chem., 2013, 52, 11744–11757 CrossRef CAS PubMed
.
- J. S. Thompson and J. C. Calabrese, Inorg. Chem., 1985, 24, 3167–3171 CrossRef CAS
.
- M. Mitra, P. Raghavaiah and R. Ghosh, New J. Chem., 2015, 39, 200–205 RSC
.
- M. Das, R. Nasani, M. Saha, S. M. Mobin and S. Mukhopadhyay, Dalton Trans., 2015, 44, 2299–2310 RSC
.
- R. Sanyal, S. K. Dash, S. Das, S. Chattopadhyay, S. Roy and D. Das, J. Biol. Inorg. Chem., 2014, 19, 1099–1111 CrossRef CAS PubMed
.
- V. K. Bhardwaj, N. Aliaga-Alcalde, M. Corbella and G. Hundal, Inorg. Chim. Acta, 2010, 363, 97–106 CrossRef CAS
.
-
F. Weinhold and C. A. Landis, Valency and Bonding: A Natural Bond Orbital Donor–Acceptor Perspective, Cambridge University Press, Cambridge, 2005 Search PubMed
.
- J. N. Harveya and R. Poli, Dalton Trans., 2003, 4100–4106 RSC
.
- A. Y. Rogachev and R. Hoffmann, J. Am. Chem. Soc., 2013, 135, 3262–3275 CrossRef CAS PubMed
.
Footnote |
| † Electronic supplementary information (ESI) available. CCDC 1419324 and 1419325. For ESI and crystallographic data in CIF or other electronic format see DOI: 10.1039/c6qi00356g |
| This journal is © the Partner Organisations 2016 |

