Infrared spectra of methanol desorption in a He stream and under vacuum on CeO2 and ZrO2 catalyst surfaces
Lei Chen and
Shengping Wang*
Key Laboratory for Green Chemical Technology, Department of Chemical Technology, School of Chemical Engineering and Technology, Tianjin University, Collaborative Innovation Center of Chemical Science and Engineering, Tianjin 300072, China. E-mail: spwang@tju.edu.cn
First published on 5th February 2016
Abstract
Infrared spectra of methanol desorption in a He stream and under vacuum on CeO2 and ZrO2 catalyst surfaces are added for the article (RSC Adv., 2014, 4, 30968) as a response to the letter of Dr F. C. Meunier (RSC Adv., 2016, 6, 17288) and to make the ascription of the bands at 1096, 1054, 1032 and 1012 cm−1 more convincing. After putting under vacuum, the bands at 1096, 1054, 1032 and 1012 cm−1 still exist, which indicates that these bands are ascribed to chemisorbed methoxy.
In our work,1 the infrared spectra of methanol adsorption on ceria catalysts contain the features of methanol in the gas phase, appearing at 1054, 1031 and 1012 cm−1 (Fig. 2 in ref. 1), because they are carried out during the methanol adsorption process. However, these peaks are still noted when CeO2 or ZrO2 samples containing preadsorbed methanol are exposed to a He stream for 0.5 h followed by half an hour evacuation to 10−4–10−5 Pa in order to remove the methanol in the gas phase before other adsorbates are introduced. Therefore, these peaks are ascribed to chemisorbed methoxy in our paper. Here, we add infrared spectra with the conditions of complete desorption of methanol gas under vacuum on CeO2 and ZrO2 catalysts to make the ascription of the bands at 1096, 1054, 1032, and 1012 cm−1 more clear and convincing.
The infrared spectra of methanol desorption in a He stream for 0.5 h on CeO2 and ZrO2 are exhibited in Fig. 1. The peaks at 1096 and 1012 cm−1 on the ceria catalyst are ascribed to ν(CO) of on-top methoxy and three coordinate methoxy. The peaks at 1054 and 1032 cm−1 correspond to bridging methoxy on the CeO2 surface.2 On the zirconium surface, features around 1162 and 1032 cm−1 are visible, which are associated with on-top methoxy and bidentate methoxy during methanol desorption.3
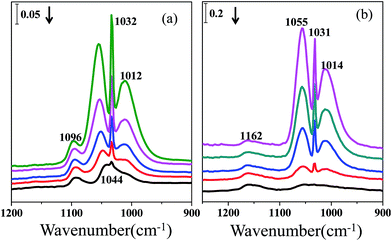 | ||
| Fig. 1 Infrared spectra of the catalysts containing preadsorbed methanol exposed to a He stream for 0.5 h: (a) CeO2 (b) ZrO2. | ||
To further clarify the methanol adsorption on the ceria samples, four more experiments were carried out under the same experimental conditions. Fig. 2 exhibits the infrared spectra of methanol adsorption and desorption on a CaF2 sample, which is inert to methanol. As shown in Fig. 2, bands at 1057, 1033 and 1012 cm−1 appear when methanol is introduced. When the sample containing preadsorbed methanol is exposed to a He stream, the bands appearing during the adsorption process all decrease and eventually disappear. So, the peaks at 1057, 1033 and 1012 cm−1 are ascribed to methanol in the gas phase, which is in accordance with the results of Dr Meunier.4
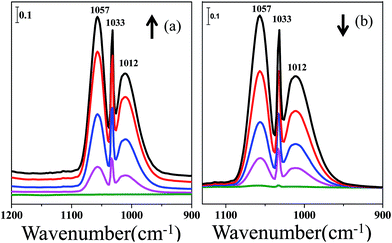 | ||
| Fig. 2 Infrared spectra of methanol adsorption and desorption on CaF2: (a) methanol adsorption, (b) methanol desorption in a He stream. | ||
Additionally, a mixed CeO2 and CaF2 sample with a weight ratio of 1![[thin space (1/6-em)]](https://www.rsc.org/images/entities/char_2009.gif) :
:![[thin space (1/6-em)]](https://www.rsc.org/images/entities/char_2009.gif) 20 was exposed to methanol. The He stream was followed by half an hour evacuation. The vacuum degree during the evacuation was 10−4 to 10−5 Pa. The infrared spectra are shown in Fig. 3. From Fig. 3(a) and (b), the peaks at 1106, 1057, 1033 and 1012 cm−1 show a similar tendency to those of the pure ceria samples during the processes of methanol adsorption and methanol desorption in a He stream. The infrared spectra of the sample during the evacuation are shown in Fig. 3(c). The features at 1106, 1057, 1033 and 1012 cm−1 all decrease, but they can still be observed during the evacuation process. According to the results from the CaF2 experiment, methanol in the gas phase can be almost removed when the sample is exposed to a He stream. Therefore, we prefer to ascribe these bands to the desorption of weakly chemisorbed methoxy on the ceria surface.
20 was exposed to methanol. The He stream was followed by half an hour evacuation. The vacuum degree during the evacuation was 10−4 to 10−5 Pa. The infrared spectra are shown in Fig. 3. From Fig. 3(a) and (b), the peaks at 1106, 1057, 1033 and 1012 cm−1 show a similar tendency to those of the pure ceria samples during the processes of methanol adsorption and methanol desorption in a He stream. The infrared spectra of the sample during the evacuation are shown in Fig. 3(c). The features at 1106, 1057, 1033 and 1012 cm−1 all decrease, but they can still be observed during the evacuation process. According to the results from the CaF2 experiment, methanol in the gas phase can be almost removed when the sample is exposed to a He stream. Therefore, we prefer to ascribe these bands to the desorption of weakly chemisorbed methoxy on the ceria surface.
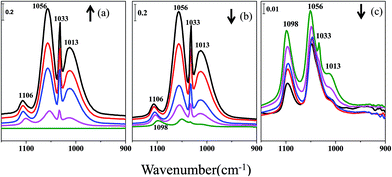 | ||
| Fig. 3 Infrared spectra of methanol adsorption and desorption on a mixed sample: (a) methanol adsorption, (b) methanol desorption in a He stream, (c) methanol desorption under evacuation. | ||
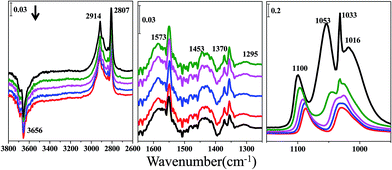
Furthermore, the infrared spectra of methanol desorption from the ceria and zirconium samples in a He stream for 0.5 h followed by half an hour evacuation to 10−4–10−5 Pa are shown in Fig. 4 and 5. Fig. 4 shows the infrared spectra of methanol desorption from the ceria samples. Features at 1100, 1053 and 1016 cm−1, which correspond to ν(CO), can still be detected and are attributed to on-top methoxy, bridging methoxy and three coordinate methoxy, respectively. The band at 1033 cm−1 may be ascribed to bridging methoxy. Features for bridging methoxy and three coordinate methoxy combine with each other during the evacuation process. In the ν(CH3) region there is one type of vibration: bands at 2807 and 2914 cm−1 are associated with the modes of ν(CH3) and νas(CH3) of chemisorbed methoxy. Bands at 1573, 1453 and 1370 cm−1 representing monodentate methyl carbonate are weakly observed, and this compound results from the reaction between methanol and adsorbed CO2 on ceria. A band around 1295 cm−1 has been discussed in our published paper in detail.1 The negative feature around 3656 cm−1 represents the OH groups decreasing during methanol adsorption.
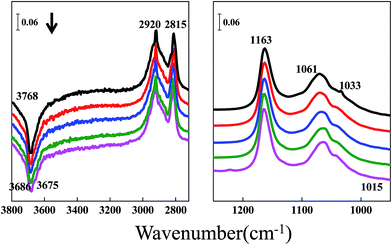
The spectra of the methanol successive desorption from the zirconium sample in a He stream for 0.5 h followed by half an hour evacuation to 10−4 to 10−5 Pa are shown in Fig. 5. The bands at 1163 and 1033 cm−1 are assigned to the bending vibration of the methoxy groups, while those at 2815 and 2920 cm−1 are associated with the C–H stretching vibration of the bidentate and monodentate methoxy groups. The bands at 3768, 3686 and 3675 cm−1 are ascribed to different types of OH groups on the ZrO2 surface. The region between 1250 and 1650 cm−1 is not shown because no apparent peaks appear, indicating the absence of monodentate methyl carbonate. Comparing Fig. 5 with Fig. 4, chemisorbed methoxy can be detected on both of these two catalysts. The difference between ceria and zirconium is the presence of monodentate methyl carbonate and the feature around 1295 cm−1.
Conclusions
Infrared spectra of methanol desorption in a He stream for 0.5 h followed by half an hour evacuation to 10−4 to 10−5 Pa on CeO2 and ZrO2 catalyst surfaces are added for the article1 to make the ascription of the bands at 1096, 1054, 1032, and 1012 cm−1 more convincing. After putting under vacuum, the bands at 1096, 1054, 1032 and 1012 cm−1 still exist, which indicates that these bands are ascribed to chemisorbed methoxy.Notes and references
- L. Chen, S. Wang, J. Zhou, Y. Shen, Y. Zhao and X. Ma, RSC Adv., 2014, 4, 30968–30975 RSC.
- S. Rousseau, O. Marie, P. Bazin, M. Daturi, S. Verdier and V. Harle, J. Am. Chem. Soc., 2010, 132, 10832–10842 CrossRef CAS PubMed.
- C. Binet and M. Daturi, Catal. Today, 2001, 70, 155–167 CrossRef CAS.
- F. C. Meunier, RSC Adv., 2016, 6, 17288–17289 RSC.
| This journal is © The Royal Society of Chemistry 2016 |

