Highly stable Ni/SiC catalyst modified by Al2O3 for CO methanation reaction†
Guojing Jinab,
Fangna Gu*b,
Qing Liub,
Xiaoyan Wangb,
Lihua Jia*a,
Guangwen Xub,
Ziyi Zhongc and
Fabing Su*b
aCollege of Chemistry and Chemical Engineering, Qiqihaer University, Qiqihaer 161006, Heilongjiang Province, China. E-mail: jlh29@163.com; Fax: +86-10-82544851; Tel: +86-10-82544850
bState Key Laboratory of Multiphase Complex Systems, Institute of Process Engineering, Chinese Academy of Sciences, Beijing 100190, China. E-mail: fngu@ipe.ac.cn; fbsu@ipe.ac.cn
cInstitute of Chemical Engineering and Sciences, A*star, 1 Pesek Road, Jurong Island 627833, Singapore
First published on 15th January 2016
Abstract
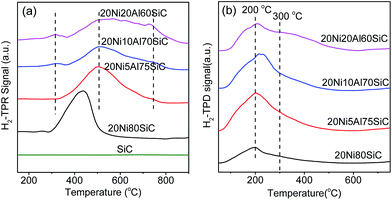
It is still a great challenge to prevent sintering of supported Ni catalysts in highly exothermic reactions. To address this problem, in this work, highly thermal conductive and stable SiC is explored as a Ni catalyst support for CO methanation to produce synthetic natural gas; simultaneously, Al2O3 is utilized to modify the SiC surface to enhance the interaction between the metal and support and restrain the Ni active component from sintering or loss during the reaction. A series of Ni/Al2O3–SiC catalysts were successfully prepared by the co-deposition–precipitation method. The catalysts were investigated by N2 adsorption, XRD, SEM/EDS, TEM, XPS, H2-TPR, H2-TPD and TG. The elemental mapping images indicated that the introduced Al2O3 particles were uniformly deposited on the surface of the SiC support, which evidently enhanced the interaction between Ni and the support by forming Ni–Al2O3 complexes as proved by H2-TPR results. The Ni/Al2O3–SiC catalyst with an optimal amount of Al2O3 content showed a high catalytic activity and strong resistance to sintering, which can be attributed to two main factors: (1) the addition of Al2O3 can enhance the interactions between Ni and the support, thus inhibiting the migration of Ni particles on the support surface and improving the dispersion of them; (2) the superior heat conductivity of SiC can decrease the generation of hot spots in the catalyst bed.
1. Introduction
Methanation of carbon oxides with hydrogen to produce methane has been widely used in many industrial processes such as substitute natural gas (SNG) synthesis, removal of trace amounts of CO from H2-rich feed gas or purification of the reformate gas for NH3 synthesis and fuel cell application, etc.1,2 In recent years, production of SNG from coal via the syngas methanation approach has attracted much interest in China due to the increasing demand for natural gas and the wish for clean utilization of coal resources.3 Methanation for SNG production is a highly exothermic reaction due to the high concentrations of carbon oxides: for every 1% CO and 1% CO2 conversion, the temperature increase of the gas composition in a typical methanator is 74 °C and 60 °C, respectively.4 The potential dramatic temperature increase may cause severe sintering of the catalyst, thus the design of catalysts with high stability at high temperature is necessary.Ni-based catalysts are preferred for syngas methanation due to their low cost, good availability, high activity, and the best selectivity to methane as compared to other metals.5 Many materials such as TiO2, Al2O3, CeO2, SiO2, YSZ and MgAl2O4 have been tested as the supports of Ni catalysts.6–9 However, these catalysts often suffer from fast sintering and deactivation due to the rapid heat accumulation on them during the methanation process. In order to improve the stability of Ni catalysts, various promoters,3,10,11 supports and12–14 preparation methods15,16 have been selected and tested. However, hot spots are still easily generated in the catalyst bed for the conventional catalysts due to their poor thermal conductivity. To solve this problem, a common way used in industry is to connect several methanation reactors in series and add numbers of intermediate gas coolers, and recycle the product gas to dilute the feed gas to control the reaction temperature. Hence, the whole process becomes quite complicated and difficult to control. Alternatively, highly thermo-conductive and thermo-stable materials can be employed as the support of CO methanation catalysts to alleviate the problem.
Silicon carbide (SiC) possesses superior thermal stability, high heat conductivity and chemical inertness,17 and has been used as catalyst support in many different reactions, including methane reforming18 and combustion,19 Fischer–Tropsch synthesis,20,21 isomerization22 and dehydrogenation,23 etc. However, the commercial SiC powders have very low specific surface areas, unfavorable for the dispersion of active components. In addition, due to the chemical inertness of SiC, it has weak interaction with metal particles which leads to the poor stability of catalyst. Recently, it has reported that SiC with high specific surface area has been synthesized by different methods, such as sol–gel method,24 polycarbosilane pyrolysis,25 porous carbon template,26 and nanocasting method27,28 using mesoporous silica (SBA-15 or MCM-48) as hard templates, etc. However, the above mentioned methods still have their shortcomings, including high complexity in synthesis, high cost, and the obtained SiC still has to be surface-modified as catalyst support due to its chemical inertness.
Wang et al. reported that Al2O3-modified biomorphic SiC pellets could prevent the growth and loss of Ni particles due to the enhanced interaction between Ni and support.29 Koo et al. verified that Al2O3 coating could enhance Co dispersion due to the formation of adjacently interacting Co–Al2O3 species.20 However, SiC used in these studies was usually synthesized by specific method or needed surface modification such as pre-coating Al2O3 prior to the use as catalyst support.
In this work, we report a different approach for the synthesis of Ni catalysts supported on SiC modified by Al2O3 for CO methanation, in which the Ni and Al2O3 components are deposited on the commercial SiC by co-deposition–precipitation method. The Al2O3 amount introduced and its effects on enhancing the dispersion and thermostability of Ni particles are investigated in detail.
2. Experimental
2.1. Catalyst preparation
All chemicals with analytical grade including aluminum nitrate nonahydrate (Al(NO3)3·9H2O), nickel(II) nitrate hexahydrate (Ni(NO3)2·6H2O) and potassium hydroxide (KOH) were purchased from Sinopharm Chemical Reagent Co. Ltd., China, and used without further treatment. The commercial SiC (purity >98%, Pingxiang Ruize Silicon Ceramic Co. Ltd., China) was calcined at 500 °C in air for 2 h before use. The impurities in the commercial SiC were quite low in concentration analyzed by X-ray fluorescence (XRF) (see Table S1†), and may have no impact to the catalytic reaction. Therefore, in this work, the SiC powder was used without further treatment. The Ni/Al2O3–SiC catalysts were prepared by the co-deposition–precipitation method. Typically, 3.50 g of the SiC support was added to a round bottom flask with 50 mL deionized water to form a slurry, then the obtained slurry was slowly heated to 60 °C in a water bath under vigorously stirring. Subsequently, 3.89 g of Ni(NO3)2·6H2O and 1.83 g of Al(NO3)3·9H2O were dissolved in 50 mL deionized water, respectively, followed by adding the above solutions into the slurry by dropwise in a parallel flow form, meanwhile 0.1 M KOH solution was concurrently added to control the pH value which was maintained at around 9.0. The slurry was stirred vigorously for 8 h and then cooled down to room temperature, and filtered under vacuum and washed several times with deionized water. The obtained product was then dried at 100 °C for 12 h and further calcined at 400 °C for 2 h in air with the heating rate of 2 °C min−1. The synthesized catalyst was denoted as 20Ni10Al70SiC with a NiO loading of 20 wt%, Al2O3 of 10 wt% and SiC of 70 wt%. Likewise, other 20NixAlySiC catalysts were also prepared with the Al2O3 amount of 0, 5 and 20 wt% using the same method and denoted as 20Ni80SiC, 20Ni5Al75SiC and 20Ni20Al60SiC, respectively.2.2. Catalyst characterization
N2 adsorption/desorption isotherms were measured at −196 °C using a Quantachrome surface area & pore size analyzer NOVA 3200e. Prior to the measurement, the sample was degassed at 300 °C for 3 h under vacuum. The specific surface area was determined according to the Brunauer–Emmett–Teller (BET) method in the relative pressure range of 0.05–0.2. The pore size distribution (PSD) was calculated based on the Barrett–Joyner–Halenda (BJH) method using the adsorption isotherm branch. Thermogravimetric (TG) analysis was conducted to determine the deposited carbon content on a Seiko Instruments EXSTAR TG/DTA 6300. 10 mg of the sample was used and heated under air (200 mL min−1) from room temperature up to 1000 °C (10 °C min−1). X-ray diffraction (XRD) patterns were recorded on a PANalytical X'Pert PRO MPD with a step of 0.03° using Cu Kα radiation (λ = 1.5418 Å) at 40 kV and 40 mA. The crystal size of the sample was estimated using the Debye–Scherrer equation. The microscopic feature of the samples was observed by field emission scanning electron microscope (SEM) (SU-8000, HITACHI, Japan) and transmission electron microscopy (TEM) (JEM-2010F, JEOL, Japan). Before TEM measurement, the H2-reduced catalysts were cooled to room temperature in H2 flow and then passivated in 1 vol% O2/Ar gas mixture for 30 min to prevent bulk oxidation of the Ni nanoparticles. Energy dispersed spectroscopy (EDS) (INCA X-MAX, JEOL, Oxford, England) was conducted to determine the elemental composition and distribution. The surface chemical composition was analyzed by an X-ray photoelectron spectroscopy (XPS) conducted on a VG ESCALAB 250 spectrometer (Thermo Electron, U.K.) with a non-monochromatized Al Kα X-ray source (1486 eV). H2 temperature-programmed reduction (H2-TPR) and H2 temperature-programmed desorption (H2-TPD) were carried out on Quantachrome Automated chemisorption analyzer (ChemBET pulsar TPR/TPD). For H2-TPR, 0.1 g sample was loaded in a quartz U-tube and heated from room temperature to 300 °C at 10 °C min−1 and maintained for 1 h under He flow. Then, the sample was cooled to room temperature, followed by heating to 1000 °C with a heating rate of 10 °C min−1 in 10 vol% H2/Ar flow (30 mL min−1). For H2-TPD, 0.2 g catalyst was used and reduced in situ in a H2/Ar flow at 600 °C for 2 h previously. Then the sample was cooled to room temperature and saturated with H2. After removing the physically adsorbed H2 by flushing with Ar for 2 h, the sample was heated to 1000 °C using a ramping rate of 10 °C min−1 in an Ar flow (30 mL min−1). The consumed or desorbed H2 was detected continuously as a function of increasing temperature using a thermal conductivity detector (TCD). The number of surface Ni sites per unit mass of catalyst was determined by means of H2-TPD assuming the adsorption stoichiometry of H/Ni = 1![[thin space (1/6-em)]](https://www.rsc.org/images/entities/char_2009.gif) :
:![[thin space (1/6-em)]](https://www.rsc.org/images/entities/char_2009.gif) 1. The peak area of H2-TPD profile was normalized to that of H2-TPR of a standard CuO sample. The dispersion of Ni was calculated based on the volume of chemisorbed H2 using the following simplified equation:30
1. The peak area of H2-TPD profile was normalized to that of H2-TPR of a standard CuO sample. The dispersion of Ni was calculated based on the volume of chemisorbed H2 using the following simplified equation:30where Vad (mL) represents the volume of chemisorbed H2 under standard temperature and pressure (STP) conditions measured in the TPD procedure; m is the sample weight (g); M is the molecular weight of Ni (58.69 g mol−1); P is the weight fraction of Ni in the sample determined by ICP; SF is the stoichiometric factor (the Ni
![[thin space (1/6-em)]](https://www.rsc.org/images/entities/char_2009.gif) :
:![[thin space (1/6-em)]](https://www.rsc.org/images/entities/char_2009.gif) H molar ratio in the chemisorption) which is taken as 1 and Vm is molar volume of H2 (22
H molar ratio in the chemisorption) which is taken as 1 and Vm is molar volume of H2 (22![[thin space (1/6-em)]](https://www.rsc.org/images/entities/char_2009.gif) 414 mL mol−1) at STP; dr is the reduction degree of Ni calculated based on H2-TPR results.
414 mL mol−1) at STP; dr is the reduction degree of Ni calculated based on H2-TPR results.
2.3. Catalytic activity measurements
The catalytic measurements are similar to our previous work.31–35 Typically, the CO methanation reactions were carried out in a fixed bed reactor at 0.1 MPa, with the temperature range of 260 to 550 °C. The influence of mass transfer was examined and eliminated before the catalytic tests. 0.2 g of catalyst sample (20–40 mesh) diluted with 4.0 g quartz sands (20–40 mesh) was uploaded in a quartz tube with a diameter of 8 mm in the reactor. The addition of quartz sands was to avoid the generation of hot spots in the catalyst bed. A thermocouple was placed outside of the reactor tube near the middle position of the catalyst bed to measure and monitor the reaction temperature. Prior to the reaction, the catalysts were reduced at 600 °C in pure H2 (100 mL min−1) for 2 h and then cooled to the starting reaction temperature in the same atmosphere, and then subjected to the mixed H2 and CO as well as N2 (as an internal standard) at a molar ratio of H2/CO/N2 = 3/1/1. The outlet gas stream from the reactor was cooled using a cold trap. The inlet and outlet gases were analyzed on line using a Micro GC 3000A (Agilent Technologies). The concentrations of H2, N2, CH4 and CO in gas products were detected by a TCD detector connected with a molecular sieve column while the concentrations of CO2, C2H4, C2H6, C3H6 and C3H8 were analyzed using another TCD connected with a Plot Q column. A life time test of CO methanation was performed at 550 °C and 0.1 MPa. Hydrothermal treatment for catalysts aging was also carried out in this fixed bed quartz tube reactor at 700 °C and 0.1 MPa for 10 h, the catalysts after 90 vol%H2O/H2 treated were labeled as 20Ni80SiC-HT and 20Ni10Al70SiC-HT, respectively. The CO conversion, CH4 selectivity and yield are defined as follows:here, X is the conversion of CO, S is the selectivity of CH4, Y is the yield of CH4, Fi,in and Fi,out are the volume flow rates of species i (i = CO or CH4) at the inlet and outlet.
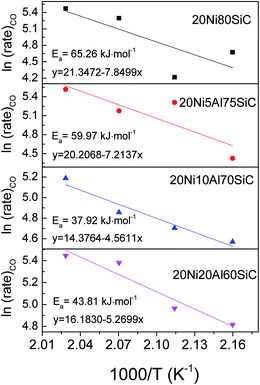
The rate and activation energy for CO methanation over the catalyst were determined using the reactor above at 0.1 MPa. 0.5 g catalyst sample (20–40 mesh) diluted with 3.0 g quartz sands (20–40 mesh) was used. The experiments were performed with different total gas flow of 50, 100 and 200 mL min−1 in the temperature range of 190–220 °C. The rate was determined using the following equation:6
3. Results and discussion
3.1. Characterization of the catalysts
| Samples | SBETa (m2 g−1) | Vpb (cm3 g−1) | Dpc (nm) | Ni particle size (nm) | H2 uptake (μmol g−1) | De (%) | TOFf (260 °C)/s−1 | |
|---|---|---|---|---|---|---|---|---|
| By XRDd | By TEM | |||||||
| a Surface area derived from BET equation.b Pore volume obtained from the volume of nitrogen adsorbed at the relative pressure of 0.97.c Pore size derived from BJH method using adsorption branch.d Estimated from the XRD diffraction peak (2θ = 44.6) using the Debye–Scherrer equation.e Ni dispersion calculated based on the H2-TPR and H2-TPD results.f Calculated based on the metal dispersion and the CO conversion at 260 °C. | ||||||||
| 20Ni80SiC | 23 | 0.045 | 15.1 | 13.3 | 15.2 | 57.5 | 4.3 | 0.062 |
| 20Ni5Al75SiC | 44 | 0.067 | 4.3 | 7.3 | 11.3 | 139.0 | 9.8 | 0.110 |
| 20Ni10Al70SiC | 52 | 0.062 | 3.8 | 5.5 | 8.4 | 141.4 | 10.6 | 0.158 |
| 20Ni20Al60SiC | 84 | 0.090 | 4.6 | 5.9 | 9.0 | 136.0 | 10.2 | 0.123 |
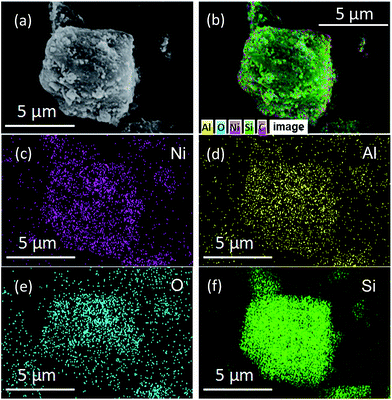 | ||
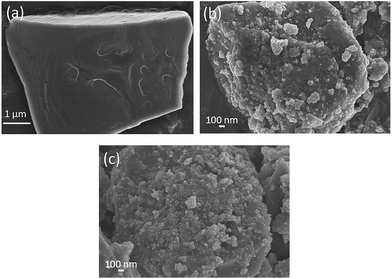
| Fig. 3 SEM image (a), the EDS element layered image (b) and elemental mapping images of Ni (c), Al (d), O (e) and Si (f) of 20Ni10Al70SiC. | ||
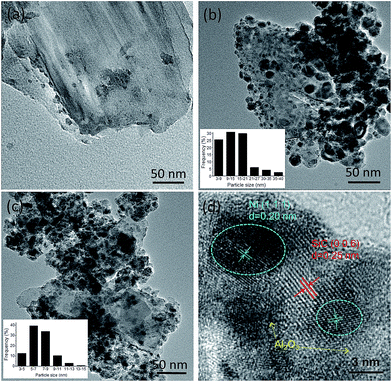
To compare the size distribution of Ni particles in the different catalysts, Fig. 4 shows TEM images of the support and the freshly reduced catalysts. By comparing the images of the support and the catalysts, Ni particles can be clearly distinguished due to the different contrast. It can be seen that, 20Ni10Al70SiC has smaller Ni particles with narrower size distribution than 20Ni80SiC, and their average Ni particle sizes are calculated to be 15.2 nm and 8.4 nm, respectively, proving that the introduction of Al2O3 can improve the dispersion of NiO particles on SiC support. These results are consistent with the calculated values from XRD patterns in the range of allowable error by considering the difference between these two methods of measurement. The HRTEM image of 20Ni10Al70SiC is also shown in Fig. 4d. The observed lattice spacing of ca. 0.20 nm is attributed to the Ni (111) plane, which is closely related to the active sites for the methanation reaction.30 The lattice spacing of ca. 0.25 nm is corresponding to the (006) plane of SiC, and the other parts marked in the image where there is no lattice spacing observed should be covered with Al2O3 component. Obviously, we can see that Ni particles are mainly dispersed on the Al2O3-modified SiC surface.
The hydrogen uptakes of the four reduced catalysts and Ni dispersion calculated based on the H2-TPR and H2-TPD results are listed in Table 1. The results reveal that 20Ni10Al70SiC has the highest total H2 uptake of 141.4 μmol g−1 and Ni dispersion of 10.6%, indicating the introduction of proper amount of Al2O3 can improve the dispersion of Ni particles, and thus enhance H2 uptake of the catalyst, which is important to improve the activity of the catalyst for CO methanation.
3.2. Catalytic performances of the catalysts
![[thin space (1/6-em)]](https://www.rsc.org/images/entities/char_2009.gif) 000 mL g−1 h−1 and 0.1 MPa, and the results are shown in Fig. 7a–c. For 20Ni80SiC, the catalytic activity is very poor below 300 °C, and the CO conversion over it reaches the thermodynamics equilibrium value when the temperature is as high as 450 °C. Comparing with 20Ni80SiC, the addition of Al2O3 can considerably improve the catalyst's low temperature activities. The CO conversion over all the 20NixAlySiC (x ≥ 5) catalysts can reach the thermodynamics equilibrium value in the temperature range of 320–350 °C. The activities of all the catalysts beyond 450 °C become low again because the CO methanation is a highly exothermic reaction with thermodynamic limit.42 The addition of Al2O3 also can increase CH4 selectivity of the catalyst as shown in Fig. 7b. The maximal CH4 yields over both 20Ni10Al70SiC and 20Ni20Al70SiC can reach 89% at a relative low temperature of 340 °C, while that over 20Ni80SiC is just 78% even at 430 °C (Fig. 7c). Clearly, the addition of proper amount of Al2O3 (10%) can remarkably enhance the low temperature activity of the catalyst at atmospheric pressure; however, further increasing the amount of Al2O3 up to 20% results in little change in the activity of the catalyst. Happel et al. found that the slowest step in the methanation reaction was the hydrogenation of CHx species, and the concentration of adsorbed hydrogen atoms on the surface was the determining factor of this hydrogenation reaction.43 Combining with the aforementioned H2-TPD results, we can conclude that the much improved activity of 20Ni10Al70SiC for CO methanation can be attributed to the enhanced H2 uptakes caused by the high dispersion of Ni particles, in which case more active sites are generated. The catalytic performance evaluation results indicate that the addition of Al2O3 by co-deposition–precipitation method is effective in improving the catalytic activities through the formation of a uniformly dispersed Al2O3 on SiC which can facilitate the high dispersion of Ni particles.
000 mL g−1 h−1 and 0.1 MPa, and the results are shown in Fig. 7a–c. For 20Ni80SiC, the catalytic activity is very poor below 300 °C, and the CO conversion over it reaches the thermodynamics equilibrium value when the temperature is as high as 450 °C. Comparing with 20Ni80SiC, the addition of Al2O3 can considerably improve the catalyst's low temperature activities. The CO conversion over all the 20NixAlySiC (x ≥ 5) catalysts can reach the thermodynamics equilibrium value in the temperature range of 320–350 °C. The activities of all the catalysts beyond 450 °C become low again because the CO methanation is a highly exothermic reaction with thermodynamic limit.42 The addition of Al2O3 also can increase CH4 selectivity of the catalyst as shown in Fig. 7b. The maximal CH4 yields over both 20Ni10Al70SiC and 20Ni20Al70SiC can reach 89% at a relative low temperature of 340 °C, while that over 20Ni80SiC is just 78% even at 430 °C (Fig. 7c). Clearly, the addition of proper amount of Al2O3 (10%) can remarkably enhance the low temperature activity of the catalyst at atmospheric pressure; however, further increasing the amount of Al2O3 up to 20% results in little change in the activity of the catalyst. Happel et al. found that the slowest step in the methanation reaction was the hydrogenation of CHx species, and the concentration of adsorbed hydrogen atoms on the surface was the determining factor of this hydrogenation reaction.43 Combining with the aforementioned H2-TPD results, we can conclude that the much improved activity of 20Ni10Al70SiC for CO methanation can be attributed to the enhanced H2 uptakes caused by the high dispersion of Ni particles, in which case more active sites are generated. The catalytic performance evaluation results indicate that the addition of Al2O3 by co-deposition–precipitation method is effective in improving the catalytic activities through the formation of a uniformly dispersed Al2O3 on SiC which can facilitate the high dispersion of Ni particles.
![[thin space (1/6-em)]](https://www.rsc.org/images/entities/char_2009.gif) 000 mL g−1 h−1 to lower CO conversion at 260 °C (see Fig. S3†). The calculated TOFCO values based on the CO conversion at this temperature and the H2 adsorption amount are listed in Table 1. It can be seen that 20Ni10Al70SiC possesses the highest TOFCO value (0.158 S−1), which further demonstrates that the optimal amount of Al2O3 introduced here is about 10%.
000 mL g−1 h−1 to lower CO conversion at 260 °C (see Fig. S3†). The calculated TOFCO values based on the CO conversion at this temperature and the H2 adsorption amount are listed in Table 1. It can be seen that 20Ni10Al70SiC possesses the highest TOFCO value (0.158 S−1), which further demonstrates that the optimal amount of Al2O3 introduced here is about 10%.
3.3. Stability of the catalysts
The lifetime test is important for evaluation of a catalyst; particularly, maintaining the activity and stability of the catalyst under harsh reaction conditions is crucial for the industrial process. Therefore, we carried out the 120 h lifetime tests for 20Ni80SiC, 20Ni5Al75SiC and 20Ni10Al70SiC at 550 °C, 0.1 MPa and different WHSVs, and the results are shown in Fig. 9. For 20Ni80SiC, the activity remains stable within the first 20 h test at 550 °C with WHSV of 30![[thin space (1/6-em)]](https://www.rsc.org/images/entities/char_2009.gif) 000 mL g−1 h−1 and even in the second 20 h test with increased WHSV of 60
000 mL g−1 h−1 and even in the second 20 h test with increased WHSV of 60![[thin space (1/6-em)]](https://www.rsc.org/images/entities/char_2009.gif) 000 mL g−1 h−1, indicating a relatively good thermal stability of it due to the good thermal conductivity of SiC support. However, it tends to decease slightly in the third 20 h test (total time 60 h) at 90
000 mL g−1 h−1, indicating a relatively good thermal stability of it due to the good thermal conductivity of SiC support. However, it tends to decease slightly in the third 20 h test (total time 60 h) at 90![[thin space (1/6-em)]](https://www.rsc.org/images/entities/char_2009.gif) 000 mL g−1 h−1. Especially, the significant decline can be seen at extreme high WHSV of 120
000 mL g−1 h−1. Especially, the significant decline can be seen at extreme high WHSV of 120![[thin space (1/6-em)]](https://www.rsc.org/images/entities/char_2009.gif) 000 mL g−1 h−1 after 60 h (total time 120 h). In contrast, the catalytic performance of 20Ni5Al75SiC and 20Ni10Al70SiC remain stable at every step during the whole 120 h lifetime test, indicating that Ni particles can be strongly anchored on the support by introducing a small amount of Al2O3. In addition, the Ni/Al2O3–SiC catalyst with optimal amount of Al2O3 show higher activity and stability than those Ni-based catalysts without adding promoter supported on the conventional material such as bentonite, α-Al2O3.34,35
000 mL g−1 h−1 after 60 h (total time 120 h). In contrast, the catalytic performance of 20Ni5Al75SiC and 20Ni10Al70SiC remain stable at every step during the whole 120 h lifetime test, indicating that Ni particles can be strongly anchored on the support by introducing a small amount of Al2O3. In addition, the Ni/Al2O3–SiC catalyst with optimal amount of Al2O3 show higher activity and stability than those Ni-based catalysts without adding promoter supported on the conventional material such as bentonite, α-Al2O3.34,35
 | ||
| Fig. 9 Lifetime test of 20Ni80SiC, 20Ni5Al75SiC and 20Ni10Al70SiC for CO methanation: (a) CO conversion, (b) CH4 selectivity and (c) CH4 yield. | ||
3.4. Characterization of the used catalysts
The TEM images of the used 20Ni80SiC, 20Ni5Al75SiC and 20Ni10Al70SiC catalysts are shown in Fig. 10a–c. The agglomeration of Ni particles in the used 20Ni80SiC is very serious compared with the freshly reduced 20Ni80SiC (see Fig. 4b), which should be due to the easy migration of Ni particles caused by the poor interaction with the support. In contrast, Ni particles are still well dispersed in the used 20Ni5Al75SiC and 20Ni10Al70SiC. Ni particle sizes of these used catalysts were also measured by XRD, and the calculated values are 18.5, 9.3 and 7.5 nm, respectively (see Fig. S4†). Although Ni particle sizes of the used catalysts are bigger than those of the fresh catalysts (see Table 1), the used 20Ni5Al75SiC and 20Ni10Al70SiC catalyst still possess much smaller Ni particle sizes than the freshly reduced 20Ni80SiC. In addition, some filamentous carbon can be clearly seen on the surface of the used 20Ni80SiC (Fig. S5†). The amount of carbon deposited on both of the used 20Ni80SiC and 20Ni10Al70SiC is further measured by TG analysis, and the results are presented in Fig. 10d. The carbon content over them is estimated to be 2.0 and 1.4 wt% respectively, suggesting the latter has a stronger coke resistance than the former. In addition, no new diffraction peak corresponding to graphitic carbon is observed in the XRD patterns of the used catalysts (see Fig. S4†), probably because the amount of this filamentous carbon is below the detection limit of XRD or they mainly exist in the form of amorphous.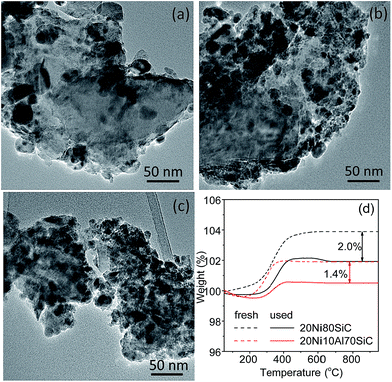 | ||
| Fig. 10 TEM images of the used catalysts after lifetime test: (a) 20Ni80SiC, (b) 20Ni5Al75SiC, (c) 20Ni10Al70SiC, and (d) TG curves of the used 20Ni80SiC and 20Ni10Al70SiC. | ||
3.5. Catalytic properties of the catalysts for CO methanation after hydrothermal treatment
Considering water is one of the byproducts in CO methanation and additional steam is often mixed into the feed gas atmosphere to avoid the generation of hot spots in the catalyst bed and to reduce carbon deposition in industry,44 the hydrothermal stability of both 20Ni80SiC and 20Ni10Al70SiC was examined. These two catalysts after hydrothermal treatment are labeled by adding a “HT” suffix, and the activity evaluation results are shown in Fig. 11. Compared with the fresh catalysts, the catalytic activities of 20Ni80SiC-HT and 20Ni10Al70SiC-HT are declined in different extent. The drastic decrease of catalytic activity obtained on 20Ni80SiC-HT should be due to the poor interaction of Ni particles with the SiC support. On the contrary, 20Ni10Al70SiC-HT still shows relatively high activity for CO methanation, indicating the introduction of proper amount of Al2O3 is useful to stabilize Ni particles on SiC. The mean particle size of Ni in the two catalysts was also estimated using XRD analysis (see Fig. S4†). It can be found that Ni particle size grows from 13.3 nm to 37.5 nm in 20Ni80SiC-HT, while the change in 20Ni10Al70SiC-HT is from 5.5 nm to 15.3 nm. The Ni particle size of 20Ni10Al70SiC-HT is still smaller than that of 20Ni80SiC, further suggesting the better stability of 20Ni10Al70SiC than 20Ni80SiC. In addition, it can be found that 20Ni10Al70SiC also show a better hydrothermal stability than the Ni/γ-Al2O3 catalyst by comparing with our previous research results,7 which should be ascribed to the superior thermal stability of SiC support. | ||
| Fig. 11 Catalytic activities of 20Ni80SiC and 20Ni10Al70SiC for CO methanation after hydrothermal treatment: (a) CO conversion, (b) CH4 selectivity and (c) CH4 yield. | ||
4. Conclusions
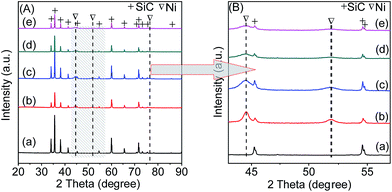
In this work, a series of Ni/Al2O3–SiC catalysts are successfully prepared by the co-deposition–precipitation method. The XRD and EDS characterization results indicate that the introduced Al2O3 is evenly deposited on the surface of SiC and has a strong binding with Ni particles, leading to the improved dispersion and less aggregation of Ni particles. Thus the prepared Ni/Al2O3–SiC exhibits both high catalytic performance and high stability in CO methanation reaction. It is found that the catalyst resistance to carbon deposition becomes stronger only with the optimal amount of Al2O3 content. With the introduction of excessive Al2O3, it will generate Ni–Al2O3 complex that is more difficult to be reduced, and not conducive to the catalytic performance as proven in the case of the 20Ni20Al60SiC catalyst. Our work demonstrates that the Al2O3-modified low specific surface SiC is a promising support candidate for CO methanation to produce SNG.Acknowledgements
The authors gratefully acknowledge the supports from the National Natural Science Foundation of China (no. 21476238 and 21206173), the National Basic Research Program (no. 2014CB744306), the Fund of State Key Laboratory of Multiphase Complex Systems (no. MPCS-2014-D-03 and MPCS-2015-A-06), the National High Technology Research and Development Program 863 (no. SS2015AA050502), “Strategic Priority Research Program” of the Chinese Academy of Sciences (no. XDA07010100 and XDA07010200), and the National Research Foundation of Singapore (M4098015.121).References
- M. B. I. Choudhury, S. Ahmed, M. A. Shalabi and T. Inui, Appl. Catal., A, 2006, 314, 47–53 CrossRef.
- A. M. Abdel-Mageed, S. Eckle, H. G. Anfang and R. J. Behm, J. Catal., 2013, 298, 148–160 CrossRef CAS.
- Q. Liu, F. Gu, X. Lu, Y. Liu, H. Li, Z. Zhong, G. Xu and F. Su, Appl. Catal., A, 2014, 488, 37–47 CrossRef CAS.
- G. Zhang, T. Sun, J. Peng, S. Wang and S. Wang, Appl. Catal., A, 2013, 462–463, 75–81 CrossRef CAS.
- G. A. Mills and F. W. Steffgen, Catal. Rev., 1974, 8, 159–210 Search PubMed.
- V. M. Shinde and G. Madras, AIChE J., 2014, 60, 1027–1035 CrossRef CAS.
- J. Gao, C. Jia, J. Li, M. Zhang, F. Gu, G. Xu, Z. Zhong and F. Su, J. Nat. Gas Chem., 2013, 22, 919–927 CAS.
- P. Panagiotopoulou, D. I. Kondarides and X. E. Verykios, Appl. Catal., B, 2009, 88, 470–478 CrossRef CAS.
- A. L. Kustov, A. M. Frey, K. E. Larsen, T. Johannessen, J. K. Nørskov and C. H. Christensen, Appl. Catal., A, 2007, 320, 98–104 CrossRef CAS.
- R.-F. Wu, Y. Zhang, Y.-Z. Wang, C.-G. Gao and Y.-X. Zhao, J. Fuel Chem. Technol., 2009, 37, 578–582 CrossRef CAS.
- D. Hu, J. Gao, Y. Ping, L. Jia, P. Gunawan, Z. Zhong, G. Xu, F. Gu and F. Su, Ind. Eng. Chem. Res., 2012, 51, 4875–4886 CrossRef CAS.
- J. Zhang, Z. Xin, X. Meng and M. Tao, Fuel, 2013, 109, 693–701 CrossRef CAS.
- B. Lu and K. Kawamoto, Fuel, 2013, 103, 699–704 CrossRef CAS.
- H. Lu, X. Yang, G. Gao, K. Wang, Q. Shi, J. Wang, C. Han, J. Liu, M. Tong, X. Liang and C. Li, Int. J. Hydrogen Energy, 2014, 39, 18894–18907 CrossRef CAS.
- A. Zhao, W. Ying, H. Zhang, H. Ma and D. Fang, Catal. Commun., 2012, 17, 34–38 CrossRef CAS.
- J. Zhang, Y. Bai, Q. Zhang, X. Wang, T. Zhang, Y. Tan and Y. Han, Fuel, 2014, 132, 211–218 CrossRef.
- M. Ledoux and C. Pham-Huu, CATTECH, 2001, 5, 226–246 CrossRef CAS.
- J. M. García-Vargas, J. L. Valverde, A. de Lucas-Consuegra, B. Gómez-Monedero, F. Dorado and P. Sánchez, Int. J. Hydrogen Energy, 2013, 38, 4524–4532 CrossRef.
- X. Guo, G. Zhi, X. Yan, G. Jin, X. Guo and P. Brault, Catal. Commun., 2011, 12, 870–874 CrossRef CAS.
- H.-M. Koo, B. S. Lee, M.-J. Park, D. J. Moon, H.-S. Roh and J. W. Bae, Catal. Sci. Technol., 2014, 4, 343–351 CAS.
- A. R. de la Osa, A. De Lucas, J. Díaz-Maroto, A. Romero, J. L. Valverde and P. Sánchez, Catal. Today, 2012, 187, 173–182 CrossRef CAS.
- C. Pham-Huu, P. D. Gallo, E. Peschiera and M. J. Ledoux, Appl. Catal., A, 1995, 132, 77–96 CrossRef CAS.
- M. E. Harlin, A. O. I. Krause, B. Heinrich, C. Pham-Huu and M. J. Ledoux, Appl. Catal., A, 1999, 185, 311–322 CrossRef CAS.
- G.-Q. Jin and X.-Y. Guo, Microporous Mesoporous Mater., 2003, 60, 207–212 CrossRef CAS.
- V. G. Pol, S. V. Pol and A. Gedanken, Chem. Mater., 2005, 17, 1797–1802 CrossRef CAS.
- Z. Liu, W. Shen, W. Bu, H. Chen, Z. Hua, L. Zhang, L. Li, J. Shi and S. Tan, Microporous Mesoporous Mater., 2005, 82, 137–145 CrossRef CAS.
- N. Leventis, A. Sadekar, N. Chandrasekaran and C. Sotiriou-Leventis, Chem. Mater., 2010, 22, 2790–2803 CrossRef CAS.
- A.-H. Lu, W. Schmidt, W. Kiefer and F. SCHüTH, J. Mater. Sci., 2005, 40, 5091–5093 CrossRef CAS.
- Q. Wang, W.-Z. Sun, G.-Q. Jin, Y.-Y. Wang and X.-Y. Guo, Appl. Catal., B, 2008, 79, 307–312 CrossRef CAS.
- Q. Liu, J. Gao, M. Zhang, H. Li, F. Gu, G. Xu, Z. Zhong and F. Su, RSC Adv., 2014, 4, 16094–16103 RSC.
- J. Gao, C. Jia, J. Li, F. Gu, G. Xu, Z. Zhong and F. Su, Ind. Eng. Chem. Res., 2012, 51, 10345–10353 CrossRef CAS.
- Q. Liu, J. Gao, F. Gu, X. Lu, Y. Liu, H. Li, Z. Zhong, B. Liu, G. Xu and F. Su, J. Catal., 2015, 326, 127–138 CrossRef CAS.
- C. Jia, J. Gao, J. Li, F. Gu, G. Xu, Z. Zhong and F. Su, Catal. Sci. Technol., 2013, 3, 490–499 CAS.
- X. Lu, F. Gu, Q. Liu, J. Gao, Y. Liu, H. Li, L. Jia, G. Xu, Z. Zhong and F. Su, Fuel Process. Technol., 2015, 135, 34–46 CrossRef CAS.
- Y. Liu, J. Gao, Q. Liu, F. Gu, X. Lu, L. Jia, G. Xu, Z. Zhong and F. Su, RSC Adv., 2015, 5, 7539–7546 RSC.
- K. Prabhakaran, J. James and C. Pavithran, J. Eur. Ceram. Soc., 2003, 23, 379–385 CrossRef CAS.
- X. Cai, X. Dong and W. Lin, J. Nat. Gas Chem., 2008, 17, 98–102 CrossRef CAS.
- Y.-S. Oh, H.-S. Roh, K.-W. Jun and Y.-S. Baek, Int. J. Hydrogen Energy, 2003, 28, 1387–1392 CrossRef CAS.
- N. Wang, K. Shen, L. Huang, X. Yu, W. Qian and W. Chu, ACS Catal., 2013, 3, 1638–1651 CrossRef CAS.
- N. Wang, W. Chu, T. Zhang and X.-S. Zhao, Chem. Eng. J., 2011, 170, 457–463 CrossRef CAS.
- J. Liu, C. Li, F. Wang, S. He, H. Chen, Y. Zhao, M. Wei, D. G. Evans and X. Duan, Catal. Sci. Technol., 2013, 3, 2627–2633 CAS.
- J. Gao, Y. Wang, Y. Ping, D. Hu, G. Xu, F. Gu and F. Su, RSC Adv., 2012, 2, 2358–2368 RSC.
- J. Happel, I. Suzuki, P. Kokayeff and V. Fthenakis, J. Catal., 1980, 65, 59–77 CrossRef CAS.
- H. Li, Y. Xu, C. Gao and Y. Zhao, Catal. Today, 2010, 158, 475–480 CrossRef CAS.
Footnote |
| † Electronic supplementary information (ESI) available. See DOI: 10.1039/c5ra19940a |
| This journal is © The Royal Society of Chemistry 2016 |


