Mixed-ligand copper(II)-phenolate complexes: structure and studies on DNA/protein binding profiles, DNA cleavage, molecular docking and cytotoxicity†
Sellamuthu Kathiresana,
Subramanian Mugeshb,
Maruthamuthu Muruganb,
Feroze Ahamedb and
Jamespandi Annaraj*a
aDepartment of Materials Science, School of Chemistry, Madurai Kamaraj University, Madurai 625021, Tamil Nadu, India. E-mail: annaraj.chem@mkuniversity.org
bDepartment of Microbial Technology, School of Biological Sciences, Madurai Kamaraj University, Madurai-625 021, Tamil Nadu, India
First published on 9th December 2015
Abstract
Copper(II) complexes with simple and mixed ligands, [Cu(L)(ClO4)] (1) and [Cu(L)(diimine)]ClO4 (2–4) [where L is 4-chloro-2-((2-(phenylthio)phenylimino)methyl)phenol and diimine is 1,10-phenanthroline (phen, 2), 2,2′-bipyridine (bpy, 3) or 4,4′-dimethyl-2,2′-bipyridyl (dmbpy, 4)], were synthesized and characterized by elemental analysis, UV-vis, FT-IR, electrospray ionization-mass spectrometry (ESI-MS) and electrochemical studies. Notably, complex 4 was structurally characterized using single X-ray crystallography. It was observed that this complex has a slightly distorted square planar geometry. The varying interactions of these complexes with herring sperm DNA (HS-DNA) were explored in detail using various spectral and electrochemical methods to gain insight into their structure–activity relationships. The obtained results revealed that complexes 1, 3 and 4 could interact with HS-DNA via a partial intercalation mode, whereas complex 2 was found to deeply stack between base pairs with a binding constant of 104 M−1 due to its enhanced planarity; moreover, 4 underwent a hydrophobic interaction with DNA. These experimental observations were found to be close to the theoretical observations investigated by the molecular docking technique. The interaction of these synthesized Cu(II) complexes with bovine serum albumin (BSA) was also evaluated using absorption and fluorescence techniques, which revealed a static quenching mechanism between the complexes and BSA. In addition, DNA cleavage by the complexes was monitored by electrophoretic spectrometry; the results showed that these complexes exhibited significant cleavage in the presence of a reducing agent (ascorbic acid). The in vitro cytotoxicity of these Cu(II) complexes was carried out in two different human tumour cell lines, A549 and Huh7. Furthermore, molecular docking was also used to evaluate and understand the interaction modes of the complexes with the molecular target DNA. All the in vitro pharmacological evaluation observations clearly indicated the superior DNA binding/cleaving and protein binding properties of these complexes, although the S-donor atom did not coordinate with the central copper ion in the mixed complexes.
1. Introduction
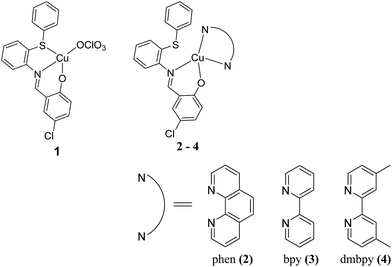
Transition metal complexes play a vital role in nucleic acid chemistry due to their diverse applications, such as sequence specific binding agents, structural probes and therapeutic agents, even though many drug molecules are organic in nature.1–5 Cisplatin, a well-known metallodrug for cancer, has wide applications as a chemotherapeutic agent; however, it exhibits several side effects, such as nausea and kidney and liver failure, which are typical of heavy metal toxicity.6,7 Therefore, researchers are seeking better alternative candidates among non-platinum based metal complexes such as copper, cobalt, nickel, zinc, ruthenium and iron, since these compounds have much less severe side effects.8 DNA and proteins are the major cellular targets for cytotoxicity because their interactions with small molecules can cause DNA damage in cancer cells, blocking their uncontrolled division and resulting in cell death.9–13 Currently, inorganic metal complexes are being successfully used as drugs in the treatment of numerous cancers.14 Copper(II) complexes are considered and proposed as better candidates for cancer therapy, since they exhibit significant roles in biological systems with no or negligible side effects.15–17 Therefore, much attention has been given to non-platinum based metal complexes that can interact with DNA, as well as to their antioxidant properties. Similarly, proteins have recently attracted the attention of the research community as a prime molecular target.18 Currently, interactions between proteins and metal complexes are becoming key factors in the search for new drug molecules.19,20 Serum albumins such as bovine serum albumin (BSA) are essential plasma proteins that carry several endogenous and exogenous compounds. It is crucial to explore drug–protein interactions, as most drugs that bind to serum albumins are usually transported as part of protein complexes.21,22The coordination chemistry of copper complexes of Schiff base ligands with ONS and NO chromospheres is interesting due to the structural, spectral, and redox properties of these complexes. Since the complexes are constructed with sulfur atoms, their medicinal applications may be related to their ability to mimic the functional properties of sulfur-containing proteins.23 It is well known that sulfur is an important constituent of biomolecules and plays a vital role in biological systems.24 Recently, it has been reported that some Cu(II) complexes exhibit strong DNA interactions and induce apoptosis in cancer cells.25–28 Therefore, the increasing importance of these sulfur-containing copper(II) complexes also motivated us to propose some Cu(II) complexes with co-ligands29 in order to evaluate their biological applications. In this article, we synthesized some copper(II) complexes, [Cu(L)(ClO4)] (1) with a simple Schiff base ligand, where L is 4-chloro-2-((2-(phenylthio)phenylimino)methyl)phenol, and a series of mixed ligands of the type [Cu(L)(diimine)]ClO4, where diimine = 1,10-phenanthroline (phen) (2), 2,2′-bipyridine (bpy) (3) or 4,4′-dimethyl-2,2′-bipyridyl (dmbpy) (4); we then explored their DNA/protein binding and DNA cleaving abilities, which depend upon the structure and number/size of the aromatic rings present in the Cu(II) complexes. Unfortunately, the sulfur atom did not coordinate to the central Cu(II) ion in the presence of the co-ligands (phen, bpy and dmbpy); therefore, these complexes could not be compared with previously reported sulfur containing copper complexes23–29 of biomimetic copper enzyme models, even though this manuscript aimed to expand on the possible biological applications of such complexes. Diimines such as bpy can recognize and bind to DNA; thus, the introduction of methyl groups on the 4,4′-position of the bpy ring (e.g., dmbpy) would provide a hydrophobic recognition element.30 Furthermore, the in vitro cytotoxicity of the copper(II) complexes against lung (A549) and liver (Huh7) cancer cell lines were also investigated (Scheme 1).
2. Experimental
Caution: Perchlorate salts of metal complexes are potentially explosive and therefore should be prepared in small quantities.2.1 Materials
AR grade commercially available reagents and chemicals were obtained from Sigma-Aldrich, India, S.D Fine Chemicals, India, CDH, India, and Fluka, India. Copper(II) perchlorate hexahydrate, 5-chlorosalicylaldehyde, ethidium bromide (EtBr), 4,4′-dimethyl-2,2′-bipyridyl (Aldrich), 1,10-phenanthroline (CDH), 2,2′-bipyridine (S.D Fine), 2-(phenylthio)aniline (Fluka), herring sperm DNA (SRL), tris-(hydroxymethyl)aminomethane–HCl (Tris–HCl) (SRL) and sodium chloride (SRL), supercoiled pUC18 plasmid DNA (Merck), and bovine serum albumin (BSA) (Himedia) were purchased from the respective agencies indicated within brackets and were used without further purification. Spectroscopic grade ethanol was purchased from Merck and was used without further purification. Dimethyl sulfoxide (DMSO) and ethylenediaminetetraacetic acid (EDTA) were purchased from Sigma-Aldrich. Tetrabutylammonium perchlorate (TBAP) was purchased from Fluka. A549 (lung cancer cells) and Huh7 (liver cancer cells) were purchased from the National Centre for Cell Sciences. DMEM-F12 Ham, fetal bovine serum (FBS), antibiotics, and other growth supplements were purchased from Himedia Chemicals, India. Reagent-grade 3-(4,5-dimethylthiazol-2-yl)-2,5-diphenyltetrazolium bromide (MTT) was obtained from Calbiochem.2.2 Methods and instrumentations
1H and 13C NMR spectra were obtained on a high resolution Bruker 300 MHz spectrometer in CDCl3 solution using TMS as the internal standard. Chemical shifts (ppm) were reported relative to tetramethylsilane (Me4Si). Melting points were determined on a Sigma capillary melting point apparatus. The elemental analyses were determined using a Vario III CHNS analyzer. FT-IR spectra of the ligands and complexes were obtained using KBr pellets on a JASCO FT-IR 410 double beam infrared spectrophotometer in the range of 4000–400 cm−1. Electrospray Ionization Mass Spectrometry (ESI-MS) analysis was performed in the positive ion mode on a liquid chromatography-ion trap mass spectrometer (LCQ Fleet, Thermo Fisher Instruments Limited, USA). Electronic absorption spectra were obtained using an Agilent 8453 UV-vis spectrophotometer in the range of 190–1100 nm. Emission spectra were obtained using an Agilent Cary Eclipse fluorescence spectrophotometer. Circular dichroism spectroscopy was performed with a JASCO J-810 spectropolarimeter; the spectra of the DNA solutions with added complex at 25 °C were obtained using a quartz cuvette of 1 cm optical path length. Cyclic voltammetry and differential pulse voltammetry measurements for these complexes were carried out using a Model CH 680 electrochemical analyzer with a three electrode system of a glassy carbon electrode (GCE) as the working electrode, Ag/AgCl as the reference electrode and a platinum wire as the auxiliary electrode under N2 atm. The electrochemical measurements were performed in CH3CN solution with 0.1 M TBAP as the supporting electrolyte at room temperature. The surface of the GC electrode was cleaned with alumina powder before every measurement. Tris–HCl buffer (pH 7.1) was used as a supporting electrolyte during the investigation of the interactions between the complexes and DNA; the solutions were deoxygenated by purging with N2 for 15 min prior to every measurement.2.3 Synthesis of ligand L and corresponding Cu(II) complexes
Yield: 90%; color: yellow; mp: 98–102 °C; 1H NMR (300 MHz, CDCl3) δ 13.10 (1H, s, –OH), 8.51 (1H, s, CH![[double bond, length as m-dash]](https://www.rsc.org/images/entities/char_e001.gif) N), 7.57–6.97 (12H, m, Ar–H). 13C NMR (75 MHz, CDCl3) δ 160.88, 159.53, 146.41, 133.58, 132.90, 132.60, 132.38, 131.03, 130.42, 129.13, 128.77, 127.56, 127.44, 126.55, 123.39, 119.76, 118.79, 117.83. IR: (KBr pellet, cm−1): 1618 (s), 1558 (m), 1465 (s), 736 (s). UV-vis (MeOH, λmax (nm)): 270, 356. ESI-MS (MeOH): found m/z = 340.09 (M + H)+ (calcd m/z = 339.05).
N), 7.57–6.97 (12H, m, Ar–H). 13C NMR (75 MHz, CDCl3) δ 160.88, 159.53, 146.41, 133.58, 132.90, 132.60, 132.38, 131.03, 130.42, 129.13, 128.77, 127.56, 127.44, 126.55, 123.39, 119.76, 118.79, 117.83. IR: (KBr pellet, cm−1): 1618 (s), 1558 (m), 1465 (s), 736 (s). UV-vis (MeOH, λmax (nm)): 270, 356. ESI-MS (MeOH): found m/z = 340.09 (M + H)+ (calcd m/z = 339.05).
Yield: 82%; color: light green; mp: 145 °C; anal. calcd for C19H13Cl2CuNO5S: C, 45.48; H, 2.61; N, 2.79; found: C, 45.64; H, 2.53; N, 2.68; IR: (KBr pellet, cm−1): 1606 (s), 1556 (m), 1467 (s), 753 (s). UV-vis (MeOH, λmax (nm)): 236, 280, 407 and 682 (d–d transition). ESI-MS (MeOH): found m/z = 400.94 [M − ClO4]+ (calcd m/z = 499.05).
Yield: 80%; color: dark green; mp: 160 °C; anal. calcd for C31H21Cl2CuN3O5S: C, 63.91; H, 3.63; N, 7.21; found: C, 63.98; H, 3.57; N, 7.08; IR: (KBr pellet, cm−1): 3419 (br), 1606 (s), 1516 (m), 1430 (s), 736 (s). UV-vis (MeOH, λmax (nm)): 228, 268, 423 and 616 (d–d transition). ESI-MS (MeOH): found m/z = 581.03 [Cu(L)(phen)]+ (calcd m/z = 581.04).
Yield: 76%; color: green; mp: 245–250 °C; anal. calcd for C29H21Cl2CuN3O5S: C, 62.36; H, 3.79; N, 7.52; found: C, 62.14; H, 3.62; N, 7.37; IR: (KBr pellet, cm−1): 3372 (br), 1604 (s), 1477 (m), 1444 (s), 732 (s). UV-vis (MeOH, λmax (nm)): 237, 301, 411 and 608 (d–d transition). ESI-MS (MeOH): found m/z = 558.88 [Cu(L)(bpy)]+ (calcd m/z = 557.04).
Yield: 85%; color: dark green; mp: 235–240 °C; anal. calcd for C31H25Cl2CuN3O5S: C, 63.47; H, 4.30; N, 7.16; found: C, 63.26; H, 4.18; N, 7.08; IR: (KBr pellet, cm−1): 3475 (br), 1608 (s), 1519 (m), 1450 (m), 734 (s). UV-vis (MeOH, λmax (nm)): 245, 292, 411 and 653 (d–d transition). ESI-MS (MeOH): found m/z = 584.96 [Cu(L)(dmbpy)]+ (calcd m/z = 585.07).
2.4 Single crystal X-ray crystallography
A single crystal of complex [Cu(L)(dmbpy)]ClO4 (4) was obtained by slow evaporation of a methanol solution at room temperature. Single crystal X-ray diffraction data for complex 4 were collected on a Bruker APEX2 CCD area-detector diffractometer at 293(2) K using a graphite monochromated Mo Kα radiation source (λ = 0.71073 Å). The collected data were reduced using the XCAD4 program.31 The structure was solved by direct methods as implemented in the SHELXS-97 program.32 The positions of all the non-hydrogen atoms were included in the full-matrix least squares refinement using the SHELXL-97 program.32 The molecular graphics were depicted by the program ORTEP-3 for Windows.33 The crystallographic data and structure refinement parameters are summarized in Table 1, and selected bond distances and angles are listed in Table 2. Crystallographic data (excluding structure factors) for the reported structure have been deposited with the Cambridge Crystallographic Data Centre as supplementary CCDC deposition no. 1401459.†| Empirical formula | C31H25Cl2CuN3O5S |
| Formula weight | 686.04 |
| Temperature (K) | 293(2) |
| Wavelength (Å) | 0.71073 |
| Crystal system | Triclinic |
| Space group | P![[1 with combining macron]](https://www.rsc.org/images/entities/char_0031_0304.gif) |
![[thin space (1/6-em)]](https://www.rsc.org/images/entities/char_2009.gif) |
|
| Unit cell dimensions | |
| a (Å) | 10.025 |
| b (Å) | 13.171 |
| c (Å) | 13.409 |
| α (°) | 66.74 |
| β (°) | 82.90 |
| γ (°) | 68.04 |
| Volume (Å3) | 1507.9 |
| Z | 2 |
| Density (calculated) | 1.511 Mg m−3 |
| Absorption coefficient | 1.016 mm−1 |
| F(000) | 702 |
| Crystal size (mm3) | 0.32 × 0.30 × 0.28 |
| θ range for data collection (°) | 2.19 to 34.72 |
| Limiting indices | −15 ≤ h ≤ 14, −21 ≤ k ≤ 18, −18 ≤ l ≤ 18 |
| Reflections collected | 33![[thin space (1/6-em)]](https://www.rsc.org/images/entities/char_2009.gif) 127 127 |
| Independent reflections | 9621 [R(int) = 0.0354] |
| Completeness to θ = 34.72 | 73.9% |
| Absorption correction | None |
| Refinement method | Full-matrix least-squares on F2 |
| Data/restraints/parameters | 9621/0/388 |
| Goodness-of-fit on F2 | 1.123 |
| Final R indices [I > 2σ(I)] | R1 = 0.0586, wR2 = 0.1427 |
| R indices (all data) | R1 = 0.1148, wR2 = 0.1624 |
| Largest diff. peak and hole (e Å−3) | 0.687 and −0.503 |
| Bond lengths (Å) | Bond angles (°) | ||
|---|---|---|---|
| Cu(1)–O(5) | 1.879(2) | O(5)–Cu(1)–N(1) | 92.07(11) |
| Cu(1)–N(1) | 1.984(3) | O(5)–Cu(1)–N(3) | 89.83(11) |
| Cu(1)–N(3) | 1.999(3) | N(1)–Cu(1)–N(3) | 161.79(11) |
| Cu(1)–N(2) | 2.015(3) | O(5)–Cu(1)–N(2) | 163.64(11) |
| S(1)–C(13) | 1.767(3) | N(1)–Cu(1)–N(2) | 101.04(11) |
| S(1)–C(14) | 1.769(3) | N(3)–Cu(1)–N(2) | 80.78(11) |
| N(1)–C(7) | 1.292(4) | C(7)–N(1)–Cu(1) | 121.9(2) |
| N(1)–C(8) | 1.426(4) | C(8)–N(1)–Cu(1) | 120.7(2) |
| O(5)–C(4) | 1.302(4) | C(4)–O(5)–Cu(1) | 125.4(2) |
| N(3)–C(20) | 1.328(5) | C(20)–N(3)–Cu(1) | 126.1(2) |
| N(3)–C(24) | 1.343(4) | C(24)–N(3)–Cu(1) | 115.0(2) |
| N(2)–C(31) | 1.328(4) | C(31)–N(2)–Cu(1) | 127.8(2) |
| N(2)–C(26) | 1.348(4) | C(26)–N(2)–Cu(1) | 114.3(2) |
2.5 DNA interaction studies
![[thin space (1/6-em)]](https://www.rsc.org/images/entities/char_2009.gif) :
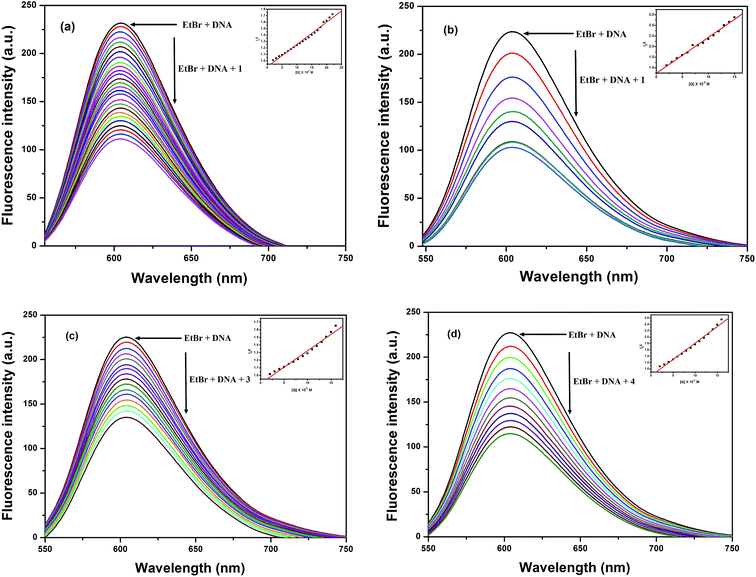
:![[thin space (1/6-em)]](https://www.rsc.org/images/entities/char_2009.gif) 1; the solution was prepared by the addition of EtBr (250 μL, 10−3 M) and DNA (1250 μL, 2 × 10⁻³ M) to Tris–HCl buffer solution (25 mL, pH = 7.1). Emission spectra were obtained in the region between 550 and 750 nm at room temperature with a fixed excitation wavelength of 525 nm during the addition of increasing concentrations of the synthesized complexes 1–4. The fluorescence spectra of solutions containing EtBr–DNA bound mixture with various concentrations of 1–4 (0 to 150 μM) were acquired.
1; the solution was prepared by the addition of EtBr (250 μL, 10−3 M) and DNA (1250 μL, 2 × 10⁻³ M) to Tris–HCl buffer solution (25 mL, pH = 7.1). Emission spectra were obtained in the region between 550 and 750 nm at room temperature with a fixed excitation wavelength of 525 nm during the addition of increasing concentrations of the synthesized complexes 1–4. The fluorescence spectra of solutions containing EtBr–DNA bound mixture with various concentrations of 1–4 (0 to 150 μM) were acquired.2.6 DNA cleavage studies
The DNA cleaving properties of the Cu(II) complexes were investigated using agarose gel electrophoresis in the presence of 100 μM of ascorbic acid (H2A).34 Cu(II) complexes (in the range of 10–100 μM) were treated with plasmid pUC18 DNA (0.2 μg, ∼30 μM base pairs). These samples (5 μL in Tris–buffer) were incubated at 37 °C for 1 h; loading buffer (1 μL) consisting of 0.25% bromophenol blue and 30% glycerol was added to this solution. This mixture underwent gel electrophoresis on 1% agarose in a 1× TAE buffer (40 mM Tris–acetate and 1 mM EDTA) at 50 V for 2 h. Pre-stained gel with ethidium bromide was photographed under UV light after electrophoresis. The cleaving properties were determined based on the ability of the Cu(II) complexes to convert the supercoiled form (Form I) into the nicked circular form (Form II).352.7 Molecular docking studies
Molecular docking is an essential in silico computational tool for the rational design of novel chemotherapeutic drugs; this technique can be used to estimate the occurrence of non-covalent interactions between drugs and DNA. A blind docking calculation for the complex and DNA was performed using the AutoDock (MGL Tools) package. The structure of the target HS-DNA molecule, d(ACCGACGTCGGT)2, was obtained from the Protein Data Bank (PDB id: 423D).36 Parameter values obtained from the MGL (Molecular Graphics Laboratory) mailing list forum (http://mgldev.scripps.edu)37 were added to the Cu(II) complexes. The X-ray crystal structure of Cu(II) complex 4 was converted to PDB format using Chem3D (Cambridge Soft).38 The bound ligand ClO4 coordinates from complex 4 were removed and subsequently, the bond orders were checked to validate the docking protocol.39 Complexes 1, 2 and 3 were optimized at the B3LYP/LANL2DZ level using the G09W program, then converted to PDB format using Chem3D (Cambridge Soft).38 The calculated docking data of DNA and the complexes were prepared using AutoDock Tools (ADT) and were converted to a PDBQT file. Grid boxes for the Cu(II) complexes and DNA were constructed with 0.700 Å grid spacing and grid points in the x × y × z directions, 64 × 114 × 62. A Lamarckian genetic algorithm (LGA) was followed to perform docking calculations and for other parameters used as default values. Visualization of the docked pose was performed using the PyMOL (PyMOL Molecular Graphics System, Version 1.5.6) molecular graphics program.402.8 Protein binding studies
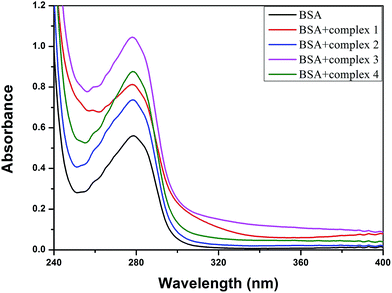
Protein binding studies of the Cu(II) complexes (1–4) with BSA were performed using fluorescence spectra with an excitation wavelength of 280 nm and an emission wavelength of 348 nm, corresponding to those of free bovine serum albumin (BSA). The excitation and emission slit widths and scan rates were constantly maintained for all the experiments. A stock solution of BSA was prepared in Tris–HCl buffer (pH = 7.1) and stored in the dark at 4 °C for further use. Concentrated stock solutions of the test complexes were prepared by dissolving them in methanol and diluting the solutions with Tris–HCl buffer to obtain the required concentrations. BSA (2 mL, 1 μM) was titrated with successive additions of the complexes (10 μL, 10−3 M) using a micropipette. For the UV-vis absorption experiments, BSA (10 μM) was titrated with 5 μM concentrations of the copper(II) complexes.2.9 Cytotoxic studies
The copper(II) complexes were subjected to viability studies with human lung (A549) and liver (Huh7) cancer cells by the well-known MTT assay method.41 Lung adenocarcinoma cells (A549) and liver hepatocarcinoma cells (Huh7) were transferred into 96 well plates at a concentration of 1 × 10⁵ cells per well. The Cu(II) complexes (1–50 μM) in DMSO were seeded in the wells and incubated for 24 h with MTT [5 mg mL−1 phosphate buffer saline (PBS)] at 37 °C for 4 h. The absorbance of the cells was measured at a wavelength of 570 nm and the percentage of cell viability was calculated by the following equation:3. Results and discussion
3.1 Physical properties of ligand and complexes
Ligand L was prepared by the reaction between 2-(phenylthio)aniline and 5-chloro-2-hydroxy-benzaldehyde in ethanol. The obtained product was confirmed by ESI mass spectrometry and 1H and 13C NMR spectroscopy. The complexes were crystalline, non-hygroscopic solids, air-stable both in solution and in the solid state at room temperature and were mostly soluble in common organic solvents. These complexes have been characterized by elemental analysis, ESI-MS, FT-IR, UV-vis spectroscopy, and electrochemical techniques. In addition, the structure of complex 4 was confirmed by single crystal X-ray crystallography.3.2 Spectroscopic studies
A strong band for the Schiff base ligand appeared in the 1618–1604 cm−1 region corresponding to ν(C![[double bond, length as m-dash]](https://www.rsc.org/images/entities/char_e001.gif) N); this band underwent a coordination-induced shift to 1606 cm−1 for complexes 1–4, which indicated that the coordination might be occurring through the azomethine nitrogen of the ligands.42 A band that appeared at 736 cm−1 for ν(C–S) in the Schiff base was also significantly altered in the spectrum of complex 1, where it appeared at 756 cm−1; this indicates that the coordination occurs between the central Cu2+ ion and the S atom of the ligand.43 However, this band did not undergo any remarkable shift after complexation in complexes 2–4, which clearly indicates that no bond formation occurred between the copper centre and the S donor present in the ligands.
N); this band underwent a coordination-induced shift to 1606 cm−1 for complexes 1–4, which indicated that the coordination might be occurring through the azomethine nitrogen of the ligands.42 A band that appeared at 736 cm−1 for ν(C–S) in the Schiff base was also significantly altered in the spectrum of complex 1, where it appeared at 756 cm−1; this indicates that the coordination occurs between the central Cu2+ ion and the S atom of the ligand.43 However, this band did not undergo any remarkable shift after complexation in complexes 2–4, which clearly indicates that no bond formation occurred between the copper centre and the S donor present in the ligands.
Electronic spectra of all the complexes (1–4) were obtained in methanol; these spectra showed three strong absorptions in the range of 423–228 nm. The absorbance appearing around 228–301 nm has been assigned to the intra-ligand transitions, and the lower energy absorptions perceived around 407–423 nm are assigned to the LMCT transitions.44,45 Weak absorptions that were observed in the range of 608–682 nm can be assigned to the d–d transitions of the compounds (Fig. S3†).46
ESI-MS spectra (in the positive-ion mode) for the ligand and complexes 1–4 have been obtained in methanol. The ligand showed a peak at m/z 340.09 [M + H]+, and complex 1 showed a peak at 400.94 [M − ClO4]+. The mixed ligand complexes 2, 3 and 4 also showed their characteristic molecular ion peaks at m/z 581.03 [Cu(L)(phen)]+, m/z 558.88 [Cu(L)(bpy)]+ and m/z 584.96 [Cu(L)(dmbpy)]+, respectively (Fig. S4–S8†).
3.3 X-ray crystallography
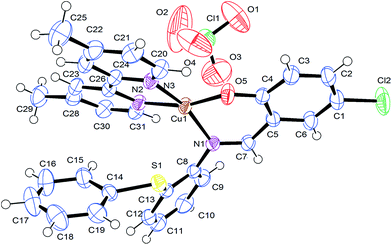
The solid state X-ray molecular structure of complex [Cu(L)(dmbpy)]ClO4 (4) has been determined by single crystal X-ray diffraction (Fig. 1) to predict the coordination mode of the Schiff base ligand to the central copper and its stereochemistry. Suitable crystals of complex 4 were developed by slow evaporation of its methanolic solution; the collected data and refinement parameters are summarized in Table 1, and the crystal data with selected interatomic bond lengths and angles are given in Table 2. The complex crystallizes as a triclinic crystal system with space group P![[1 with combining macron]](https://www.rsc.org/images/entities/char_0031_0304.gif) . The copper atom has N3O coordination through the phenolate oxygen atom (O5) and the imine nitrogen atoms (N1) of the primary ligand; the remaining two corners are bonded with the two nitrogen atoms of the co-ligand (N2 and N3, dmbpy). The obtained X-ray diffraction structure of complex 4 indicated that a slight distortion occurred in its square planar geometry along the angles of N(1)–Cu(1)–N(3) 161.79(11) to O(5)–Cu(1)–N(2) 163.64(11) from O(5)–Cu(1)–N(1) 92.07(11) to O(5)–Cu(1)–N(3) 89.83(11). The N(1)–Cu(1)–N(2) and the N(3)–Cu(1)–N(2) bond angles are of 101.04(11) and 80.78(11). However, the sum of the angles in Cu(II) is very close to 360°, indicating its planar geometry. Significant bond distances between the metal centre and donor sites are Cu(1)–O(5) 1.879(2), Cu(1)–N(1) 1.984(3), Cu(1)–N(3) 1.999(3) and Cu(1)–N(2) 2.015(3) Å, which is similar to those shown in Fig. 1. The dmbpy N atoms are slightly elongated from the M–N and M–O bond distances. The bond distances and bond angles are in good agreement with previous reports of the observed slightly distorted square planar geometry of copper complexes.47
. The copper atom has N3O coordination through the phenolate oxygen atom (O5) and the imine nitrogen atoms (N1) of the primary ligand; the remaining two corners are bonded with the two nitrogen atoms of the co-ligand (N2 and N3, dmbpy). The obtained X-ray diffraction structure of complex 4 indicated that a slight distortion occurred in its square planar geometry along the angles of N(1)–Cu(1)–N(3) 161.79(11) to O(5)–Cu(1)–N(2) 163.64(11) from O(5)–Cu(1)–N(1) 92.07(11) to O(5)–Cu(1)–N(3) 89.83(11). The N(1)–Cu(1)–N(2) and the N(3)–Cu(1)–N(2) bond angles are of 101.04(11) and 80.78(11). However, the sum of the angles in Cu(II) is very close to 360°, indicating its planar geometry. Significant bond distances between the metal centre and donor sites are Cu(1)–O(5) 1.879(2), Cu(1)–N(1) 1.984(3), Cu(1)–N(3) 1.999(3) and Cu(1)–N(2) 2.015(3) Å, which is similar to those shown in Fig. 1. The dmbpy N atoms are slightly elongated from the M–N and M–O bond distances. The bond distances and bond angles are in good agreement with previous reports of the observed slightly distorted square planar geometry of copper complexes.47
3.4 Electrochemistry
The cyclic voltammograms of all the copper complexes (1–4) were recorded in CH3CN with glassy carbon electrode at a scan rate of 100 mV s−1 using 0.1 M tetrabutylammonium perchlorate (TBAP) as a supporting electrolyte. All the potentials were referenced with an Ag/AgCl electrode. All the complexes showed a well-defined quasi-reversible redox couple. The cyclic voltammogram of complex 2 is illustrated in Fig. 2; it shows a well-defined CuII/CuI quasi-reversible redox couple at 0.052 V. The ipa/ipc falls at ca. 0.91, clearly confirming the transfer of one electron in this redox process. Similar quasi-reversible redox behaviour was observed for other complexes (Fig. S9†). The redox potential of complex 2 was relatively higher than that of complexes 3 and 4, which is due to the presence of the phen moiety and is attributed to the extension of the corresponding π framework around the metal centre.48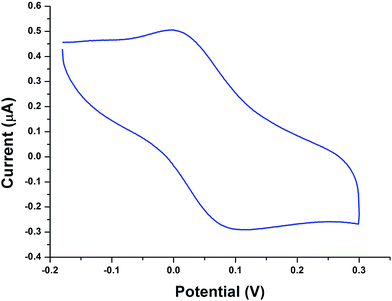 | ||
| Fig. 2 Cyclic voltammogram of complex 2 in CH3CN (0.1 M TBAP) on a GC working electrode with a scan rate of lf 100 mV s−1. | ||
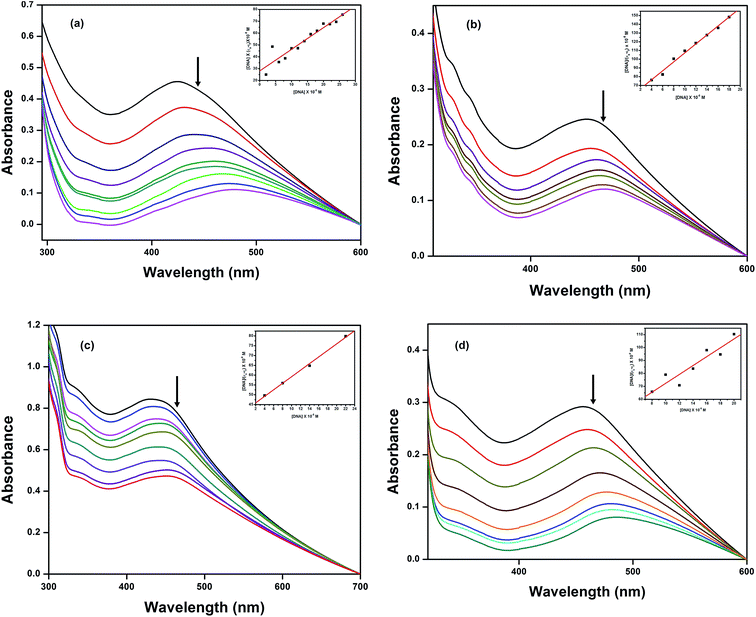
3.5 DNA binding studies
| [DNA]/(εa − εf) = [DNA]/(εb − εf) + 1/Kb(εb − εf) |
| Compound | Kb (M−1) | Ksq (M−1) | Kapp (M−1) |
|---|---|---|---|
| 1 | 0.652 × 10⁴ | 0.31 × 10⁵ | 0.40 × 10⁶ |
| 2 | 0.917 × 10⁴ | 1.70 × 10⁵ | 1.60 × 10⁶ |
| 3 | 0.892 × 10⁴ | 0.43 × 10⁵ | 0.56 × 10⁶ |
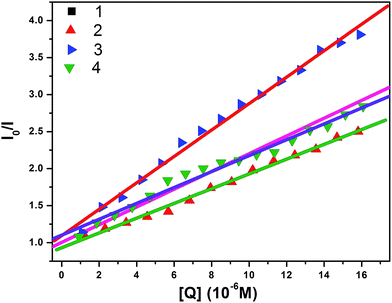
| 4 | 0.902 × 10⁴ | 1.03 × 10⁵ | 0.91 × 10⁶ |
| I0/I = Ksq[Q] + 1 |
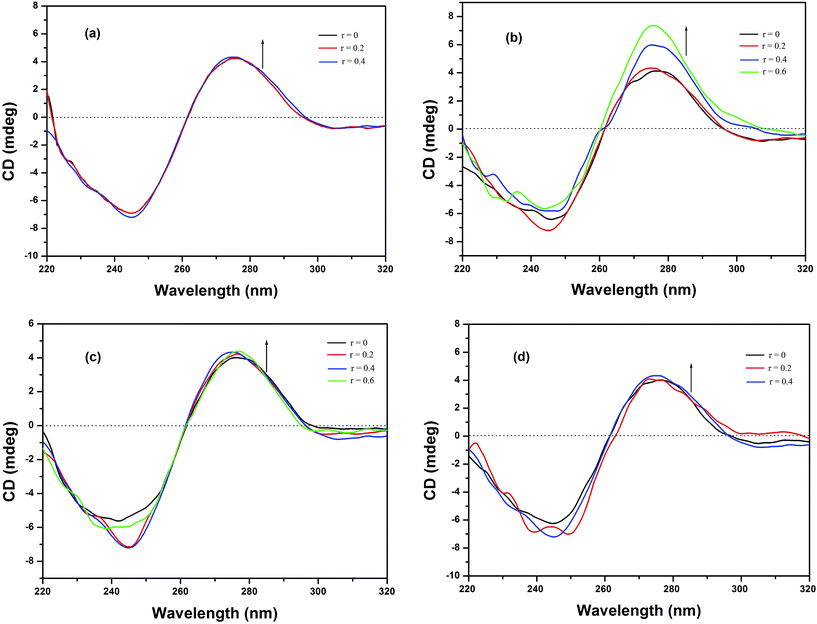
Thus, based on the evidence provided by the EtBr fluorescence displacement experiments, we conclude that complexes 1–4 can interact with HS-DNA through intercalation or partial intercalation modes,59 which is in sound agreement with the results of the previously discussed electronic absorption spectral measurements.
Kapp (apparent binding constant) values were also calculated for complexes 1–4 using the equation:61
| KEtBr [EtBr] = Kapp [complex]50 |
The cyclic voltammograms of the complexes in the absence of DNA reveal non-Nernstian behaviour with a quasi-reversible one electron Cu(II)/Cu(I) redox process attributed to the peak potential separation of 128 to 280 mV (Table 4). The cyclic voltammogram of complex 3 in the absence and presence of HS-DNA in Tris–HCl buffer/MeOH solution at a scan rate of 100 mV s−1 is provided in Fig. 5 and Fig. S10–S12.† All the copper complexes under investigation exhibited a negligible potential shift on titration with HS-DNA in the anodic and cathodic peaks along with the suppression of both peak currents as anticipated, indicating that intercalation occurred64 with HS-DNA through the aromatic moiety. In particular, the aromatic moiety connected with the sulfur atom, which did not coordinate with the central copper ion in complexes 2–4, can easily penetrate into the core of the DNA, and the remaining portions of the complexes may stay and stick on the sugar phosphate backbone of the HS-DNA. Therefore, these observed electrochemical changes are consistent with non-coordinating intercalative/partial intercalative binding of the available aromatic ligand moiety between the DNA base pairs, as also evidenced by the previously discussed spectral (UV-vis and EtBr displacement studies) results. In the absence of DNA, Epc appears at −0.005 and Epa at 0.284 (ΔEp = 0.279 V, E1/2 = 0.140 V and ipa/ipc = 1.1) for complex 1. Epc appears at −0.124 and Epa at 0.004 (ΔEp = 0.128 V, E1/2 = −0.060 V and ipa/ipc = 0.92) for complex 2. Epc appears at −0.205 and Epa at −0.050 (ΔEp = 0.155 V, E1/2 = −0.128 V and ipa/ipc = 0.95) for complex 4. The obtained results from the voltammograms illustrate that the ΔEp values are not very sensitive to the addition of DNA, while there is a considerable suppression in the peak current values. The formal potentials, E1/2 (voltammetric), taken as the average of Epc and Epa, shifted slightly towards the positive side upon interaction with DNA; it should be noted that both Cu(II) and Cu(I) forms bind to DNA at different rates. These observed electrochemical changes may be due to the slow diffusion of an equilibrium mixture of the free and DNA bound complex on the electrode surface with strong interactions occurring between them.65,66
| Complexes | ΔEpa (V) | E1/2b (V) | ipa/ipc | K+/K2+ | ||
|---|---|---|---|---|---|---|
| Free | Bound | Free | Bound | |||
| a ΔEp = Epa − Epc.b E1/2 is calculated as the average of anodic (Epa) and cathodic (Epc) peak potentials. E1/2 = Epa + Epc/2. | ||||||
| 1 | 0.279 | 0.302 | 0.140 | 0.132 | 1.15 | 0.951 |
| 2 | 0.128 | 0.145 | −0.060 | −0.058 | 0.92 | 1.168 |
| 3 | 0.129 | 0.134 | −0.054 | −0.048 | 0.97 | 0.836 |
| 4 | 0.155 | 0.178 | −0.128 | −0.115 | 0.95 | 0.985 |
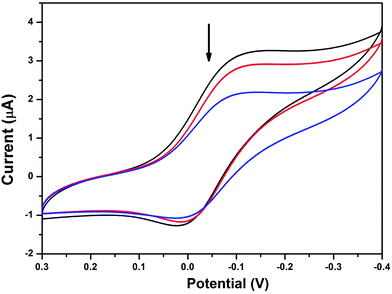 | ||
| Fig. 5 Cyclic voltammograms of complex 3 in the absence and presence of HS-DNA at a scan rate of 100 mV s−1 (Tris–HCl buffer, pH 7.1). | ||
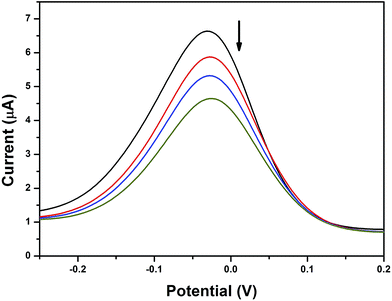
Differential pulse voltammogram (DPV) experiments were also performed to observe the changes in the formal potentials as well as the current density during the addition of DNA to the experimental solution. The reduction process was observed at a scan rate of 100 mV s−1 (Fig. 6). DPV also demonstrated the changes found in the CV experiments; hence, it can be concluded that the copper complex with phen ligand (2) intercalated with DNA through the insertion of the phen ligand between the base pairs of the DNA duplex strand.66 Moreover, the bpy based complexes (3 and 4) interacted with DNA through the partial insertion of the aromatic rings, which are connected to the sulfur atom in the ligand architecture due to the lack of planarity found in the bpy moiety. However, it is also noted that complex 4 may have a greater possibility for hydrophobic interaction with DNA nucleotides. The suppression of current along with a slight potential shift was related to the ratio of the binding constants by the following equation:
E′bo − E′fo = 0.059![[thin space (1/6-em)]](https://www.rsc.org/images/entities/char_2009.gif) log(K+/K2+) log(K+/K2+) |
3.6 DNA cleavage
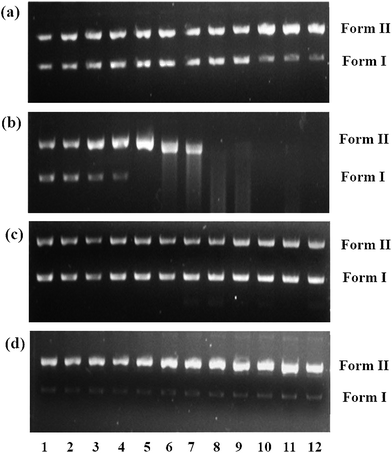
DNA cleavage experiments were carried out with supercoiled pUC18 DNA using agarose gel electrophoresis. In the control experiment using ascorbic acid in the absence of complexes, no characteristic cleavage of DNA was observed. However, cleaved fragments of DNA were observed for complexes 1–4 in the presence of ascorbic acid, as visualized under a UV lamp and photographed. Complexes 1–4 were able to cleave SC (Form I) DNA into its nicked circular form (NC) (Form II) [Fig. 8] in the presence of ascorbic acid, and the observed cleavage efficiency follows the order of 2 > 4 > 3 > 1 depending upon the co-ligand. The effect of the DNA cleavage by complex 2 was studied at a lower concentration (30 μM) (lane 5, Fig. 8b), since this complex showed stronger DNA interaction than the other complexes; as anticipated, the higher concentration of 2 induced DNA cleavage more efficiently, as monitored by the appearance of Form II and the disappearance of Form I. These observations clearly indicated that the formation of Cu(I) species in complex 2, even at lower concentrations, compared to the other complexes resulted in more intense nuclease activity. Moreover, it is also noted that the hydrophobicity of complex 4 may induce efficient fragmentation of the DNA, similarly to complex 2 and better than complexes 1 and 3.The efficient nuclease activity of 2 is likely due to the enhanced stabilization of its Cu(I) species formed by ascorbic acid; moreover, the hydrophobic nature of the phen ligand also plays an important role. As previously reported, Cu(I) species have greater DNA binding affinity than Cu(II) species;71 therefore, π-stacking interactions are also an important factor for efficient DNA cleavage. This study reveals that 2 cleaves DNA more efficiently than the other complexes because of the strong interactions of the extended aromatic rings of the phen moiety.72
3.7 Molecular docking studies with DNA
All the copper(II) complexes were subjected to molecular docking with DNA using AutoDock Tools to confirm the results observed from the spectral and electrochemical analysis. Complexes 1–4 were analysed for their docking conformations in terms of energy, hydrogen bonding, and hydrophobic interactions with DNA. The observed results reveal that all the docked complexes can fit into the DNA more conveniently through contact with the DNA functional groups; however, they did not disrupt the DNA double helix, which resulted in binding energy values of −4.62, −4.83, −4.32 and −4.72 kcal mol−1, respectively, for complexes 1–4 (Table 5). Complex 2 showed a higher binding energy of −4.83 kcal mol−1. The decreasing order of binding energy is closely comparable with results obtained from the previously discussed spectral and electrochemical techniques. It was also noted that complexes 1 and 4 were bound in the region of GC-TA, whereas complexes 2 and 3 were bound in the region of GC–GC residues.38 Fig. 9 illustrates the docked models. The docking protocol was validated by removing ClO4 from complex 4 and docking it again (Fig. S13 and Table S1†).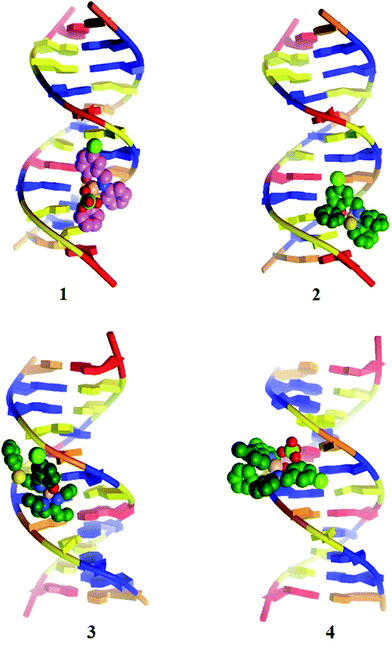 | ||
| Fig. 9 Molecular docked models of complex 1–4 with DNA (PDB ID: 423D). | ||
3.8 Protein binding studies
| I0/I = Ksv[Q] + 1 |
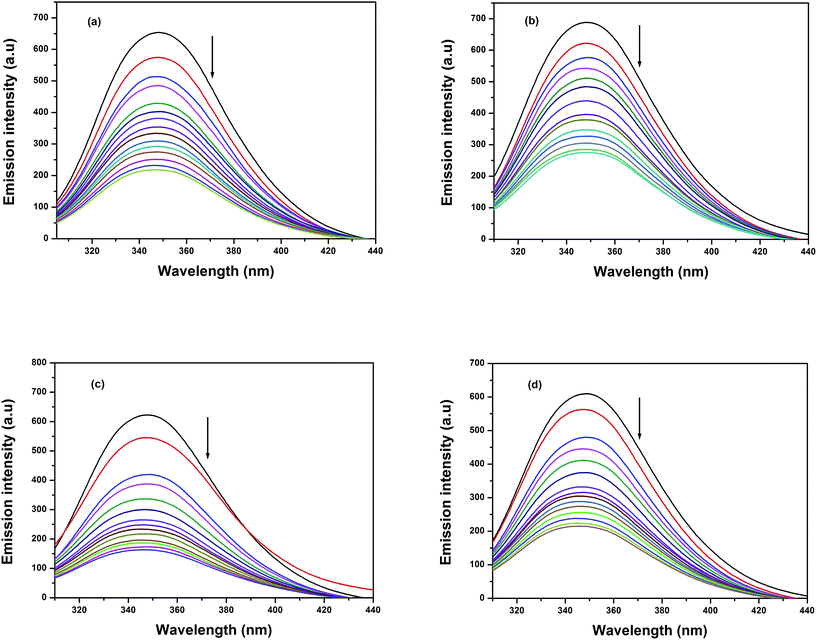 | ||
| Fig. 10 Fluorescence quenching curves of BSA (black solid line) in the absence and presence (other lines) of complexes (a) 1, (b) 2, (c) 3 and (d) 4. [BSA] = 1 μM and [complexes] = 0 to 20 μM. | ||
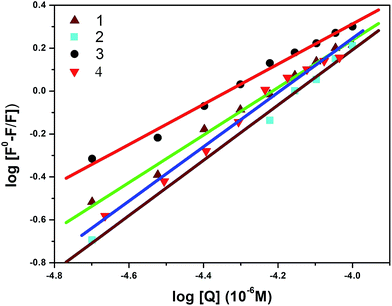
Furthermore, the equilibrium binding constant was evaluated using the Scatchard equation:74,75
log[(F0 – F)/F] = log![[thin space (1/6-em)]](https://www.rsc.org/images/entities/char_2009.gif) Kb + n Kb + n![[thin space (1/6-em)]](https://www.rsc.org/images/entities/char_2009.gif) log[Q] log[Q] |
| Complex | Kb (M−1) | Kq (M−1) | n |
|---|---|---|---|
| 1 | 7.53 × 10³ | 1.20 × 10⁵ | 0.94 |
| 2 | 1.14 × 10⁴ | 1.22 × 10⁵ | 0.95 |
| 3 | 2.06 × 10⁴ | 1.88 × 10⁵ | 1.07 |
| 4 | 5.63 × 10³ | 1.02 × 10⁵ | 0.92 |
3.9 Cytotoxicity
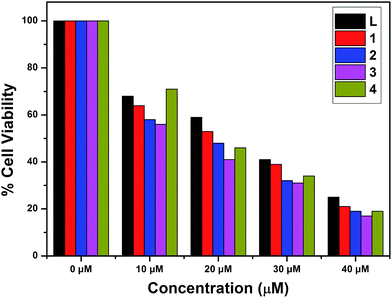
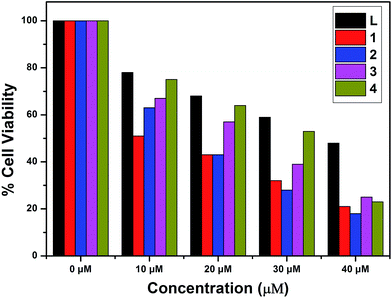
The in vitro cytotoxic activity of complexes 1–4 with A549 (lung cancer cells) and Huh7 (liver cancer cells) cells has been studied using MTT assays. The inhibitory concentrations of the complexes were found based on the dosage dependent cell viability. Complexes 1 and 3 exhibited high cytotoxicity against the A549 and Huh7 cell lines after incubation for 24 h [IC50 = 26.45 μM (A549) and 38.27 μM (Huh7)];78 the results are given in Fig. 14 and 15. Moreover, complexes 2 and 4 showed the lowest cytotoxicity against the A549 and Huh7 cell lines compared to complexes 1 and 3. However, complexes 1–4 showed enhanced cytotoxicity compared to the ligand. Among complexes 1–4, complex 1 demonstrated the most efficient anticancer properties. The inhibitory concentration values [IC50] of complexes 1–4, along with the probe, are listed in Table 7.| Compound | IC50 | |
|---|---|---|
| A549 (μM) | Huh7 (μM) | |
| 1 | 21.06 | 10.64 |
| 2 | 15.93 | 16.84 |
| 3 | 12.32 | 23.01 |
| 4 | 18.74 | 31.65 |
| L | 26.45 | 38.27 |
4. Conclusion
A series of copper(II) complexes (1–4) with a single ligand and mixed ligands have been synthesized and characterized by analytical, spectral, electrochemical and single crystal X-ray diffraction techniques with a view to evaluate their biological applications. The single crystal X-ray crystallography of complex 4 reveals the presence of square planar geometry around the copper centre with slight distortion. The Kb values obtained from the absorption studies indicated that their DNA binding abilities were in the order of 2 > 4 > 3 > 1. These observed results demonstrated the effective interactions of the complexes with DNA base pairs in the minor groove through the strong partial intercalation mode due to the presence of aromatic rings in the ligand architecture and phen/bpy co-ligands. In addition, the dmbpy complex may have a significant hydrophobic interaction with DNA through the methyl groups on the bpy ring, which is relevant to the obtained higher binding constant compared to the bpy complex.All the complexes cleave supercoiled pUC18-DNA into its nicked circular form in the presence of ascorbic acid as a reducing agent; the phen complex exhibited greater cleavage efficiency than those of the other complexes. In addition, UV-visible and fluorescence spectroscopic results revealed that these complexes interact with serum protein (BSA) through the static mode. Molecular docking studies also confirmed the partial insertion of these complexes into the DNA backbone. Moreover, it is well known that metal complexes containing sulfur atoms connected to their metal centres may have better biological applications, whereas the copper complexes investigated in this manuscript also showed very significant biological properties although the S-donor atom did not coordinate with the central copper atom. These observed results may be due to the planarity and hydrophobicity of the diimine co-ligands. All these complexes showed significant cytotoxicity against A549 and Huh7 cancer cell lines.
Acknowledgements
The authors Dr J. A and S. K gratefully acknowledge the Department of Science and Technology (DST), New Delhi [Grant No. SB/FT/CS-175/2011] and the UGC, New Delhi [F. No. 42-247/2013 (SR) dated 12-03-2013] for financial support.References
- Z. Guo and P. J. Sadler, Angew. Chem., Int. Ed., 1999, 38, 1512–1531 CrossRef CAS.
- B. Rosenberg, L. Vam Camp, J. E. Trosko and V. H. Mansour, Nature, 1969, 222, 385–386 CrossRef CAS PubMed.
- Z. Wu, Q. Liu, X. Liang, X. Yang, N. Wang, X. Wang, H. Sun, Y. Lu and Z. Guo, J. Biol. Inorg. Chem., 2009, 14, 1313–1323 CrossRef CAS PubMed.
- D. S. Raja, N. S. P. Bhuvanesh and K. Natarajan, Dalton Trans., 2012, 41, 4365–4377 RSC.
- M. Jin Li, T. Yu Lan, X. Hui Cao, H. Hao Yang, Y. Shi, C. Yi and G. Nan Chen, Dalton Trans., 2014, 43, 2789–2798 RSC.
- E. Wong and C. M. Giandomenico, Chem. Rev., 1999, 99, 2451–2466 CrossRef CAS PubMed.
- A. M. Angeles Boza, P. M. Bradley, P. K. L. Fu, S. E. Wicke, J. Bacsa, K. M. Dunbar and C. Turro, Inorg. Chem., 2004, 43, 8510–8519 CrossRef CAS PubMed.
- P. J. Bednarski, F. S. Mackay and P. J. Sadler, Med. Chem., 2007, 7, 75–93 CAS.
- Y. B. Zeng, N. Yang, W. S. Liu and N. Tang, J. Inorg. Biochem., 2003, 97, 258–264 CrossRef CAS PubMed.
- V. S. Li, D. Choi, Z. Wang, L. S. Jimenez, M. S. Tang and H. Kohn, J. Am. Chem. Soc., 1996, 18, 2326–2331 CrossRef.
- G. Zuber, J. C. Quada and S. M. Hecht, J. Am. Chem. Soc., 1998, 120, 9368–9369 CrossRef CAS.
- S. M. Hecht, J. Nat. Prod., 2000, 63, 158–168 CrossRef CAS.
- J. C. G. Ramos, R. G. Murillo, F. C. Guzmán and L. R. Azuara, J. Mex. Chem. Soc., 2013, 57, 245–259 Search PubMed.
- P. Kalaivani, R. Prabhakaran, E. Vaishnavi, T. Rueffer, H. Lang, P. Poornima, R. Renganathan, V. Vijaya Padma and K. Natarajan, Inorg. Chem. Front., 2014, 1, 311–324 RSC.
- M. Alagesan, N. S. P. Bhuvanesh and N. Dharmaraj, Dalton Trans., 2013, 42, 7210–7223 RSC.
- C. Santini, M. Pellei, V. Gandin, M. Porchia, F. Tisato and C. Marzano, Chem. Rev., 2014, 114, 815–862 CrossRef CAS PubMed.
- L. R. Azuara and G. ME Bravo, Curr. Med. Chem., 2010, 17, 3606–3615 CrossRef.
- B. P. Esposito and R. Najjar, Coord. Chem. Rev., 2002, 232, 137–149 CrossRef CAS.
- J. Seetharamappa and B. P. Kamat, Chem. Pharm. Bull., 2004, 52, 1053–1057 CrossRef CAS PubMed.
- E. Sundaravadivel, S. Vedavalli, M. Kandaswamy, B. Varghese and P. Madankumar, RSC Adv., 2014, 4, 40763–40775 RSC.
- T. M. Sielecki, J. F. Boylan, P. A. Benfield and G. L. Trainor, J. Med. Chem., 1999, 43, 1–18 CrossRef.
- Z. Zang, L. Jin, X. Qian, M. Wei, Y. Wang, J. Wang, Y. Yang, Q. Xu, Y. Xu and F. Liu, ChemBioChem, 2007, 8, 113–121 CrossRef PubMed.
- S. Sarkar, P. K. Dhara, M. Nethaji and P. Chattopadhyay, J. Coord. Chem., 2009, 62, 817–824 CrossRef CAS.
- (a) H. Goldie and M. D. Felix, Cancer Res., 1951, 11, 73–80 CAS; (b) X. Wang and Z. Guo, Med. Chem., 2007, 7, 19–34 Search PubMed; (c) C. Jacob, G. I. Giles, N. M. Giles and H. Sies, Angew. Chem., Int. Ed., 2003, 42, 4742–4758 CrossRef CAS PubMed.
- J. D. Ranford, P. J. Sadler and D. A. Tocher, Dalton Trans., 1993, 22, 3393–3399 RSC.
- S. Ramakrishnan, V. Rajendiran, M. Palaniandavar, V. S. Periasamay, M. A. Akbarsha, B. S. Srinag and H. Krishnamurthy, Inorg. Chem., 2009, 48, 1309–1322 CrossRef CAS PubMed.
- S. Ramakrishnan, D. Shakthipriya, E. Suresh, V. S. Periasamy, M. A. Akbarsha and M. Palaniandavar, Inorg. Chem., 2011, 50, 6458–6471 CrossRef CAS PubMed.
- R. Loganathan, S. Ramakrishnan, E. Suresh, A. Riyasdeen, M. A. Akbarsha and M. Palaniandavar, Inorg. Chem., 2012, 51, 5512–5532 CrossRef CAS PubMed.
- M. Chikira, Y. Tomizava, D. Fukita, T. Sugizaki, N. Sugawara, T. Yamazaki, A. Sasano, S. Shindo, M. Palaniandavar and W. Anthroline, J. Inorg. Biochem., 2002, 89, 163–173 CrossRef CAS PubMed.
- B. Selvakumar, V. Rajendiran, P. U. Maheswari, H. S. Evans and M. Palaniandavar, J. Inorg. Biochem., 2006, 100, 316–330 CrossRef CAS PubMed.
- A. C. T. North, D. C. Phillips and F. S. Mathews, Acta Crystallogr., Sect. A: Cryst. Phys., Diffr., Theor. Gen. Crystallogr., 1968, 24, 348–351 CrossRef.
- G. M. Sheldrick, SHELXL97 and SHELXS97, University of Gottingen, Germany, 1997 Search PubMed.
- L. J. Farrugia, J. Appl. Crystallogr., 1997, 30, 565–566 CrossRef CAS.
- A. Meenongwa, R. F. Brissos, C. Soikum, P. Chaveerach, P. Gamez, Y. Trongpanich and U. Chaveerach, New J. Chem., 2015, 39, 664–675 RSC.
- M. F. Shubsda, J. Goodisman and J. C. Dabrowiak, J. Biochem. Biophys. Methods, 1997, 34, 73–79 CrossRef CAS PubMed.
- D. Shao, M. Shi, Q. Zhao, J. Wen, Z. Geng and Z. Wang, Z. Anorg. Allg. Chem., 2015, 641, 454–459 CrossRef CAS.
- V. Thamilarasan, A. Jayamani and N. Sengottuvelan, Eur. J. Med. Chem., 2015, 89, 266–278 CrossRef CAS PubMed.
- M. J. Frisch, G. W. Trucks, H. B. Schlegel, G. E. Scuseria, M. A. Robb, J. R. Cheeseman, G. Scalmani, V. Barone, B. Mennucci, G. A. Petersson, H. Nakatsuji, M. Caricato, X. Li, H. P. Hratchian, A. F. Izmaylov, J. Bloino, G. Zheng, J. L. Sonnenberg, M. Hada, M. Ehara, K. Toyota, R. Fukuda, J. Hasegawa, M. Ishida, T. Nakajima, Y. Honda, O. Kitao, H. Nakai, T. Vreven, J. A. Montgomery Jr, J. E. Peralta, F. Ogliaro, M. Bearpark, J. J. Heyd, E. Brothers, K. N. Kudin, V. N. Staroverov, R. Kobayashi, J. Normand, K. Raghavachari, A. Rendell, J. C. Burant, S. S. Iyengar, J. Tomasi, M. Cossi, N. Rega, J. M. Millam, M. Klene, J. E. Knox, J. B. Cross, V. Bakken, C. Adamo, J. Jaramillo, R. Gomperts, R. E. Stratmann, O. Yazyev, A. J. Austin, R. Cammi, C. Pomelli, J. W. Ochterski, R. L. Martin, K. Morokuma, V. G. Zakrzewski, G. A. Voth, P. Salvador, J. J. Dannenberg, S. Dapprich, A. D. Daniels, Ö. Farkas, J. B. Foresman, J. V. Ortiz, J. Cioslowski and D. J. Fox, Gaussian 09, Revision A.02, Gaussian Inc, Wallingford, CT, 2009 Search PubMed.
- K. P. S. Adinarayana and R. K. Devi, Bioinformation, 2011, 6, 74–77 CrossRef PubMed.
- J. Haribabu, K. Jeyalakshmi, Y. Arun, N. S. P. Bhuvanesh, P. T. Perumal and R. Karvembu, RSC Adv., 2015, 5, 46031–46049 RSC.
- T. Mossman, J. Immunol. Methods, 1983, 65, 55–63 CrossRef.
- M. Kalita, T. Bhattacharjee, P. Gogoi, P. Barman, R. D. Kalita, B. Sarma and S. Karmakar, Polyhedron, 2013, 60, 47–53 CrossRef CAS.
- T. Rosu, E. Pahontu, C. Maxim, R. Georgescu, N. Stanica and A. Gulea, Polyhedron, 2011, 30, 154–162 CrossRef CAS.
- P. M. Krishna and K. H. Reddy, Inorg. Chim. Acta, 2009, 362, 4185–4190 CrossRef CAS.
- R. Saswati, C. S. Dinda, E. Schmiesing, Y. P. Sinn, M. Patil, H. Nethaji, E. Stoeckli and R. Acharyya, Polyhedron, 2013, 50, 354–363 CrossRef CAS.
- D. Lahiri, R. Majumdar, D. Halleck, T. K. Goswami Rajan, R. Dighe and A. R. Chakravarty, J. Inorg. Biochem., 2011, 105, 1086–1094 CrossRef CAS PubMed.
- R. R. Pulimamidi, R. Nomula, R. Pallepogu and H. Shaik, Eur. J. Med. Chem., 2014, 79, 117–127 CrossRef CAS PubMed.
- T. Gupta, S. Dhar, M. Nethaji and A. Chakravarty, Dalton Trans., 2004, 1896–1900 RSC.
- (a) Q. L. Zhang, J. G. Liu, H. Chao, G. Q. Xue and L. N. Ji, J. Inorg. Biochem., 2001, 83, 49–55 CrossRef CAS PubMed; (b) Z. C. Liu, B. D. Wang, B. Li, Q. Wang, Z. Y. Yang, T. R. Li and Y. Li, Eur. J. Med. Chem., 2010, 45, 5353–5361 CrossRef CAS PubMed.
- P. Krishnamoorthy, P. Sathyadevi, R. R. Butorac, A. H. Cowley, N. S. P. Bhuvanesh and N. Dharmaraj, Dalton Trans., 2012, 41, 4423–4436 RSC.
- J. G. Liu, Q. L. Zhang and L. N. Ji, Transition Met. Chem., 2001, 26, 733–738 CrossRef CAS.
- H. L. Chan, H. Q. Liu, B. C. Tzeng, Y. S. You, S. M. Peng, M. Yang and C. M. Che, Inorg. Chem., 2002, 41, 3161–3171 CrossRef CAS PubMed.
- (a) V. Rajendiran, R. Karthik, M. Palaniandavar, H. S. Evans, V. S. Periasamy, M. A. Akbarsha, B. S. Srinag and H. Krishnamurthy, Inorg. Chem., 2007, 46, 8208–8221 CrossRef CAS PubMed; (b) V. Rajendiran, M. Palaniandavar, P. Swaminathan and L. Uma, Inorg. Chem., 2007, 46, 10446–10448 CrossRef CAS PubMed.
- R. Loganathan, S. Ramakrishnan, E. Suresh, M. Palaniandavar, A. Riyasdeen and M. A. Akbarsha, Dalton Trans., 2014, 43, 6177–6194 RSC.
- M. J. Waring, J. Mol. Biol., 1965, 13, 269–282 CrossRef CAS PubMed.
- I. Changzheng, W. Jigui, W. Liufang, R. Min, J. Naiyang and G. Jie, J. Inorg. Biochem., 1999, 73, 195–202 CrossRef.
- J. R. Lakowicz and G. Weber, Biochemistry, 1973, 12, 4161–4170 CrossRef CAS PubMed.
- K. Jeyalakshmi, Y. Arun, N. S. P. Bhuvanesh, P. T. Perumal, A. Sreekantha and R. Karvembu, Inorg. Chem. Front., 2015, 2, 780–798 RSC.
- M. Ganeshpandian, S. Ramakrishnan, M. Palaniandavar, E. Suresh, A. Riyasdeen and M. A. Akbarsha, J. Inorg. Biochem., 2014, 140, 202–212 CrossRef CAS PubMed.
- A. Barve, A. Kumbhar, M. Bhat, B. Joshi, R. Butcher, U. Sonawane and R. Joshi, Inorg. Chem., 2009, 48, 9120–9132 CrossRef CAS PubMed.
- R. K. Gupta, G. Sharma, R. Pandey, A. Kumar, B. Koch, P. Z. Li, Q. Xu and D. S. Pandey, Inorg. Chem., 2013, 52, 13984–13996 CrossRef CAS PubMed.
- S. Mahadevan and M. Palaniandavar, Inorg. Chem., 1998, 37, 693–700 CrossRef CAS.
- M. Sirajuddin, S. Ali and A. Badshah, J. Photochem. Photobiol., B, 2013, 124, 1–19 CrossRef CAS PubMed.
- Y. Song, P. Yang, M. Yang, J. Kang, S. Qin, B. Lu and L. Wang, Transition Met. Chem., 2003, 28, 712–716 CrossRef CAS.
- J. Lakshmipraba, S. Arunachalam, A. Riyasdeen, R. Dhivya and M. A. Akbarsha, J. Photochem. Photobiol., B, 2015, 142, 59–67 CrossRef CAS PubMed.
- J. Annaraj, S. Srinivasan, K. M. Ponvel and P. R. Athappan, J. Inorg. Biochem., 2005, 99, 669–676 CrossRef CAS PubMed.
- L. Li, Q. Guo, J. Dong, T. Xu and J. Li, J. Photochem. Photobiol., B, 2013, 125, 56–62 CrossRef CAS PubMed.
- (a) S. Kathiresan, T. Anand, S. Mugesh and J. Annaraj, J. Photochem. Photobiol., B, 2015, 148, 290–301 CrossRef CAS PubMed; (b) H. Pezzano and F. Podo, Chem. Rev., 1980, 80, 365–401 CrossRef CAS; (c) B. Saha, Md. M. Islam, S. Paul, S. Samanta, S. Ray, C. R. Santra, S. R. Choudhury, B. Dey, A. Das, S. Ghosh, S. Mukhopadhyay, G. S. Kumar and P. Karmakar, J. Phys. Chem. B, 2010, 114, 5851–5861 CrossRef CAS PubMed.
- S. Schäfer, I. Ott, R. Gust and W. S. Sheldrick, Eur. J. Inorg. Chem., 2007, 2007, 3034–3046 CrossRef.
- S. Ramakrishnan and M. Palaniandavar, Dalton Trans., 2008, 3866–3878 RSC.
- S. Mahadevan and M. Palaniandavar, Inorg. Chem., 1998, 37, 3927–3934 CrossRef CAS PubMed.
- S. Ramakrishnan, D. Shakthipriya, E. Suresh, V. S. Periasamy, M. A. Akbarsha and M. Palaniandavar, Inorg. Chem., 2011, 50, 6458–6471 CrossRef CAS PubMed.
- C. V. Dang, R. F. Ebert and W. R. Bell, J. Biol. Chem., 1985, 260, 9713–9719 CAS.
- E. Sundaravadivel, S. Vedavalli, M. Kandaswamy, B. Varghese and P. Madankumar, RSC Adv., 2014, 4, 40763–40775 RSC.
- J. Lu, Q. Sun, J. L. Li, L. Jiang, W. Gu, X. Liu, J. L. Tian and S. P. Yan, J. Inorg. Chem., 2014, 137, 46–56 CAS.
- (a) E. Ramachandran, D. S. Raja, N. S. P. Bhuvanesh and K. Natarajan, Dalton Trans., 2012, 41, 13308–13323 RSC; (b) D. S. Raja, N. S. P. Bhuvanesh and K. Natarajan, Dalton Trans., 2012, 41, 4365–4377 RSC.
- D. S. Raja, G. Paramaguru, N. S. P. Bhuvanesh, J. H. Reibenspies, R. Renganathan and K. Natarajan, Dalton Trans., 2011, 40, 4548–4559 RSC.
- T. K. Goswami, B. V. Chakravarthi, M. Roy, A. A. Karande and A. R. Chakravarty, Inorg. Chem., 2011, 50, 8452–8464 CrossRef CAS PubMed.
Footnote |
| † Electronic supplementary information (ESI) available: 1H NMR, 13C NMR, UV-vis, ESI-MS, CV and DPV of the ligand and complexes 1–4. CCDC 1401459 for [Cu(L)(dmbpy)]ClO4 (4). For ESI and crystallographic data in CIF or other electronic format see DOI: 10.1039/c5ra20607c |
| This journal is © The Royal Society of Chemistry 2016 |

