Methylviologen mediated electrosynthesis of gold nanoparticles in the solution bulk†
Vitaliy V. Yanilkin*a,
Natalya V. Nastapovaa,
Gulnaz R. Nasretdinovaa,
Svetlana V. Fedorenkoa,
Michael E. Jilkinb,
Asiya R. Mustafinaa,
Aidar T. Gubaidullina and
Yuri N. Osinb
aA.E. Arbuzov Institute of Organic and Physical Chemistry, Kazan Scientific Center, Russian Academy of Sciences, Arbuzov St. 8, 420088 Kazan, Russia. E-mail: yanilkin@iopc.ru
bKazan Federal University, Interdisciplinary Center for Analytical Microscopy, Kremlevskaya St. 18, 420018 Kazan, Russia
First published on 10th December 2015
Abstract
Electrosynthesis of gold nanoparticles (AuNp) was carried out by methylviologen mediated reduction of Au(I) at potentials of the MV2+/MV˙+ redox couple in water/0.1 M NaCl medium, in the absence and in the presence of stabilizers. In all the cases, AuNp are formed in the solution bulk and are not deposited on the cathode. In the absence of stabilizers, AuNp (14–100 nm) coalesce to give aggregates of various shapes that eventually form a deposit. Sonication reversibly destructs the deposit into nanoparticles. In the presence of alkylamino-modified silicate nanoparticles (SiO2–NHR, 120–160 nm), spherical AuNp (≤20 nm) are bound as inclusions in the SiO2–NHR surface layer. Polyvinylpyrrolidone (40![[thin space (1/6-em)]](https://www.rsc.org/images/entities/char_2009.gif) 000 D) stabilizes spherical AuNp with a mean diameter of 5–14 nm. All the particles were characterized by electron microscopy methods (SEM, STEM) and X-ray powder diffraction (XRPD).
000 D) stabilizes spherical AuNp with a mean diameter of 5–14 nm. All the particles were characterized by electron microscopy methods (SEM, STEM) and X-ray powder diffraction (XRPD).
1 Introduction
Currently, metal nanoparticles attract much scientific interest due to their unusual physical and chemical properties that differ from those of the bulk metal and due to the wide variety of their practical uses in catalysis, biomedicine, optics, electronics, etc.1–7 Gold nanoparticles (AuNp) that have been long known as colloid gold are the most common and most widely used, in biomedicine in particular. AuNp are rather stable. They are negatively charged in the presence of chloride ions due to adsorption of AuCl2− complex ions on their surface.8 Their color varies depending on size. They manifest biocide and catalytic properties.6 Diverse methods are used to obtain gold nanoparticles. The known preparation methods, properties and applications have been summarized rather comprehensively in monograph6 and in reviews.3,9 A simple and convenient, and hence the most popular method to synthesize AuNp involves chemical reduction of salts and complexes of gold(I,III), most often gold(III), AuCl4− ions in particular. All these compounds are readily reducible, therefore AuNp can be obtained under various conditions. According to estimates,6 about 100 of diverse reducing agents have been used to obtain AuNp. It is believed that pioneering studies were performed by Faraday10 and Zsigmondy11 who used formaldehyde, ethanol and white phosphorus as reducing agents.Electrochemical reduction of metal ions and complexes is a classical method for industrial preparation of metals, galvanic coatings, and black metal on electrode surfaces.12 The electrochemical method is also popular for the preparation of metal nanoparticles, including gold nanoparticles,13 immobilized on a conductive substrate (electrode).14 However, electrochemical methods for the preparation of metal nanoparticles in other states (in solution, on non-conductive solid carriers, in matrices, in nanocapsules, etc.), which are also in demand, have been developed much less. We were able to find only a few publications15,16 on the preparation of AuNp of this kind. This is primarily due to the fact that when a metal is reduced on an electrode, it is deposited on it. For example, if this method is used to obtain silver nanoparticles in a solution, up to 80% of the metal is deposited on the electrode surface.17,18 The deposition problem is partially solved by combining the process of metal formation during a short current pulse with its subsequent transfer from the electrode surface into the solution by sonication of the working electrode (pulse sonoelectrochemistry),19–21 as well as by using bulky tetraalkylammonium and phosphonium salts as the supporting electrolyte (the Reetz method).15,16,22–25
We believe that another, simpler and more efficient approach to the electrochemical preparation of metal and alloy nanoparticles in solution bulk may involve moving the electrochemical reduction of ions or complexes from the electrode surface to the solution bulk using mediators. In this case, the mediator is reduced on the cathode and the reduced form of the mediator reduces metal ions (complexes) in the solution bulk. Thus, the undesired metal deposition on the electrode is prevented or minimized. Furthermore, the method provides a fundamentally new possibility to generate and obtain metal nanoparticles in the solution bulk in those cases where reduction of metal ions directly on the electrode is difficult or impossible, e.g., due to insolubility or low solubility of salts, ion encapsulation in micelles, polymer globules or other matrices, or immobilization on a non-conductive solid carrier.
In chemical synthesis of a finely-dispersed metal using alkali metals to reduce metal salts in ethereal or hydrocarbon solvents according to the Rieke process, organic electron carriers (naphthalene, biphenyl, anthracene, etc.) are widely used as mediators.26–29 However, due to the stringent requirements for aprotic properties of the medium, the method has lost its synthetic significance and was not used in recent years according to Kharisov's analysis.7 However, mediated electrosynthesis lacks these restrictions, and in fact, it is widely used. Based on the idea of mediated reduction of metal ions,30 we recently showed the principal possibility of efficient electrosynthesis of Pd and Ag nanoparticles in solution bulk by mediated electrochemical reduction of [PdCl4]2− in 60% aqueous DMF31,32 or DMSO33 and of in situ anodically generated Ag+ ions in DMF34,35 using methylviologen (MV2+) and/or tetraviologen calix[4]resorcines with n-alkyl substituents in the resorcinol rings as the mediator, at potentials of the MV2+/MV˙+, MVCA-Cn8+/MVCA-Cn4˙+ (n = 1, 5, 10) redox couples. Tetraviologen calix[4]resorcines simultaneously showed the properties of nanoparticle stabilizers in solution and/or on the electrode surface. Electrosynthesis of ultrasmall palladium nanoparticles (3–8 nm) immobilized on the surface of water-soluble silicate nanoparticles modified with alkylamino groups (SiO2–NHR) (120–160 nm) was carried out by reduction of [PdCl4]2− in aqueous medium with methylviologen as the mediator.36 Using the methylviologen moieties of a polymer nanoparticle (a copolymer of tetraviologen calix[4]resorcine with styrene), a nanocomposite material was obtained, namely, polymer nanoparticles (40–50 nm) with incapsulated ultrasmall palladium nanoparticles (4–7 nm).37 In the latter case, the mediator that has nanocapsule pores simultaneously plays the role of a stabilizer. A silicate core/silver shell nanocomposite material was obtained by reduction of insoluble AgCl in water in the presence of SiO2–NHR silicate nanoparticles.38 The efficiency of the mediated electrosynthesis method was also shown in the preparation of cobalt nanoparticles in aprotic DMF by potentiostatic electrolysis in an undivided cell at controlled potentials of anthracene reduction (mediator) to an radical anion at room temperature using a Co anode as an in situ Co(II) source.39
In this paper, we demonstrate for the first time the capabilities of mediated electrosynthesis for the preparation of gold nanoparticles in an aqueous medium. In chemical synthesis, metal nanoparticles are usually obtained by reduction of Au(III) salts and complexes. However, we obtained them by methylviologen mediated reduction of AuCl, both in the absence and in the presence of stabilizers, namely silicate nanoparticles modified with alkylamino groups (SiO2–NHR) and polyvinylpyrrolidone.
2 Experimental section
2.1 Chemicals
Methylviologen dichloride MV2+·2Cl−, AuCl, polyvinylpyrrolidone, and the supporting NaCl electrolyte (Aldrich) were used as purchased without additional purification. The alkylamino-modified silica nanoparticles (SiO2–NHR) were synthesized through the well-known Stöber procedure with the use of 3-[2-(2-aminoethylamino)ethylamino]-propyltrimethoxysilane as previously described.36 Twice distilled water was used in the experiments.2.2 Electrosynthesis of AuNp
Preparative electrolysis was carried out in a three-electrode cell separated with a porous glass diaphragm in potentiostatic mode (−0.9 V vs. SCE) in argon atmosphere at room temperature (T = 295 K) using a P-30J potentiostat. For electrolysis, the working solution was prepared in the following way. Electrolysis 1![[thin space (1/6-em)]](https://www.rsc.org/images/entities/char_2009.gif) :
:![[thin space (1/6-em)]](https://www.rsc.org/images/entities/char_2009.gif) 10 ml of an aqueous solution containing 2 mM MV2+·2Cl− (6.3 mg), 1.5 mM AuCl (3.5 mg), and 0.1 M NaCl (58.5 mg). Electrolysis 2: 20 ml of an aqueous solution containing 2 mM MV2+·2Cl− (12.6 mg), 1.5 mM AuCl (7.0 mg), 1.0 g l−1 of SiO2–NHR silica nanoparticles (20 mg) and 0.1 M NaCl (117.0 mg). Electrolysis 3: 10 ml of an aqueous solution containing 2 mM MV2+·2Cl− (6.3 mg), 1.5 mM AuCl (3.5 mg), 75 mM (with respect to monomeric unit) PVP (83.3 mg), and 0.1 M NaCl (58.5 mg). During the electrolysis, the solution was stirred with a magnetic stirrer. A glassy carbon (GC) plate was used as the working electrode (S = 5.2 cm2 in electrolysis 1, 3 and 9 cm2 in electrolysis 2). SCE was used as the reference electrode and was connected by a bridge filled with the supporting solution. A Pt wire immersed in the supporting solution was used as the auxiliary electrode.
10 ml of an aqueous solution containing 2 mM MV2+·2Cl− (6.3 mg), 1.5 mM AuCl (3.5 mg), and 0.1 M NaCl (58.5 mg). Electrolysis 2: 20 ml of an aqueous solution containing 2 mM MV2+·2Cl− (12.6 mg), 1.5 mM AuCl (7.0 mg), 1.0 g l−1 of SiO2–NHR silica nanoparticles (20 mg) and 0.1 M NaCl (117.0 mg). Electrolysis 3: 10 ml of an aqueous solution containing 2 mM MV2+·2Cl− (6.3 mg), 1.5 mM AuCl (3.5 mg), 75 mM (with respect to monomeric unit) PVP (83.3 mg), and 0.1 M NaCl (58.5 mg). During the electrolysis, the solution was stirred with a magnetic stirrer. A glassy carbon (GC) plate was used as the working electrode (S = 5.2 cm2 in electrolysis 1, 3 and 9 cm2 in electrolysis 2). SCE was used as the reference electrode and was connected by a bridge filled with the supporting solution. A Pt wire immersed in the supporting solution was used as the auxiliary electrode.
When the electrolysis was over, the solution was controlled by cyclic voltammetry (CV) on the indicator glassy carbon disk electrode (Ø = 3.4 mm).
2.3 Instrumentation
![[thin space (1/6-em)]](https://www.rsc.org/images/entities/char_2009.gif) 000 rpm) for 15 minutes. The precipitate was washed with water (3 times) and dispersed in double-distilled water by sonication. For the SEM analysis, the resulting solution was applied to the surface of a titanium foil. Then the sample was exsiccated by low heating (not higher than 40 °C). The morphology of the sample surfaces was characterized in plan-view with SEM using a high-resolution. Merlin microscope from Carl Zeiss combined with ASB (Angle Selective Backscattering) and SE InLens (Secondary Electrons Energy selective Backscattering) detectors, which was also equipped for energy-dispersive X-ray spectroscopy (EDX) analysis with AZTEC X-MAX energy-dispersion spectrometer from Oxford Instruments. The analysis of nanoparticles was carried out using a Merlin field-emission scanning electron microscope (STEM-mode). The suspension of nanoparticles was deposited on a formvar (tm)/carbon coated 3 mm copper grid, then dried and analyzed using the scanning electron microscope STEM detector.
000 rpm) for 15 minutes. The precipitate was washed with water (3 times) and dispersed in double-distilled water by sonication. For the SEM analysis, the resulting solution was applied to the surface of a titanium foil. Then the sample was exsiccated by low heating (not higher than 40 °C). The morphology of the sample surfaces was characterized in plan-view with SEM using a high-resolution. Merlin microscope from Carl Zeiss combined with ASB (Angle Selective Backscattering) and SE InLens (Secondary Electrons Energy selective Backscattering) detectors, which was also equipped for energy-dispersive X-ray spectroscopy (EDX) analysis with AZTEC X-MAX energy-dispersion spectrometer from Oxford Instruments. The analysis of nanoparticles was carried out using a Merlin field-emission scanning electron microscope (STEM-mode). The suspension of nanoparticles was deposited on a formvar (tm)/carbon coated 3 mm copper grid, then dried and analyzed using the scanning electron microscope STEM detector.3 Results and discussion
3.1 Electrosynthesis of AuNp in H2O/0.1 M NaCl medium in the absence of a stabilizer
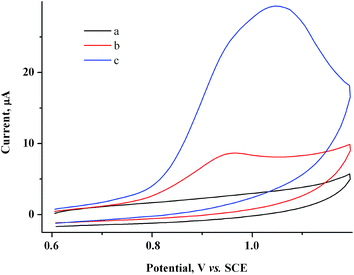
To determine the feasibility of mediated electrosynthesis of gold nanoparticles and to choose the electrosynthesis parameters, we first performed a CV study of AuCl and methylviologen MV2+ solutions and their mixtures in H2O/0.1 M NaCl medium. There are no oxidation peaks on the CV curves of AuCl in the anodic region up to +1.20 V (Fig. 1c), whereas the cathodic region contains two irreversible reduction peaks (Fig. 1a and b). The potentials of these peaks ( ≈ +0.29 V and
  ≈ −0.08 V vs. SCE) are much more positive than the reference value12 of the Au(I) reduction half-wave potential in 5 M NaCl supporting solution on mercury electrode (E1/2 = −1.06 V). It should be noted that the potentials that we obtained are in better agreement with the fact that chemical reduction of gold compounds occurs quite readily.6 In case of repeated recording of CV curves with mechanical surface cleaning after each cycle, some variations in potential, current, shape and steepness of the first peak and in the ratio of the first and second peak currents are noticeable. However, the first peak is always predominant and its current is diffusion controlled (ip1 ∼ ν1/2). Upon potential reversal both after the first (Er = +0.05 V) (Fig. 1a) and second reduction peak (Er = −0.85 V) (Fig. 1b), the anodic branch of the cyclic voltammogram shows an irreversible reoxidation peak at
  = +0.92 V. The anodic voltammogram of bulk gold electrode in sulfuric acid medium in the presence of chloride ions has the same shape and contains active dissolution, passivation and transpassive regions.12 Apparently, the A1 peak corresponds to oxidation of (Au0)
![[n with combining low line]](https://www.rsc.org/images/entities/i_char_006e_0332.gif) particles deposited on the GC electrode. It is known that in the presence of excess chloride ions, Au(I) can exist in solution both as AuCl and as AuCl2− complex ion.6 Furthermore, adsorption of organic admixtures from the solution on a small fraction of a hydrophobic glassy carbon electrode is possible. These components can create a barrier to reduction and thus cause a second peak to appear. We did not study the nature of the species which are reduced at the potentials of these two peaks. However, it is quite obvious that one-electron reduction of Au(I) compounds to (Au0)n occurs at both potentials.
particles deposited on the GC electrode. It is known that in the presence of excess chloride ions, Au(I) can exist in solution both as AuCl and as AuCl2− complex ion.6 Furthermore, adsorption of organic admixtures from the solution on a small fraction of a hydrophobic glassy carbon electrode is possible. These components can create a barrier to reduction and thus cause a second peak to appear. We did not study the nature of the species which are reduced at the potentials of these two peaks. However, it is quite obvious that one-electron reduction of Au(I) compounds to (Au0)n occurs at both potentials.
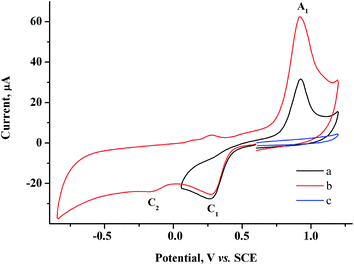 | ||
| Fig. 1 CV curves of 1.5 mM AuCl in the cathodic region in case of potential reversal at +0.05 V (a), −0.85 V (b) and in the anodic region (c). GC, H2O/0.1 M NaCl, scan rate 100 mV s−1. | ||
By converting the CV curve in the potential range from the starting value (+0.60 V) to the reversal potential (+0.05 V) and further to +1.20 V into a curren–time relationship i–τ (Fig. S1 in the ESI†) and integrating this relationship separately for reduction and reoxidation, we determined the quantity of electricity values (Qred and Qox), and used the Faraday law (n = 1) to determine the mass of the generated metal (Augen) and the metal deposited on the electrode surface and oxidized at the +0.92 V peak (Audep) during the CV curve recording (Table S1 in the ESI†). The results of a similar calculation for silver35 showed that the entire generated metal was deposited and oxidized at the corresponding peak. However, in this case, under CV conditions only a fraction (65%) of the generated metal (Au0)n is deposited and oxidized at the A1 peak. Apparently, the remaining fraction is also deposited but, like the bulk metal, it is passivated and has no time to undergo oxidation at the A1 peak. The much higher oxidation current at +1.20 V in comparison with the supporting solution can indicate that gold is present on the electrode surface after oxidation at the A1 peak. On the other hand, it may not be ruled out that a fraction of the metal generated is transferred to the solution as colloid particles. The metal amount Augen and Audep increases if the potential is reversed at −0.85 V due to an increase in the electroreduction time (Table S1 in the ESI†). However, the amount of Augen cannot be estimated in this case since gold particles are deposited on the GC surface during CV recording, and a considerable reduction current is observed on such a modified electrode in the supporting solution even at −0.85 V (Fig. 1). On a non-modified GC electrode, the same current in supporting solution is reached at −1.30 V only.
Two reversible one-electron peaks are recorded for methylviologen MV2+. They are typical of this compound42 and correspond to the reduction to MV˙+ radical cation and neutral diamine MV0 (Fig. 2a and b).
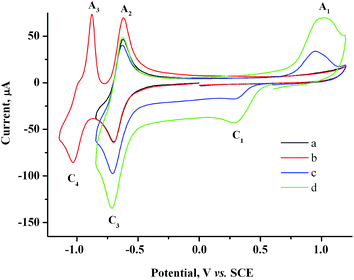 | ||
| Fig. 2 CV curves for 2.0 mM MV2+ in the presence of various AuCl concentrations: 0 mM (a and b), 0.5 mM (c), 1.5 mM (d). GC, H2O/0.1 M NaCl, scan rate 100 mV s−1. | ||
Both reduction steps have much more negative potentials ( = −0.70 V and
  ≈ −1.03 V) than the Au(I) peaks. If both 2.0 mM MV2+ and 1.5 mM AuCl are present in the solution, the overall CV curve matches the additive curve of the components taken separately (Fig. 2d). The only difference is that the second reduction peak C2 of Au(I) is missing for the mixture, while the first peak C1 grows accordingly. Most likely, MV2+ solubilizes the organic compounds adsorbed on GC and thus removes the barrier and activates the entire electrode surface. Under these conditions, C1 is also a diffusion peak. Its current increases with an increase in AuCl concentration, and the first peak of methylviologen reduction remains reversible (Fig. 2). Under CV conditions, the presence of MV2+ in the solution does not result in a decrease in the amount of generated and oxidized deposited gold (Table S1 in the ESI†). However, its presence clearly affects the Audep amount if the potential is not varied in time but set at once at the first step of methylviologen reduction, i.e., under conditions of microelectrolysis without solution stirring. In fact, the Audep amount increases with an increase in electrode exposure time at Au(I) reduction potentials (+0.20 V) (Fig. 3, Table S1 in the ESI†).
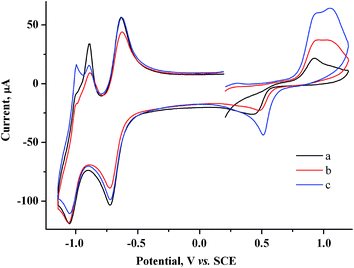 | ||
| Fig. 3 CV curves for the system containing 2.0 mM MV2+ + 1.5 mM AuCl after keeping the electrode at +0.20 V for a period of (s): 0 (a), 30 (b), 60 (c). GC, H2O/0.1 M NaCl, ν = 100 mV s−1. | ||
At similar electrolysis times and at potentials of MV˙+ radical cation generation (−0.85 V), the Audep amount is much smaller and decreases with an increase in exposure time (Fig. 4, Table S1 in the ESI†).
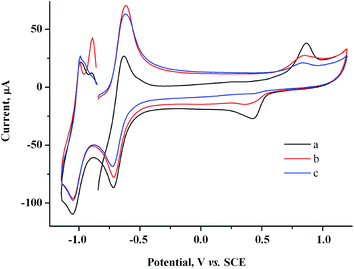 | ||
| Fig. 4 CV curves for the system containing 2.0 mM MV2+ + 1.5 mM AuCl after keeping the electrode at −0.85 V for a period of (s): 0 (a), 30 (b), 60 (c). GC, H2O/0.1 M NaCl, ν = 100 mV s−1. | ||
For example, if microelectrolysis is carried out for 1 min at this potential, the Audep amount is 5.8 times smaller than the amount deposited at +0.20 V. Since the generated metal amount is the same as at potentials of the C1 peak, the result obtained indicates unambiguously that Au(I) is reduced not only on the electrode but also at some distance from the electrode, in the solution bulk, by the MV˙+ radical cations generated (Scheme 1). Reduction of Au(I) directly on the electrode and in mediated mode in the near-electrode zone of the solution occurs only in the initial time period of the electrolysis, and the metal generated is adsorbed and deposited on the electrode. With time, as MV˙+ is accumulated and diffuses to the solution bulk, the zone of mediated reduction moves from the electrode surface to the solution bulk. The entire Au(I) amount that is transported due to diffusion from the solution bulk is reduced by the MV˙+ radical cations existing in this zone, while reduction of the former on the electrode surface ceases. The MV˙+ radical cations create some kind of protective layer in the cathode zone, which limits or prevents the reduction of Au(I) ions directly on the electrode. In other words, methylviologen MV2+ acts as an efficient mediator of Au(I) electrochemical reduction at potentials of the MV2+/MV˙+ redox couple. The data obtained also mean that under CV conditions, deposition of the major fraction of the metal occurs during the period when the potential is scanned from the C1 peak to the bottom of the C3 peak. It follows from the fact of Audep decrease with an increase in electrolysis time that methylviologen MV˙+ radical cations facilitate the dissolution of the gold particles deposited on the electrode.
Based on the CV data obtained, gold nanoparticles were obtained in the solution bulk by preparative electrolysis of a mixture of 2 mM MV2+ and 1.5 mM AuCl on a GC electrode at controlled potential of MV˙+ radical cation generation (−0.90 V). Since at −0.90 V on a GC electrode modified by gold particles, a fraction of current is also consumed for reduction of the supporting solution, we passed an excess (20%) amount of electricity with respect to AuCl: Q = 1.2 F. The pale yellow starting solution turns gray-black and turbid during the electrolysis. The blue color that is characteristic of methylviologen MV˙+ radical cations42 is not observed in the solution, indicating that they quickly react with Au(I). The current gradually decreases during the electrolysis (9.3 min) (I ≈ 4.2 → 3.1 mA). A dark suspension is visually observed after the electrolysis. According to CV measurements on the indicator electrode, the solution contains methylviologen in a nearly initial concentration and only traces of Au(I) (Fig. 5), i.e., preparative electrolysis results in quantitative mediated reduction of Au(I) (Scheme 1). No noticeable amounts of the metal are deposited on the cathode during this process, as follows from the constancy of the cathode mass. Hence, the entire amount of generated metallic gold (m = 2.7 mg) stays in the solution. The gold particles in the solution manifest themselves on the CV curves as an oxidation peak that which appears upon electrode exposure in the solution without stirring and without applying a potential and that increases with exposure time (Fig. 6).
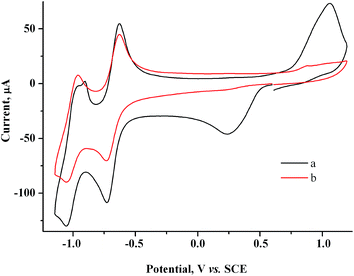 | ||
| Fig. 5 CV curves for the 2.0 mM MV2+ + 1.5 mM AuCl system before (a) and after electrolysis at −0.9 V (Q = 1.2 F with respect to AuCl) (b). GC, H2O/0.1 M NaCl, ν = 100 mV s−1. | ||
In a few minutes after stirring is stopped, the metal suspension settles completely to leave a colorless transparent solution. The precipitate was isolated by centrifugation (10 min at 15![[thin space (1/6-em)]](https://www.rsc.org/images/entities/char_2009.gif) 000 rpm) and washed three times with water. As the precipitate is dispersed into water by sonication, the solution acquires a lilac color of gold nanoparticles.6 However, in a few seconds after ultrasound is turned off, the transparent lilac solution becomes as gray-black and turbid as the solution after the electrolysis. Apparently, the non-stabilized gold nanoparticles formed during the electrolysis are aggregated with time into larger particles that form a precipitate. Upon sonication, the aggregates decompose into nanoparticles, but undergo aggregation again after ultrasound is turned off.
000 rpm) and washed three times with water. As the precipitate is dispersed into water by sonication, the solution acquires a lilac color of gold nanoparticles.6 However, in a few seconds after ultrasound is turned off, the transparent lilac solution becomes as gray-black and turbid as the solution after the electrolysis. Apparently, the non-stabilized gold nanoparticles formed during the electrolysis are aggregated with time into larger particles that form a precipitate. Upon sonication, the aggregates decompose into nanoparticles, but undergo aggregation again after ultrasound is turned off.
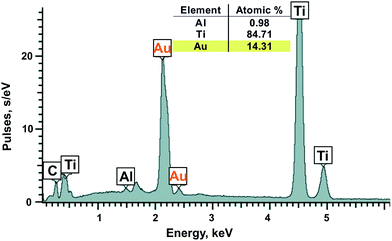
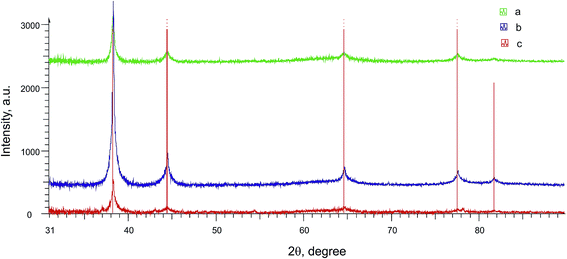
Metal nanoparticles from the lilac solution were deposited onto a support and studied by electron microscopy and analyzed for elementary composition. One can see from SEM (Fig. 7A) and STEM images (Fig. 7B) that the nanoparticles have various shapes and sizes (from 14 to 100 nm). They are composed of almost pure gold according to elementary analysis (Ti and Al are from support) (Fig. 8). Larger particles are apparently aggregates of smaller particles and therefore have various shapes. As it was confirmed by XRPD analysis (Fig. 9, curve a) the main interference peaks correspond to a crystalline gold (code no. 00-004-0784 in the PDF database). The diffuse nature of most of the diffraction peaks suggest about very small linear dimensions of the gold crystallites, i.e., that it is nanostructured. The mean dimensions of the gold crystallites calculated from the interference peaks wide are in the range of 12–26 nm.
3.2 Electrosynthesis of AuNp in H2O/0.1 M NaCl medium in the presence of SiO2–NHR silicate nanoparticles modified by alkylamino groups
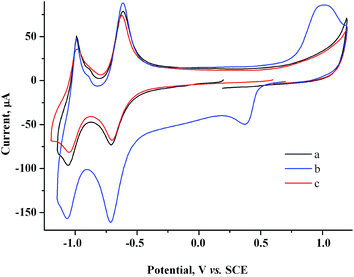
Addition of 1 g l−1 SiO2–NHR nanoparticles to the solution nearly does not affect the morphology of the CV curve for the 2.0 mM MV2+ + 1.5 mM AuCl system (Fig. 10b).Presumably, SiO2–NHR nanoparticles do not interfere with heterogeneous and mediated reduction of Au(I) and can participate only at the stage of binding and stabilization of gold nanoparticles. Therefore, without additional CV studies, we performed a preparative reduction of a solution (20 ml) containing 2 mM MV2+, 1.5 mM AuCl and 1 g l−1 SiO2–NHR at a controlled potential of −0.9 V on a GC electrode. The current decreases during the electrolysis (9.9 min) but remains rather high (I ≈ 11 → 5.3 mA). The amount of electricity is Q = 1.3 F with respect to AuCl. The starting slightly turbid pale-yellow solution remains turbid during the electrolysis but gets darker to become black-brown at Q = 1.2 F (Fig. S2 in the ESI†). During subsequent reduction to Q = 1.3 F, the solution acquires a blue color of methylviologen radical cations that slowly disappears with time, which indicates that exhaustive mediated reduction of Au(I) occurs and a small excess of electricity is passed. Apparently, Q = 1.2 F is again sufficient for the quantitative reduction of Au(I) in this case.
Measurement of the electrode mass before and after the electrolysis show that nothing is deposited on the electrode during the electrolysis. After the electrolysis, the CV does not show any reduction peaks of Au(I) or oxidation peaks of gold nanoparticles (Au0)n but only contains methylviologen reduction and reoxidation peaks with initial intensity (Fig. 10a and c). It follows from SEM micrographs (Fig. 11A and B) for the nanoparticles isolated that electrolysis mostly gives a nanocomposite material: spherical silicate nanoparticles (120–160 nm in diameter) with inclusions of spherical gold nanoparticles (≤20 nm). Under the conditions and with the electrolysis mode used, metal nanoparticles of various sizes are formed and they are unevenly distributed over silicate nanoparticles. The STEM image (Fig. 11C and D) distinctly shows the characteristic rim containing the modifying alkylamine layer. It is this layer where binding and stabilization of gold nanoparticles occur, apparently with involvement of amino groups and hydrophobic alkyl moieties liable to complexation. There is a strong confirmation from XRPD results (Fig. 9, curve b) that the AuNp also consist of crystalline gold as in the absence of a stabilizer. The calculations show that its dimensions lie in the same range of values.
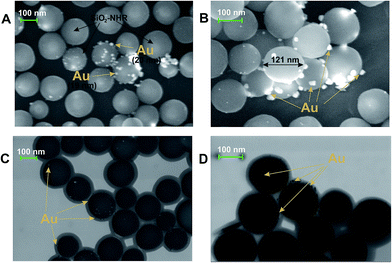 | ||
| Fig. 11 A SEM (A, B) and STEM (C, D) images of SiO2–NHR nanoparticles with gold nanoparticles electrodeposited on their surface. | ||
3.3 Electrosynthesis of AuNp in H2O/0.1 M NaCl medium in the presence of polyvinylpyrrolidone
We took polyvinylpyrrolidone (PVP) with a molecular mass of 40![[thin space (1/6-em)]](https://www.rsc.org/images/entities/char_2009.gif) 000 D as another stabilizer of gold nanoparticles as it is widely used for this purpose. On addition of PVP (75 mM per monomeric unit) to 1.5 mM AuCl solution and to a 1.5 mM AuCl + 2.0 mM MV2+ solution, the morphology of CV curves is retained, but the heights of both Au(I) reduction peak and Audep reoxidation peak decrease (Fig. 12a, S3 in the ESI†). On the other hand, PVP does not affect the CV curves of methylviologen (Fig. S4 in the ESI†). Apparently, Au(I) is efficiently bound by polyvinylpyrrolidone, which decreases its diffusion coefficient and hence decreases its diffusion reduction current peak. Accordingly, the amounts of Augen and Audep decrease.
000 D as another stabilizer of gold nanoparticles as it is widely used for this purpose. On addition of PVP (75 mM per monomeric unit) to 1.5 mM AuCl solution and to a 1.5 mM AuCl + 2.0 mM MV2+ solution, the morphology of CV curves is retained, but the heights of both Au(I) reduction peak and Audep reoxidation peak decrease (Fig. 12a, S3 in the ESI†). On the other hand, PVP does not affect the CV curves of methylviologen (Fig. S4 in the ESI†). Apparently, Au(I) is efficiently bound by polyvinylpyrrolidone, which decreases its diffusion coefficient and hence decreases its diffusion reduction current peak. Accordingly, the amounts of Augen and Audep decrease.
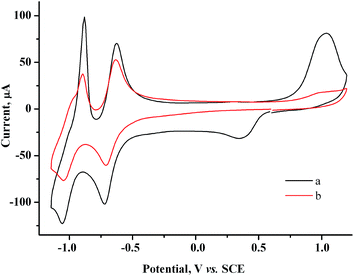 | ||
| Fig. 12 CV curves for the 1.5 mM AuCl + 2.0 mM MV2+ + 75 mM PVP system before (a) and after (b) reduction at −0.90 V (Q = 1.1 F with respect to AuCl). GC, H2O/0.1 M NaCl, ν = 100 mV s−1. | ||
Preparative reduction of a solution (10 ml) containing 2.0 mM MV2+, 1.5 mM AuCl, and 75 mM PVP was carried out on a GC electrode at a controlled potential of −0.9 V, Q = 1.1 F with respect to AuCl. During electrolysis (14.2 min), the current decreased (I ≈ 2.5 → 2.0 mA), the solution remained homogeneous, and its color changed from yellow through pink to purple. It turned purple-crimson after exposure to air (Fig. S5 in the ESI†). In the presence of PVP no noticeable reduction of the supporting solution occurs at −0.9 V (Fig. 12); electricity is consumed only for reduction of MV2+ to the MV˙+ radical cation, and ultimately for mediated reduction of Au(I). And, since an excessive amount of electricity was passed (110%), some amount of MV˙+ radical cations accumulated in the solution. It is the combination of their blue color with the purple-crimson color of gold nanoparticles that gives the purple color of the solution. The MV˙+ radical cations are oxidized with oxygen, therefore the solution changes color on exposure to air.
Nothing is deposited on the electrode during the electrolysis. In the UV-vis spectrum of the solution after electrolysis, a broad band typical of gold nanoparticles6 is recorded at 523 nm (Fig. 13). The CV curves contain no AuCl reduction peak but do contain peaks of methylviologen reduction with a lower intensity (by 30%) and an oxidation peak of gold nanoparticles (Fig. 12b).
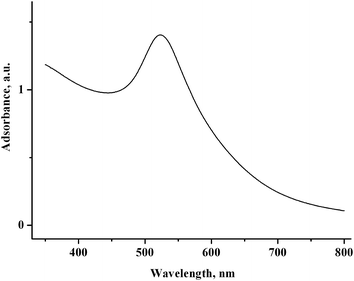 | ||
| Fig. 13 UV-vis spectrum of the solution containing 2.0 mM MV2+, 1.5 mM AuCl, and 75 mM PVP in H2O/0.1 M NaCl after reduction at −0.90 V (Q = 1.1 F with respect to AuCl). | ||
According to SEM (Fig. 14A) and STEM data (Fig. 14B), the isolated gold nanoparticles stabilized by PVP are spheres with sizes ranging within 5–14 nm. Elementary analysis (Fig. S6 in the ESI†) confirms that they contain gold, and XRPD data (Fig. 9, curve c) indicates that this particles are gold crystallites with dimensions of 8–18 nm.
It is interesting that, according to DLS data, the mean hydrodynamic radius of particles in the solution obtained after the electrolysis is much larger and amounts to 67 nm by number, and 193 and 5472 nm by intensity (the polydispersity index PdI is 0.290) (Fig. S7 in the ESI†). Presumably, this means that, while stabilization of gold nanoparticles in a PVP capsule hinders the agglomeration and enlargement of metal nanoparticles, it does not prevent aggregation of nanocomposites themselves (the metal in a capsule).
4 Conclusions
In continuation of the previously started studies on mediated electrosynthesis of metal nanoparticles in solution bulk,31–39 we were the first to perform an electrosynthesis of gold nanoparticles (AuNp) by methylviologen mediated reduction of Au(I) at potentials of the MV2+/MV˙+ redox couple in H2O/0.1 M NaCl medium. Upon direct reduction on a glassy carbon electrode, the metallic gold that is formed is deposited on the electrode, both in the absence and in the presence of the mediator. In the mediated process, no noticeable amount of the metal is deposited on the cathode and the entire Au(I) amount is quantitatively converted to AuNp in the solution bulk. This process requires Q = 1.0–1.2 F, depending on the conditions. In the absence of a stabilizer, the resulting AuNp (14–100 nm) undergo aggregation and form a deposit. The aggregates are reversibly destructed into nanoparticles upon sonication. In the presence of spherical water-soluble alkylamino-modified silicate nanoparticles (SiO2–NHR, 120–160 nm), a nanocomposite material is formed, in which spherical AuNp (≤20 am) are bound in the alkylamine SiO2–NHR surface layer. Polyvinylpyrrolidone (40![[thin space (1/6-em)]](https://www.rsc.org/images/entities/char_2009.gif) 000 D) stabilizes spherical AuNp with a mean diameter of 5–14 nm. All the AuNp were characterized by X-ray powder diffraction, scanning and transmission electron microscopy.
000 D) stabilizes spherical AuNp with a mean diameter of 5–14 nm. All the AuNp were characterized by X-ray powder diffraction, scanning and transmission electron microscopy.
Acknowledgements
The authors would like to acknowledge the financial support from RSF (grant no. 14-23-00016).References
- A. D. Pomogailo, A. S. Rozenberg and I. E. Uflyand, Metal nanoparticles in polymers, Khimia, Moscow, 2000 Search PubMed.
- V. I. Roldughin, Russ. Chem. Rev., 2000, 69, 821 CrossRef CAS.
- M.-C. Daniel and D. Astruc, Chem. Rev., 2004, 104, 293 CrossRef CAS.
- I. P. Suzdalev, Nanotechnology: physicochemistry of nanoclusters, nanostructures and nanomaterials, Librokom, Moscow, 2009 Search PubMed.
- V. V. Volkov, T. A. Kravchenko and V. I. Roldughin, Russ. Chem. Rev., 2013, 82, 465 CrossRef.
- L. A. Dykman, V. A. Bogatyrev, S. Y. Shchyogolev and N. G. Khlebtsov, Gold nanoparticles. Synthesis, properties and biomedical applications, Nauka, Moscow, 2008 Search PubMed.
- B. I. Kharisov, O. V. Kharissova and U. Ortiz-Mendez, Handbook of less-common nanostructures, CRC Press, Taylor & Francis Group, Boca Raton, 2012 Search PubMed.
- H. B. Weiser, Inorganic colloid chemistry, Wiley, New York, 1933 Search PubMed.
- L. A. Dykman and V. A. Bogatyrev, Russ. Chem. Rev., 2007, 76, 181 CrossRef CAS.
- M. Faraday, Philos. Trans. R. Soc. London, 1857, 147, 145 CrossRef.
- R. Zsigmondy, Ann. Chem., 1898, 301, 29 CrossRef CAS.
- A. M. Sukhotin, Reference Book of Electrochemistry, Khimia, Leningrad, 1981 Search PubMed.
- L. Komsiyska and G. Staikov, Electrochim. Acta, 2008, 54, 168 CrossRef CAS.
- O. A. Petrii, Russ. Chem. Rev., 2015, 84, 159 CrossRef CAS.
- Y.-Y. Yu, S.-S. Chang, C.-L. Lee and C. R. C. Wang, J. Phys. Chem. B, 1997, 101, 6661 CrossRef CAS.
- M. B. Mohamed, Z. L. Wang and M. A. El-Sayed, J. Phys. Chem. A, 1999, 103, 10255 CrossRef CAS.
- L. Rodrigues-Sanchez, M. L. Blanko and M. A. Lopez-Quintela, J. Phys. Chem., 2000, 104, 9683 CrossRef.
- B. Yin, H. Ma, S. Wang and S. Chen, J. Phys. Chem. B, 2003, 107, 8898 CrossRef CAS.
- V. Saez and T. J. Mason, Molecules, 2009, 14, 4284 CrossRef CAS PubMed.
- J. Zhu, S. Liu, O. Palchik, Y. Koltypin and A. Gedanken, Langmuir, 2000, 16, 6396 CrossRef CAS.
- J. Reisse, T. Caulier, C. Deckerkheer, O. Fabre, J. Vandercammen, J. L. Delplancke and R. Winand, Ultrason. Sonochem., 1996, 3, 147 CrossRef.
- M. T. Reetz and W. Helbig, J. Am. Chem. Soc., 1994, 116, 7401 CrossRef CAS.
- J. A. Becker, R. Schäfer, R. Festag, W. Ruland, J. H. Wendorff, J. Pebler, S. A. Quaiser, W. Helbig and M. T. Reetz, J. Chem. Phys., 1995, 103, 2520 CrossRef CAS.
- M. T. Reetz, S. A. Quaiser and C. Merk, Chem. Ber., 1996, 129, 741 CrossRef CAS.
- N. Vilar-Vidal, M. C. Blanco, M. A. López-Quintela, J. Rivas and C. Serra, J. Phys. Chem. C, 2010, 114, 15924 CAS.
- R. D. Rieke, Acc. Chem. Res., 1977, 10, 301 CrossRef CAS.
- R. D. Rieke, Crit. Rev. Surf. Chem., 1991, 1, 131 CAS.
- A. Fürstner, Active metals: preparation, characterization, applications, John Wiley & Sons, New York, 2008 Search PubMed.
- D. Leslie-Pelecky, M. Bonder, T. Martin, E. M. Kirkpatrick, X. Q. Zhang, S.-H. Kim and R. D. Reike, IEEE Trans. Magn., 1998, 34, 1018 CrossRef CAS.
- V. V. Yanilkin, N. I. Maksimyuk and E. I. Strunskaya, Russ. J. Electrochem., 1996, 32, 130 Search PubMed.
- V. V. Yanilkin, G. R. Nasybullina, A. Y. Ziganshina, I. R. Nizamiev, M. K. Kadirov, D. E. Korshin and A. I. Konovalov, Mendeleev Commun., 2014, 24, 108 CrossRef CAS.
- V. V. Yanilkin, G. R. Nasybullina, E. D. Sultanova, A. Y. Ziganshina and A. I. Konovalov, Russ. Chem. Bull., 2014, 63, 1409 CrossRef CAS.
- V. V. Yanilkin, N. V. Nastapova, G. R. Nasretdinova, R. K. Mukhitova, A. Y. Ziganshina, I. R. Nizameev and M. K. Kadirov, Russ. J. Electrochem., 2015, 51, 951 CrossRef CAS.
- G. R. Nasretdinova, R. R. Fazleeva, R. K. Mukhitova, I. R. Nizameev, M. K. Kadirov, A. Y. Ziganshina and V. V. Yanilkin, Electrochem. Commun., 2015, 50, 69 CrossRef CAS.
- G. R. Nasretdinova, R. R. Fazleeva, R. K. Mukhitova, I. R. Nizameev, M. K. Kadirov, A. Y. Ziganshina and V. V. Yanilkin, Russ. J. Electrochem., 2015, 51, 1029 CrossRef CAS.
- S. Fedorenko, M. Jilkin, N. Nastapova, V. Yanilkin, O. Bochkova, V. Buriliov, I. Nizameev, G. Nasretdinova, M. Kadirov, A. Mustafina and Y. Budnikova, Colloids Surf., A, 2015, 486, 185 CrossRef CAS.
- V. V. Yanilkin, N. V. Nastapova, E. D. Sultanova, G. R. Nasretdinova, R. K. Mukhitova, A. Y. Ziganshina, I. R. Nizameev and M. K. Kadirov, Izv. AN, ser chim., 2016, 1, 125 Search PubMed.
- V. V. Yanilkin, N. V. Nastapova, G. R. Nasretdinova, R. R. Fazleeva, A. V. Toropchina and Y. N. Osin, Electrochem. Commun., 2015, 59, 60 CrossRef CAS.
- V. V. Yanilkin, G. R. Nasretdinova, Y. N. Osin and V. V. Salnikov, Electrochim. Acta, 2015, 168, 82 CrossRef.
- DIFFRAC Plus Evaluation package EVA, Version 11, User's Manual, Bruker AXS, Karlsruhe, Germany, 2005 Search PubMed.
- TOPAS V3: General profile and structure analysis software for powder diffraction data. Technical Reference, Bruker AXS, Karlsruhe, Germany, 2005 Search PubMed.
- E. Weitz, Angew. Chem., 1954, 66, 658 CrossRef CAS.
Footnote |
| † Electronic supplementary information (ESI) available. See DOI: 10.1039/c5ra21328b |
| This journal is © The Royal Society of Chemistry 2016 |


