Controllable synthesis of Ag@TiO2 heterostructures with enhanced photocatalytic activities under UV and visible excitation†
Fanli Zhanga,
Zhiqiang Cheng*ab,
Liying Cuia,
Tingting Duana,
Ahmed Anana,
Chunfeng Zhangc and
Lijuan Kang*a
aCollege of Resources and Environment, Jilin Agriculture University, Changchun 130118, People's Republic of China. E-mail: czq5974@163.com; kanglijuan61@126.com
bSchool of Aerospace Engineering, Tsinghua University, Beijing, 100000, China
cState grid jilin electric power compnay limited electric power research institute, China
First published on 1st December 2015
Abstract
The heterostructure of Ag doped-TiO2 has been fabricated through the facile synthesis of electrospinning technique and hydrothermal reaction. During the hydrothermal process, the concentrations of reactants play a significant role in controlling the size and load of Ag NPs on the surface of the TiO2 fibers. After that, the nanoheterostructures of Ag@TiO2 were characterized by Scanning Electron Microscopy (SEM), High Resolution Transmission Electron Microscopy (HRTEM), X-ray Diffraction (XRD) and X-ray photoelectron spectroscopy (XPS). Simultaneously, diffuse reflectance was used to investigate the visible light adsorption ability. Surface modification by Ag rendered visible light-induced photocatalytic activity to the TiO2 fibers. Rhodamine B (RhB) was employed as a representative dye pollutant to evaluate the photocatalytic activity of the Ag/TiO2 samples. The results indicated that the heterojunction structure of Ag/TiO2 exhibited higher degradation efficiency than the pure TiO2 fibers. Furthermore, we also investigated the photocatalytic performance under visible-light, which exhibited a significant increase in degradation efficiency. Additionally, the proposed mechanism for the enhanced photocatalytic activity of TiO2 fibers by deposited-Ag particles was proposed.
Introduction
As a versatile material, TiO2 has been used in various fields, such as solar cells,1,2 sensor,3,4 cosmetic,5 ceramic,6 especially in photocatalysts.7,8 In the past decades, TiO2 has attracted significant attention because of its superiority in tackling toxic and hazardous organic pollutants of contaminated air and water9 owing to the high chemical stability, thermal stability, non-toxicity, super hydrophilicity and low-cost. However, although it is a good catalyst, the recombination of photogenerated electron–holes will influence the photocatalytic efficiency greatly, which would directly lead to low quantum yields.10 Therefore, efficient charge separation is necessary for enhancing the performance in photocatalysis. In order to resolve this problem, various strategies have been applied to improve charge separation efficiency by preparing various kinds of nanostructures,11 such as nanosheets,12 nanobelts13 and nano-hollow spheres,14 which could improve the conductive property of the materials greatly. Comparing to the nanoparticles of TiO2, the one, two or three dimensional nanostructured materials of TiO2-based may facilitate charge transportation and promote charge separation for the better charge mobility and reducing the rate of recombination of electron–holes. Meanwhile, the other drawback of TiO2 photocatalyst in practical application is the lack of visible light utilization for large band gap in TiO2 (3.2 eV in anatase phase,15 3.0 eV in rutile phase16), which correspond to the excitation light sources about 387.5 nm in wavelength (3–4% of the total solar spectrum17). Until now, many investigations have been made to enhance the photocatalytic efficiency by extending the absorption for light to visible region, such as bandgap engineering18–21 and surface sensitization.22–24 The bandgap engineering tends to narrow the bandgap of TiO2 and make it absorb visible light via doping other elements or forming TiO2-based semiconductor heterojunction. Surface sensitization refers to the application of other visible light active materials as light harvester to sensitize TiO2 surface, such as dye sensitization, transition-metal complex dye-sensitized and organic dye-sensitized TiO2. It is worth noting that the heterostructures of TiO2-based heterojunction, doping noble metals (such as Pt, Pd, Au and Ag),25 could enhance photocatalytic efficiency effectively. Among these noble metals, silver is the most suitable to industrial application for its high efficiency, low cost, corrosion resistance during the process of preparation and use. The nanoparticles of Ag on surface of TiO2 photocatalyst can serve as an electron scavenging center to separate electron–holes pairs since its Fermi level is below the conduction band of TiO2. Furthermore, the Schottky barrier could also play great role in decreasing the ratio of recombination of photogenerated electrons and holes.26In this paper, we introduced a facile approach based on our previous research.27 Briefly, we resorted to three steps for the preparation of silver particles adhering on the surface of TiO2 fibers, which included electrospun, photo-reduction and hydrothermal method. However, the Ag particles' aggregation occurred, and the size of certain particles was more than 100 nm, which would affect the property of photocatalyst. Therefore, in order to obtain the uniform size of Ag particles, we ameliorated the synthetic procedure in hydrothermal reaction. In this regard, herein we added polyvinyl alcohol (PVA) in the hydrothermal solutions in the mass ratio of 3![[thin space (1/6-em)]](https://www.rsc.org/images/entities/char_2009.gif) :
:![[thin space (1/6-em)]](https://www.rsc.org/images/entities/char_2009.gif) 1 with silver ions, which play the role of protective agents avoiding the aggregation of silver particles. To the best of our knowledge, the present work offers a relatively mild, environmentally benign approach for the preparation of metal or metal oxide particles, which possess potential practical value for the research works in the future.
1 with silver ions, which play the role of protective agents avoiding the aggregation of silver particles. To the best of our knowledge, the present work offers a relatively mild, environmentally benign approach for the preparation of metal or metal oxide particles, which possess potential practical value for the research works in the future.
Experimental section
Material and methods
Tetrabutyl titanate (Ti(OBu)4, 97%) and polyvinylpyrrolidone (PVP, Mw ∼ 1![[thin space (1/6-em)]](https://www.rsc.org/images/entities/char_2009.gif) 300
300![[thin space (1/6-em)]](https://www.rsc.org/images/entities/char_2009.gif) 000) were supplied by Sigma Aldrich. Methyl alcohol (99.5% in purity), acetic acid and hexamine (HMTA) were obtained from Beijing chemical works. Polyvinyl alcohol 1799 (PVA, alcoholysis: 99.8–100%) was purchased from Aladdin. We bought the silver nitrate (AgNO3) from Sinopharm chemical reagent co. Ltd. Deionized water was used in the whole experiments and all chemicals were analytical grade without further purification.
000) were supplied by Sigma Aldrich. Methyl alcohol (99.5% in purity), acetic acid and hexamine (HMTA) were obtained from Beijing chemical works. Polyvinyl alcohol 1799 (PVA, alcoholysis: 99.8–100%) was purchased from Aladdin. We bought the silver nitrate (AgNO3) from Sinopharm chemical reagent co. Ltd. Deionized water was used in the whole experiments and all chemicals were analytical grade without further purification.
TiO2 nanofibers were fabricated by electrospinning technique. Firstly, 1.40 g PVP was dissolved in the mixed solution containing 23 mL methyl alcohol and 0.3 mL acetic acid, which was stirred vigorously to attain the homogenous solution under the ambient temperature. After that, 5 mL tetrabutyl titanate was added dropwise to the mixed solution, followed by magnetic stirring for another 4 h. Then, the precursor of spinning liquid was transferred to the plastic syringe and the feeding rate was controlled at 1.0 mL h−1 by peristaltic pump. The direct current voltage applied to the needle of the syringe was 12 kV and the distance from the needle tip to collector was 13–15 cm with the humidity below 40% in air. Finally, the electrospun composite nanofibers of PVP/TiO2 were calcined in the air at 520 °C for 6 hours to form pure TiO2 fibers with rate of 2 °C min−1.
As for the preparation of nanoheterostructures of Ag nanoparticles adhering on the surface of TiO2 fibers, we resorted to hydrothermal method under mild conditions. At first, 20 mg TiO2 fibers were put into a 30 mL reaction kettle which contained specific concentrations of AgNO3, PVA and HMTA. The Ag+ concentration was 1 mM, 0.01 M and 0.05 M respectively, and which corresponds to the concentration of HMTA was 2 mM, 0.02 M and 0.1 M. During the heating process, HMTA played a dual role, acting not only reducing agent but also as the source of alkali. Afterwards, the solutions were shifted to the reaction autoclave and heated at 90 °C for 4 hours. Then, the samples was collected and washed by deionized water.
Characterization and measurements
The composite PVP/TiO2 nanofibers were subjected to thermogravimetry differential thermal analysis (TG-DTA, HCT-3). The morphologies of AgNPs/TiO2 nanoheterostructures were observed by scanning electron microscopy (SEM, SHIMADZU X-550) and transmission electron microscopy (TEM, Tecnai G2). X-ray diffraction (XRD) patterns were measured by a D/MAX 2250 V diffractometer (Rigaku, Japan), using Cu Kα (λ = 0.15418 nm) radiation under 40 kV, 30 mA and the scanning range from 20° to 80°. X-ray photoelectron spectroscopy (XPS) was performed on a VG ESCALAB LKII instrument with Mg-Kα-ADES (hv = 1253.6 eV) source at a residual gas pressure of below 1028 Pa. UV-vis spectra were recorded on a UV-vis spectrophotometer (UV-2550, Shimadzu) with a scanning range from 200 to 800 nm, and Al2O3 was used as a reflectance standard. UV-vis absorption spectra were recorded using a UV-vis spectrophotometer (Hitachi U-3010).Photocatalytic degradation test for RhB
The photocatalytic tests of samples under the ultraviolet light and visible light were evaluated by the degradation of RhB. The photoreactor was an ordinary glass of 250 mL equipped with circulating water at room temperature. The glass reactor was illuminated by a wideband lamp bulb (125 W Philips TL/05) with a predominant wavelength of 365 nm. The visible light was generated by an internal 150 W high-pressure xenon lamp equipped with UV cut-off glass filter transmitting λ > 400 nm. The vertical distance between the glass reactor and the lamp was 15 cm, and then 100 mL (10 mg L−1) RhB solution was mixed with 0.10 g sample. Prior to irradiation, the mixed solution was stirred in the darkness for 60 min to ensure the establishment of adsorption–desorption equilibrium between the RhB dye and the photocatalyst surface. An aliquot (3 mL) of the solution was taken at 10 or 20 minutes intervals during the experiment and tested using a UV-vis spectrophotometer (Hitachi U-3010), and after that the analyzed aliquot would be poured back into the glass reactor immediately to ensure a roughly equivalent volume of solution. The photocatalytic experiment lasted for one hour under UV light, and two hours with visible light.Results and discussion
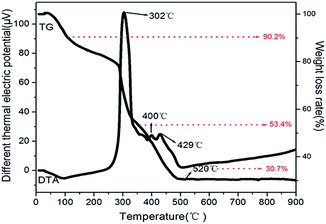
The PVP/TiO2 composited fibers were analyzed by the thermosgravimetry-differential thermal analysis (TG-DTA) and the results were shown in the Fig. 1. The whole process of thermal decomposition for the composite fibers is divided into three stages. The first weight loss stage occurred between 80 °C and 120 °C, which indicated the loss of about 10% moisture from the composite fibers surface and residual moisture in the internal fibers. The second part ranged from 185 °C to 380 °C represented the decomposition of the organic components of PVP and part of organics generated by the hydrolysis of butyl titanate. Additionally, the third part is from 380 °C to 500 °C, which mainly includes the two process of transformation of amorphous TiO2 to anatase phase and the degradation for main chain of PVP.29 As we can see from the TG curve in Fig. 1, there is no obvious loss in the weight after 520 °C for the complete combustion of organic matters.The procedure for the synthesis is explicit. The appropriate concentration of polyvinyl alcohol (PVA) played important role in controlling the size of Ag particles.28 With the temperature increasing, the HMTA would decompose into ammonia and formaldehyde gradually.30 Then, these resultants would react with Ag+ of AgNO3 (formula (2)–(4)) to form silver particles. Because of the good water solubility and chemical stability, the dissolved PVA relied on electrostatic stabilization by forming an electrical double layer around silver particles to prevent silver particles' aggregation. The double layer would absorb negatively charged species on the surface of silver particles.31,32 In principle, the high concentration of PVA in the solution will lose the control for the size of particles, because the steric stabilization and the role of electrical double layer would disappear and lead to the reduction of resistance for the growth of silver particles. During the process of hydrothermal reaction, the OH− of water would react with the TiO2 and form the hydroxyl groups on the surface of TiO2 fiber via the interaction hydrogen-bond (formula (1)). Then, the –OH of branched chain of PVA would connect with surface hydroxyl groups and oxygen of TiO2 nanofibers, following the formula (5). The silver nanoparticles would deposit the surface of TiO2 fibers rationally. Academically, the surface energy of large particles in nanometer is lower than small particles, therefore, the small particles would be inclined to large ones with the reaction continued through Ostwald ripening process.33 The proposed process of Ag growth on the surface of TiO2 was illustrated in Scheme 1.
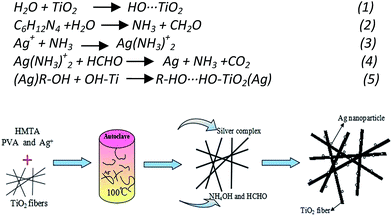 | ||
| Scheme 1 The proposed schematic synthesis process to form Ag/TiO2 nanoheterostructures by the solvothermal reducing reaction in HMTA solvent. | ||
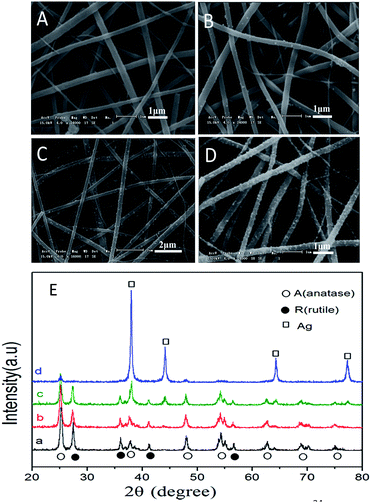
The morphologies of nanoheterostructures Ag/TiO2 and pure TiO2 fibers were observed by the SEM and TEM. The Fig. 2A depicts a typical microscopy of pure TiO2 nanofibers and Fig. 2B–D reveal the images of Ag/TiO2 obtained by solvothermal reducing reaction in HMTA solvent for different concentrations of Ag+ and HMTA. As shown in ESI (Fig. S1, ESI†), the surface of the pure TiO2 fibers is relatively smooth before the Ag adhering on it. Simultaneously, the porosity between the fibers of the pure TiO2 made it possible for the uniform growth of silver nanoparticles. Comparing to the three different concentrations of reactants from the images of Ag/TiO2, the size of the AgNPs has no obvious change, except for the load of silver particles. It is worth noting that the AgNPs adhered on the surface tightly, and it would not fall off from the TiO2 fibers after repeated usage in the photocatalytic test. The composition of the nanostructure for Ag/TiO2 fibers was measured by energy-dispersive X-ray spectroscopy (EDX) as shown in the Fig. S2 (ESI†). The energy dispersive X-ray (EDX) spectrometry mapping indicates the presence of Ti, O in TiO2 fibers, which proof that the composite PVP/TiO2 fibers were burned completely. Moreover, the results were in good agreement with the results of XRD and XPS in the confirmation of the containing elements.
The Fig. 2E shows the XRD patterns of pure TiO2 fibers and as-prepared Ag/TiO2 samples. Contrast to the previous work, the phase of pure TiO2 fibers has some change because of prolonging the time of constant temperature heating at 520 °C, which leads to the amount of anatase transforming to rutile phase. Therefore, there are some typical diffraction peaks of rutile in the XRD patterns, which could be indexed to JPCDS # 65-1119. As shown in the Fig. 2E, the intensity of diffraction peaks of TiO2 decreased with the increasing density of hierarchical AgNPs on the surface.34 Therefore, there are barely noticeable diffraction peaks of TiO2 in the curve d.
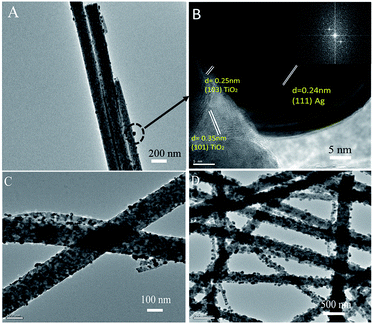
As shown in the Fig. 3, there is a large quantity of silver particles deposited on the surface of TiO2 nanofiber. The TEM images of Ag/TiO2 were provided in Fig. 3C and D. Further, most of silver particles are in nanoscale and the size of Ag is mainly distributed from 10 to 50 nm. The Fig. 3B is the HRTEM selected from part of Ag/TiO2 fiber. The lattice fringe of TiO2, d = 0.35 nm and d = 0.25 nm correspond to (101) and (103) crystallographic plane of the anatase crystal structure, respectively. As such, the lattice fringe d = 0.24 nm matches the (111) plane of the Ag in face-centered cubic phase. The results could be verified by the results of XRD patterns. The Fig. 3B clarifies that the border of silver with surface of TiO2 fiber is indistinct, which indicates that composition fusion may occur between the interface of Ag and TiO2 fiber surface. Briefly, the Ag/TiO2 nanoheterostructures have highly crystalline structures confirmed by XRD patterns and HRTEM analysis, which is essential for good photocatalytic materials.
The UV-vis absorption spectra for samples are depicted in Fig. 4. Compared to the pure TiO2 fibers, the adsorption spectrum of the as-prepared Ag/TiO2 samples had a broad absorption covering the range of 380–500 nm, which should be attributed to the surface plasma resonance effect of silver. With the increase load of Ag, the absorbance in visible region increased, which might contribute to the enhanced photoactivities under visible light.35,36 Furthermore, the small amount of rutile mixed with the anatase TiO2 fiber, which might lead to the red-shift of the TiO2 absorbance via changing the Fermi level of TiO2 fiber.37 According to the equation Eg = 1239.6/λg, the calculated band gap energies for pure TiO2 and AgNPs/TiO2 were 3.00 eV and 2.95 eV, respectively.38 Additionally, the lower energy levels could also be produced by dispersion of silver particles in the band gap of TiO2. The position of Ti3+ is near the TiO2 valence band, which is regarded as the defect energy levels for enhancing the high degradation efficiency under visible light.39
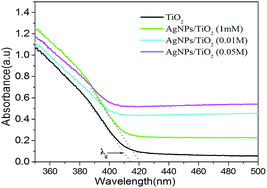 | ||
| Fig. 4 UV-visible diffuse reflectance spectra of the TiO2 and Ag/TiO2 samples in the range of 350–500 nm. | ||
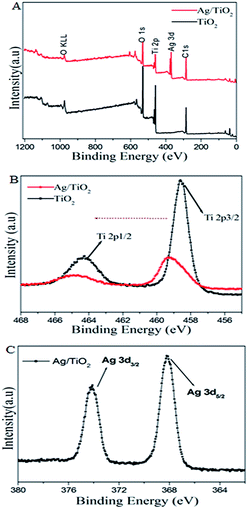
To clarify the chemical state of Ti, Ag, and O in the samples, X-ray photoelectron spectroscopy (XPS) was introduced. As shown in Fig. 5, the Ti, O, C, and Ag elements were shown in the fully scanned spectra (Fig. 5A) of pure TiO2 and Ag/TiO2 fibers respectively. Meanwhile, in the EDS of TiO2 fiber, there is no element of C, which can be ascribed to the adventitious carbon-based contaminant in the results of XPS spectra. The high resolution XPS spectra of Ti 2p and Ag 3d were exhibited in the Fig. 5B and C. The Ti 2p spectra shows the peaks at 458.6 eV and 464.9 eV, which are corresponding to Ti 2p3/2 and Ti 2p1/2 respectively. However, comparing to the pure TiO2 of Ti 2p, the Ti 2p binding energy of Ag/TiO2 heterostructure is increased for the lower Fermi level of Ag than that of TiO2 fiber. Therefore, the electrons of TiO2 surface would transfer to the silver particles, which lead to reducing the electron cloud density of Ti ions.34 The Fig. 5C provided the high resolution XPS spectra of Ag0 3d for Ag/TiO2 samples. It included two peaks of Ag 3d5/2 and Ag 3d3/2, and there was no peaks corresponding to Ag+, which confirmed the presence of metallic silver deposits on the TiO2 fibers.
Photocatalytic activity for degradation RhB
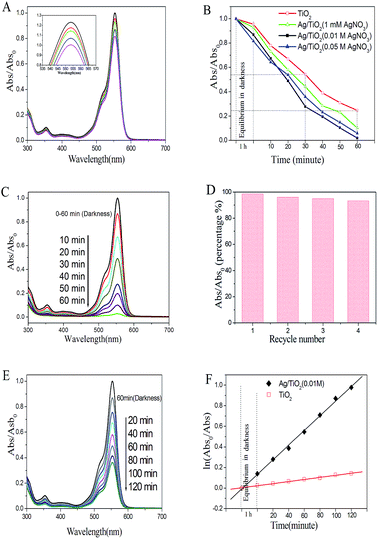
In order to investigate the photocatalytic property of samples, RhB was used as the degradation target under UV and visible light irradiation, which is the poorly biodegradable and main contaminant in wastewater.Photocatalytic performances of pure-TiO2 films and Ag/TiO2 heterostructures obtained through hydrothermal process were evaluated by measuring the degradation efficiency of RhB aqueous solution under UV and visible light irradiation. As shown in the Fig. 6, it shows that the degradation efficiency for RhB with silver doped TiO2 nanofiber as catalyst was higher than that of pure TiO2 fiber. From the Fig. 6C, it can be seen that the absorption spectra of RhB at 554 nm decreased rapidly under UV irradiation. The RhB decolorization rate by pure TiO2 fibers after 60 min UV light irradiation was just about 75.61%, which is lower than any one of samples deposited with silver particles. Meanwhile, the degradation rate for RhB reached to 98.15%, which was prepared by the 0.01 M AgNO3 (Fig. 6C). However, with increasing the molar ratio of AgNO3 in the hydrothermal process, the photocatalytic performance of products decreased under UV-light illumination. There are some reasons which can explain the case of slight reduction for degradation efficiency. The high density of Ag particles adhering on the surface of TiO2 may block the ultraviolet absorption in some certain degree, which would occupy the active sites of TiO2 fibers and lead to reducing the photocatalytic performance of TiO2 fibers.40 In other cases, the high density of Ag nanoparticles might be the recombination centers of electrons and holes; the photogenerated electrons on the surface of Ag particles would attract holes and recombine together.41 In addition, we also investigated the photocatalytic stability of Ag/TiO2 heterostructure. The results indicated that the Ag/TiO2 fibers exhibited good stability after being reused for four times (Fig. 6D) and the degradation efficiency could reach to 91.2%. The enhanced photocatalytic performance of the heterostructure can be explained by the assuming probable schematic diagram (Scheme 2). When the Ag/TiO2 fibers are irradiated by UV-light illumination, the photo-generated electrons in the valence band of TiO2 would transfer to the conduction band.42,43 Then, the appropriate amount of Ag nanoparticles adhering on the surface of TiO2 fibers would capture the electrons,44 therefore, it is beneficial for the separation of photogenerated electrons and holes. The electrons captured by Ag particles would transfer to the adsorbed O2 to generate radical species, such as ˙OH. Simultaneously, the holes on the surface of TiO2 would react with OH− and produce reactive oxygen radicals. Subsequently, the RhB would be degraded or mineralized by these oxygen radicals. Furthermore, the Ag/TiO2 (0.01 M) fibers as catalyst showed higher efficiency than that of pure TiO2 fibers for degradation of RhB under visible light for 2 hours (Fig. 6E). The degradation efficiency of Ag/TiO2 for RhB reached to 54.23%, whereas, the pure TiO2 fibers' degradation efficiency for RhB was just about 12.11%. The photocatalytic process of degradation for RhB can be referred as a Langmuir–Hinshelwood first-order kinetics reaction for the low concentration of substrate. Through statistical calculations, the kinetics could be expressed in the form: ln(Abs0/Abs) = kt (the degradation reaction rate constant (k) was 0.01882 and 0.00391 for the Ag/TiO2 and TiO2, respectively).
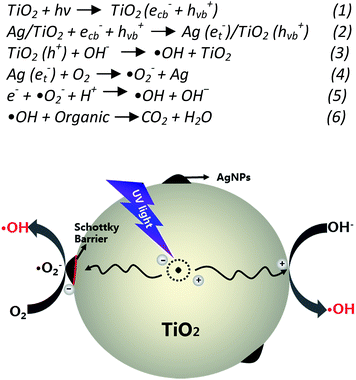 | ||
| Scheme 2 Proposed mechanism of photo-generated charge separation and migration process in the Ag/TiO2 nanoheterostructures under UV light. | ||
The significantly enhanced photodegradation of RhB in the presence of products under the visible light irradiation could be ascribed to the silver deposits. On the one hand, the Ag nanoparticles would be excited by visible light, which enhanced the surface electron excitation and electron–hole separation.45 On the other hand, the RhB adsorbed on the surface of fibers could be excited via self-photosensitization under visible light, and photo-generated electrons would be migrated to the conduction band of TiO2.46 These electrons would be captured by Ag nanoparticles, and react with oxygen molecules to produce the radical species such as O2− and ˙OH. Additionally, there is no obvious shift for the λ max in degradation curves for RhB under UV and visible light, which should be attributed to the process of photocatalytic degradation.47 With the opposed assistance provided by the repulsion between the cationic RhB molecule and positive charge on the TiO2 fibers surface, RhB would adsorb on the surface slightly by oxygen atoms in the carboxylate group. The holes (h+) on the surface of TiO2 fibers would react with H2O and produce the radical species (˙OH).48 However, it would not attack the diethylamino groups of RhB because of electrostatic repulsion. The process of photocatalytic degradation can be described as the elementary reactions formulas (eqn (1)–(6)). With the increase of ˙OH and O2−, it would diffuse into the bulk solution and attack the chromophoric structure, leading to the cycloreversion of RhB.
Conclusions
The Ag/TiO2 fibers were synthesized via the combination of electrospinning technology and solvothermal process, which provides a facile strategy for decorating TiO2 fibers with silver particles. Moreover, the photocatalytic test indicated that the resultant heterostructures exhibited an enhanced photocatalytic activity, and the photocatalytic activity of Ag/TiO2 photocatalysts depends on the load of Ag deposited on the surface of TiO2. In addition to, we have elucidated a corresponding possible mechanism for the photocatalytic performance of the Ag/TiO2 nanoheterostructures, which would be beneficial for further researches of expanding the absorption of TiO2 to visible light region.Acknowledgements
This work was financially supported by the Changchun Science and Technology project (14KG078) and the National Nature Science Foundation (Grant 51403076) and (52234214000D).References
- U. Bach, D. Lupo, P. Comte, J. E. Moser, F. Weissörtel, J. Salbeck and M. Grätzel, Nature, 1998, 395, 583 CrossRef CAS
.
- D. Chen, H. Zhang, Y. Liu and J. Li, Energy Environ. Sci., 2013, 6, 1362 CAS
.
- R. Lü, W. Zhou, K. Shi, Y. Yang, L. Wang, K. Pan, C. Tian, Z. Ren and H. Fu, Nanoscale, 2013, 5, 8569 RSC
.
- K. S. Mun, S. D. Alvarez, W. Y. Choi and M. J. Sailor, ACS Nano, 2010, 4, 2070 CrossRef CAS PubMed
.
- T. Picatonotto, D. Vione and M. Eugenia Carlotti, J. Dispersion Sci. Technol., 2002, 23, 845 CrossRef CAS
.
- C. A. Grimes, D. Kouzoudis, E. C. Dickey, D. Qian, M. A. Anderson, R. Shahidain and L. Green, J. Appl. Phys., 2000, 87, 5341 CrossRef CAS PubMed
.
- D. María Hernández-Alonso, F. Fresno, S. Suárez and J. M. Coronado, Energy Environ. Sci., 2009, 2, 1231 Search PubMed
.
- L. G. Devi and R. Kavitha, RSC Adv., 2014, 4, 28265 RSC
.
- U. I. Gaya and A. H. Abdullah, J. Photochem. Photobiol., C, 2008, 9, 1 CrossRef CAS
.
- W. Zhou, H. Liu, J. Wang, D. Liu, G. Du and J. Cui, ACS Appl. Mater. Interfaces, 2010, 2, 2385 CAS
.
- D. Wang, D. Choi, J. Li, Z. Yang, Z. Nie, R. Kou and J. Liu, ACS Nano, 2009, 3, 907 CrossRef CAS PubMed
.
- H. G. Yang, G. Liu, S. Z. Qiao, C. H. Sun, Y. G. Jin, S. C. Smith and G. Q. Lu, J. Am. Chem. Soc., 2009, 131, 4078 CrossRef CAS PubMed
.
- S. Das and W. M. A. Wan Daud, RSC Adv., 2014, 4, 20856 RSC
.
- L. Xu, D. Gao, J. Song, L. Shen, W. Chen, Y. Chen and S. Zhang, New J. Chem., 2015, 39, 5553 RSC
.
- K. M. Reddy, S. V. Manorama and A. R. Reddy, Mater. Chem. Phys., 2003, 78, 239 CrossRef
.
- T. Torimoto, N. Nakamura, S. Ikeda and B. Ohtani, Phys. Chem. Chem. Phys., 2002, 4, 5910 RSC
.
- S. T. Kochuveedu, D. P. Kim and D. H. Kim, J. Phys. Chem. C, 2012, 116, 2500 CAS
.
- M. A. Khan, M. S. Akhtar, S. I. Woo and O. B. Yang, Catal. Commun., 2008, 10, 1 CrossRef
.
- W. Fu, S. Ding, Y. Wang, L. Wu, D. Zhang, Z. Pan, R. Wang, Z. Zhang and S. Qiu, Dalton Trans., 2014, 43, 16160 RSC
.
- R. Dholam, N. Patel, M. Adami and A. Miotello, Int. J. Hydrogen Energy, 2009, 34, 5337 CrossRef CAS
.
- H. Xu, S. Ouyang, L. Liu, P. Reunchan, N. Umezawa and J. Ye, J. Mater. Chem. A, 2014, 2, 12642 CAS
.
- G. D. Sharma, D. Daphnomili, K. S. V. Gupta, T. Gayathri, S. P. Singh, P. A. Angaridis, T. N. Kitsopoulos, D. Tasis and A. G. Coutsolelos, RSC Adv., 2013, 3, 22412 RSC
.
- T. Li, Y. Lee and H. Teng, J. Mater. Chem., 2011, 21, 5089 RSC
.
- D. Chen, F. Huang, Y. B. Cheng and R. A. Caruso, Adv. Mater., 2009, 21, 2206 CrossRef CAS
.
- S. T. Kochuveedu, Y. H. Jang and D. H. Kim, Chem. Soc. Rev., 2013, 42, 8467–8493 RSC
.
- S. Cavaliere, S. Subianto, I. Savych, D. J. Jones and J. Rozière, Energy Environ. Sci., 2011, 4, 4761 CAS
.
- F. Zhang, Z. Cheng, L. Kang, L. Cui, W. Liu, X. Xu, G. Hou and H. Yang, RSC Adv., 2015, 5, 32088 RSC
.
- K. S. Chou and C. Y. Ren, Mater. Chem. Phys., 2000, 64, 241 CrossRef CAS
.
- M. Hu, M. Fang, C. Tang, T. Yang, Z. Huang, Y. Liu, X. Wu and X. Min, Nanoscale Res. Lett., 2013, 8, 548 CrossRef PubMed
.
- X. B. Cao, X. M. Lan, Y. Guo, C. Zhao, S. M. Han, J. Wang and Q. R. Zhao, J. Phys. Chem. C, 2007, 111, 18958 CAS
.
- T. Hasell, J. Yang, W. Wang, P. D. Brown and S. M. Howdle, Mater. Lett., 2007, 61, 4906 CrossRef CAS
.
- S. Laurent, D. Forge, M. Port, A. Roch, C. Robic, L. Vander Elst and R. N. Muller, Chem. Rev., 2008, 108, 2064 CrossRef CAS PubMed
.
- H. G. Yang and H. C. Zeng, J. Phys. Chem. B, 2004, 108, 3492 CrossRef CAS
.
- C. Su, L. Liu, M. Zhang, Y. Zhang and C. Shao, CrystEngComm, 2012, 14, 3989 RSC
.
- S. Rengaraj and X. Z. Li, J. Mol. Catal. A: Chem., 2006, 243, 60 CrossRef CAS
.
- L. Zhang, J. C. Yu, H. Y. Yip, Q. Li, K. W. Kwong, A. W. Xu and P. K. Wong, Langmuir, 2003, 19, 10372 CrossRef CAS
.
- D. Reyes-Coronado, G. Rodriguez-Gattorno, M. E. Espinosa-Pesqueira, C. Cab, R. de Coss and G. Oskam, Nanotechnology, 2008, 19, 145605 CrossRef CAS PubMed
.
- B. Sun, G. Panagiotis and P. Boolchand, Langmuir, 2005, 21, 11397 CrossRef CAS PubMed
.
- K. Mizushima, M. Tanaka, A. Asai and S. Iida, J. Phys. Chem. Solids, 1979, 40, 1129 CrossRef CAS
.
- B. Xin, L. Jing, Z. Ren, B. Wang and H. Fu, J. Phys. Chem. B, 2005, 109, 2805 CrossRef CAS PubMed
.
- M. A. Behnajady, N. Modirshahla, M. Shokri and B. Rad, Global NEST J., 2008, 10, 1 Search PubMed
.
- S. S. Latthe, S. An, S. Jin and S. S. Yoon, J. Mater. Chem. A, 2013, 1, 13567 CAS
.
- J. Gopal, J. Lakshmaiah Narayana, N. Hasan and H. Wu, New J. Chem., 2015, 39, 4909 RSC
.
- M. R. Khan, T. W. Chuan, A. Yousuf, M. N. K. Chowdhury and C. K. Cheng, Catal. Sci. Technol., 2015, 5, 2522 CAS
.
- J. M. Herrmann, H. Tahiri, Y. Ait-Ichou, G. Lassaletta, A. R. Gonzales-Elipe and A. Fernandez, Appl. Catal., B, 1997, 13, 219 CrossRef CAS
.
- T. Wu, G. Liu, J. Zhao, H. Hidaka and N. Serpone, J. Phys. Chem. B, 1998, 102, 5845 CrossRef CAS
.
- J. Zhuang, W. Dai, Q. Tian, Z. Li, L. Xie, J. Wang and D. Wang, Langmuir, 2010, 26, 9686 CrossRef CAS PubMed
.
- J. Yu, G. Dai and B. Huang, J. Phys. Chem. C, 2009, 113, 16394 CAS
.
Footnote |
| † Electronic supplementary information (ESI) available. See DOI: 10.1039/c5ra17762f |
| This journal is © The Royal Society of Chemistry 2016 |

