Influence of immobilized rubber on the non-linear viscoelasticity of filled silicone rubber with different interfacial interaction of silica
Hanmei Zhoua,
Lixian Songab,
Ai Lu*ab,
Tao Jianga,
Fengmei Yub and
Xiaochuan Wangab
aMaterial Science and Engineering College, Southwest University of Science and Technology, Mianyang 621010, Sichuan, China. E-mail: ai_lur@sina.com
bInstitute of Chemical Materials, China Academy of Engineering Physics, Mianyang 621900, Sichuan, China
First published on 25th January 2016
Abstract
For a better understanding of the influence of the immobilized rubber on the non-linear viscoelasticity of filled rubber, spherical silica without intensive filler–filler interactions and with weak silica–rubber interactions was introduced in order to compare the non-linear viscoelasticity of the commercial silica filled rubber. It was observed that the amplitude of Payne effect is related to the interfacial interaction characterized by the content of bound rubber. An interesting phenomenon was produced in the effect of temperature on the Payne effect for spherical silica filled rubber that the amplitude of Payne effect decreases with the temperature below 253 K but the storage modulus increases with the temperature above 253 K which performs the feature of entropic elasticity as pure rubber. The activation energy of the unstable chains can be also divided into two sections in the temperature range which is related to the critical value of immobilized rubber to influence the Payne effect. The results reveal that the number of immobilized rubber reduces with the temperature and it has a critical value to affect the Payne effect which is verified by Maier–Göritz model. The introduction of this kind of spherical silica provides an experimental method to study the non-linear viscoelasticity elaborately.
Introduction
It is well known that the addition of nanoparticles has a great impact on the performance of rubber. Due to the presence of filler, it can improve the various mechanical properties of the final materials, such as elastic modulus1 and strength at break. “Payne effect”, which is the effect of strain on the viscoelastic properties of filled rubber, has been extensively investigated because it directly influences the energy consumption. At small strains, the filled rubber presents a non-linear viscoelastic behavior. This behavior is characterized by a decrease of storage modulus G′ of filled rubber when the strain amplitude increases, whereas the loss modulus G′′ reaches a maximum.2–4 Many researchers have studied this phenomenon with experimental and theoretical methods.5–9 The pioneering researches were carried out by Payne10–13 which interpreted the decrease of modulus with strains as the filler network damage. It was proved by imaging the strain induced carbon black filler network breakage with nano X-ray tomography.14 Then, Kraus15,16 developed a model to explain Payne effect with the continuous destruction and reform of filler–filler interactions by assuming van der Waals interactions between particles. However, this interpretation didn't take into account the influence of temperature, and it was invalid when the filler concentration was well below the percolation threshold. Mirta I. Aranguren et al.17,18 have studied the dynamic mechanical properties of fumed silica filled PDMS and suggested that the strong strain dependence of dynamic modulus was explained by agglomeration of silica aggregates through different bridging polymer chains which can be evidenced by the bound rubber measurements.19,20 Maier and Göritz21 have proposed a model about adsorption and desorption of rubber molecular chains on the filler surface to interpret the Payne effect. M. J. Wang22 have described that the Payne effect was generated from the breakage and reformation of filler network formed directly between filler particles or through the elastomer. Too many researchers have studied the actual mechanism by which fillers modify non-linear viscoelasticity, however, the dominant theory posits a strong interaction at the filler–rubber interface which has effects on the mechanical behavior of composites.23–41 Filler–rubber interactions, mainly reflected by the immobilized rubber, determine the interfacial structures. Nuclear magnetic resonance (NMR) spectroscopy has demonstrated the existence of interphase, in that chain mobility near the fillers was less than of the matrix.42–44 Other researchers45–47 have suggested that the immobilized rubber decreased with the increased temperature. However, the influence of immobilized rubber on non-linear viscoelasticity has not been demonstrated by experimental method of introducing the spherical silica instead of surface modification of fillers.In our study, we explored the influence of the immobilized rubber on the non-linear viscoelasticity by introducing the spherical silica (sol–gel silica) to weaken the filler–rubber interactions. The structures of immobilized rubber were characterized by Transmission Electron Microscopy (TEM) and Thermogravimetric Analysis (TGA). The temperature factor was introduced to determine the function of immobilized rubber in the non-linear viscoelasticity. To compare the structures of immobilized rubber for different composites at various temperatures and the corresponding non-linear viscoelasticity, we can demonstrate the mechanism of this macroscale mechanical performance. We then applied the Maier–Göritz model to analyze the change of stable and unstable bonds in immobilized rubber bringing a furthermore study of non-linear viscoelasticity.
Experimental
Materials
Silicone rubber (type: 110-2, Mn = 6.5 × 10⁶, 0.23%/mol vinyl content) was purchased from Zhejiang Xin'an Chemical Group Co., Ltd. (China). Dicumyl peroxide (DCP) used as crosslinking agent was obtained from Chengdu Kelong Chemical Reagent Industry (China). Fumed silica (A200, referred to as silica A) was purchased from Dugessa Co., Ltd (Germany). Precipitated silica (Z142, referred to as silica Z) was purchased from Qingdao Rhodia Co., Ltd (China). Sol–gel silica (referred to as silica G) was obtained from the Technical Institute of Physics and Chemistry, CAS. The other materials are all commercially available.Composite preparation
Mixed rubber was prepared by a torque rheometer (RC400P, HAAKE Co., Ltd, Germany). The weight ratio of pure rubber and DCP was 100![[thin space (1/6-em)]](https://www.rsc.org/images/entities/char_2009.gif) :
:![[thin space (1/6-em)]](https://www.rsc.org/images/entities/char_2009.gif) 3, and filler (precipitated silica, fumed silica and sol–gel silica) concentration was kept in the range of 10 to 70 phr (weight content of silica).
3, and filler (precipitated silica, fumed silica and sol–gel silica) concentration was kept in the range of 10 to 70 phr (weight content of silica).
The compounds were prepared by a two-step mixing method. A master batch of rubber and silica was mixed for 30 minutes at 378 K, and the rotational speed was 90 rpm. After 2 weeks of adsorption at room temperature, the crosslinking agent DCP was added into the compounds at room temperature with 60 rpm for 15 minutes.
Crosslinked silicone rubber sheet was prepared with mixed rubber in a platen press (P300E, DR COLLIN Co., Ltd, Germany) at 433 K under the press of 20 MPa for 10 minutes. The thickness of the obtained rubber sheet was 0.6 mm. A1 to A7 denote the rubber filled with silica A from 10 to 70 phr. Z1 to Z7 define the rubber filled with silica Z from 10 to 70 phr. G1 to G7 represent the rubber filled with silica G from 10 to 70 phr. The unfilled crosslinked rubber is referred to as S0.
Bound rubber measurements
The uncrosslinked compounds filled 40 phr silica were enclosed in stainless-steel cages with 600 mesh size and immersed into toluene solvent till 96 hours. The dissolving systems were kept at different temperature ranging from 253 K to 333 K at intervals of 20 K, and the solvent was renewed every 24 hours. Then the cages (with bound rubber and the filler) was removed from solvent and dried at room temperature for some hours, then kept in a vacuum oven at 333 K to constant weights.48 The obtained samples were heated from 298 K to 1073 K at a rate of 20 K min−1 under nitrogen purge to determine the amount of bound rubber, using Thermogravimetric Analysis (TGA, PerkinElmer, USA).49,50Morphology characterization
The features of the elementary particles were characterized by a surface area analyzer (Quantachrome, Autosorb-1) at liquid N2 and NanoBrook 90Plus Particle Size Analyzer. The corresponding bound rubber was observed by Transmission Electron Microscopy (TEM). The tested samples of bound rubber were extracted from the compounds filled with 40 phr silica at different temperature and dispersed in ethanol. TEM observations were performed on an H-800 transmission electron microscope (Zeiss, Libra 200FE) with an acceleration voltage of 200 kV.Isothermal crystallization measurements
Differential scanning calorimetry (DSC) was conducted on a TA Q2000 apparatus under a nitrogen atmosphere and the mass of sample is about 10 mg. The samples were cooled from room temperature to 213 K at a programmed rate of 30 K min−1 and held at 213 K until the crystallization finished.Viscoelastic measurements
The viscoelastic measurements were performed on RSA-G2 (TA Instruments) in tension mode. Payne effect measurements were carried out at a constant frequency of 1 Hz at various temperatures. To study the effects of filler loading and temperature on the Payne effect, we tested the samples containing different filler contents of 10 to 70 phr at various temperatures ranging from 213 to 373 K.Results and discussion
Morphology
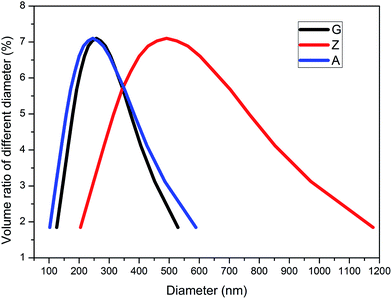
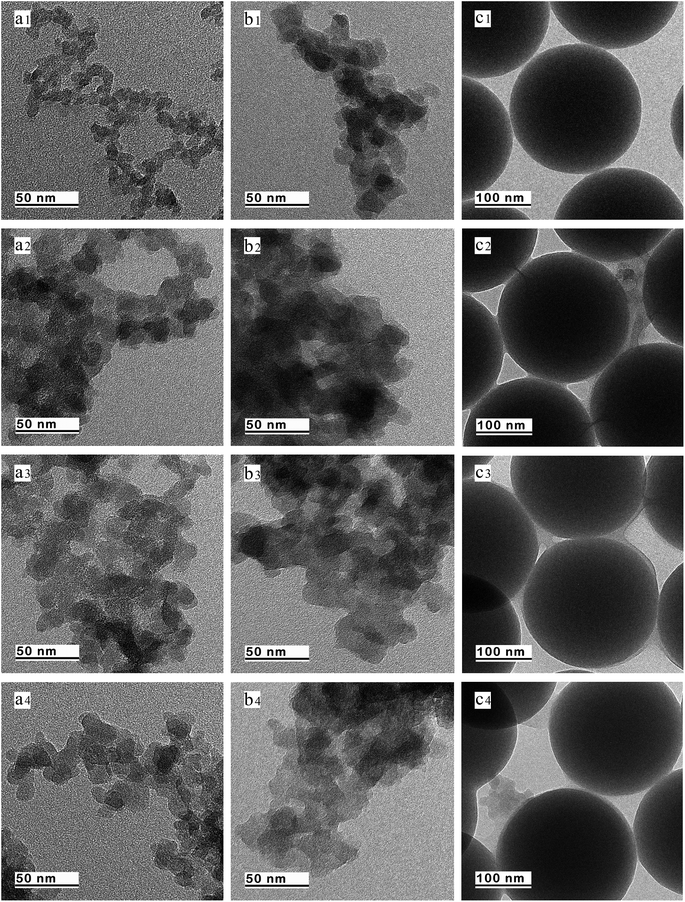
The distributions of particle size characterized by NanoBrook 90Plus Particle Size Analyzer for silica A, Z and G are shown in Fig. 1. The mean diameters of silica A, Z and G are 240 nm, 470 nm and 250 nm, respectively. Silica A of 80% volume fraction is distributed in the range of 150 to 410 nm which is similar to silica G and silica Z of the same volume fraction is ranged from 280 to 820 nm. It indicates that the aggregates of silica A and silica G are closed while the aggregates for silica Z are larger than the other two fillers. According to the results of surface area analyzer, the values of specific surface area for silica A, Z and G are 200 m2 g−1, 140 m2 g−1 and 16 m2 g−1, respectively.The TEM micrographs of elementary particles for silica A, Z and G are given in Fig. 2a1–c1. High magnification images show that silica A is aggregated by a number of primary quasi-spherical particles of 10 nm. Silica Z with the grain diameter of 20 nm has a similar structure with silica A. Silica A particles tend to aggregate to higher extent than silica Z due to their smaller grain size (10 nm) and larger specific surface area (200 m2 g−1). It is observed that the structure of silica G is formed by the typically monodisperse solid spherical particles with grain diameter of 200 nm which is totally disparate from silica A and Z. The image analysis performed on TEM pictures reveals that the physical interactions between particles are intensive in silica A and Z, whereas these interactions in silica G are relatively weak. Therefore, the agglomerations in silica A and Z can be more easily developed by interactions of aggregates than silica G.
Fig. 2a3–c3 show the TEM graphs of bound rubber surrounding the silica A, Z and G (referred to as BRA, BRZ and BRG) at 293 K. From the samples of BRA and BRZ, it can be found that the bound rubber with silica A flocculates a homogeneous continuous structure similar to BRZ, but the thickness of bound rubber layer for sample BRZ is not as thick as BRA. For sample BRG, it has been found that the small number of bound rubber exist on the filler surface which connect the adjacent particles all around. Viewed from this aspect, it is supposed that the filler network in the compound filled with silica A or Z is formed via both direct contacts of filler aggregates and rubber molecular chains. The morphology of bound rubber reflects the interaction intensity between fillers and rubber molecular chains. It indicates the strongest filler–rubber interactions exist in BRA while the weakest filler–rubber interactions exist in BRG. Because of the infirm interactions of filler–rubber for sample BRG, it can be deduced that the silica G particles can only form the incomplete filler network by the direct contacts of filler particles or by the small number of immobilized rubber which perform as supplementary links. The TEM images of bound rubber collected at 253 K, 293 K and 333 K are shown in Fig. 2. It is found that the grain diameter of particles which form the aggregates is larger than the original particles due to the adsorption of rubber molecular chains. For the samples collected at 253 K, the grain diameter is larger than the samples collected at 333 K. It indicates that the filler–rubber interactions are more intensive at low temperature.
Bound rubber
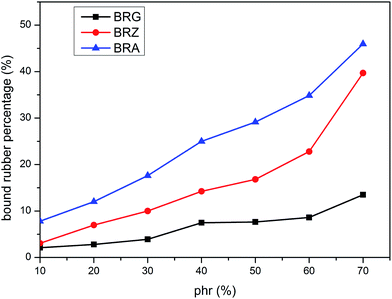
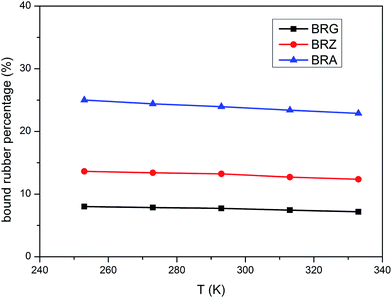
According to the thermal degradation,51,52 hydroxyl terminated poly(methyl vinyl) silicone rubber depolymerizes through Si–O bond scission in a stepwise fashion from chain ends, and the resultant volatile cyclic oligomers lose weight completely in nitrogen.49 The content of bound rubber can be considered as the weight percentage (PBR) which is characterized by the undissolved silicone rubber versus the initial total rubber.The values of PBR for bound rubber extracted from compounds filled with different filler loadings at 293 K are shown in Fig. 3. It can be seen that the bound rubber content percentage is increased with the filler loading. This result is derived from the growth of multiple attachment points and the decrease of the distance between filler particles which are beneficial to form the adsorbed chains with the increasing silica concentration. According to the experiment results, the amount of the bound rubber is the minimum for BRG in these three types silicone rubber containing identical particle loading whereas the maximum for BRA. It is demonstrated that the rubber with silica A has a high degree of filler–rubber interactions but such interactions for samples with silica G can be considered as practically very weak. This is similar to the results in the above section. The variations of bound rubber with temperature for compounds filled with 40 phr silica are given in Fig. 4. It is observed that the content of bound rubber is reduced with the increasing temperature for both three types of rubber. It indicates that the intensity of filler–rubber interactions is decreased with the increasing temperature. This temperature dependence of bound rubber is uniform with the other researches.45–47
Viscoelastic properties versus strain
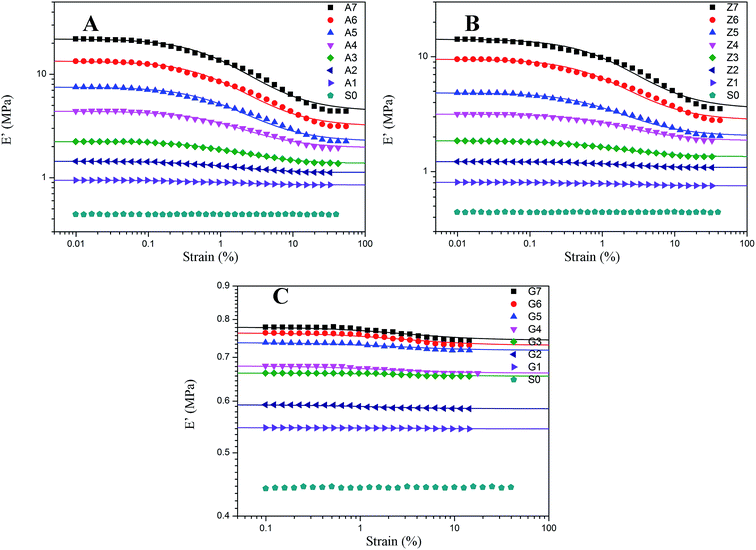
The results of nonlinear viscoelastic behavior for silica filled silicone rubber have been shown in Fig. 5 to 10. Beyond a small strain, the storage modulus of filled rubber drops from a plateau value E′0 to a minimum value E′∞. The loss modulus E′′ as shown in Fig. 6 exhibits a typical loss peak in which the similar range of the storage modulus E′ reduces. It is a dissipated energy behavior caused by the rubber matrix, the collapse of network, the shear of glassy layers, and the friction of particles and rubber chains around them.53 When applying deformation to the unfilled rubber, the storage modulus and loss modulus remain unchanged with the strain amplitude.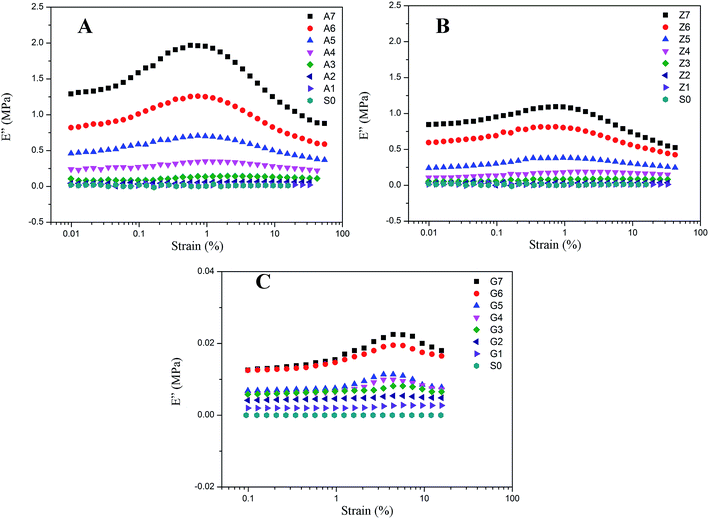 | ||
| Fig. 6 Loss modulus vs. strain for filled rubber. (A) 10 phr to 70 phr silica A filled rubber; (B) 10 phr to 70 phr silica Z filled rubber; (C) 10 phr to 70 phr silica G filled rubber. | ||
The effect of the silica concentrations on the storage modulus for the composites is prominent as shown in Fig. 5. The experimental samples of series A, Z and G (series A, Z and G are the composites respectively filled with silica A, Z, and G) exhibit an increasing tendency of the magnitude of the Payne effect (E′0–E′∞) with increasing silica content respectively. It is found in the experiment data that both the initial storage modulus and the final storage modulus increase with the variation of the silica content from 10 to 70 phr. At higher filler concentration, the silica A and Z are more likely to form agglomerates by the direct contacts of filler aggregates or through the rubber molecular chains. Under this circumstances, the number of immobilized rubber increases resulting in the augmentation of the modulus for composites. Also, the filler network is established more rigidly with the filler content which would cause the modulus of the composites to increase and the strain where the storage modulus starting to drop to minish. It means that the network begins to break at a lower strain. In addition, the nonlinear viscoelastic behavior still exists even at low silica loading well below the percolation threshold. From this phenomenological point of view, applying the filler–filler interactions only to interpret the Payne effect mechanism at low silica content is invalid because there is a remote possibility to form filler network.
The decrease of the storage modulus for crosslinked silicone rubber is in relation to both filler–filler interactions and immobilized rubber. It is evidenced by the samples of series A, Z and G. As shown in Fig. 5, the nonlinear viscoelastic behaviors of the three types of filled silicone rubber are different. At the identical filler concentration, we observed that the magnitude of the nonlinear effect is the greatest within series A, while the minimum within series G. This can be mainly attributed to the various structure of the silica. According to the experiment results above, the interactions of filler–filler and filler–rubber for the three series rubber are completely different. It has been evidenced that within the series A the strong network structure was constructed by the greatest interactions of filler–filler and filler–rubber in the three types of rubber, while series G cannot form such a structure due to the infirm interactions of filler–rubber. When inflicting deformation to the composites, the network starts to break which leads the storage modulus of series A and Z to a lower value. The filler aggregates for series A and Z are in the relationship of competition of the agglomeration and de-agglomeration in the strain sweeps while the immobilized rubber is in the state of adhesion and de-adhesion. The multiple points of adsorption become single points which results in the increased mobility of immobilized rubber molecular chains. In terms of series G, the incomplete filler network collapses via the breakdown of direct contacts or the motion of immobilized rubber molecular chains. The amplitude of Payne effect for series G is the weakest and the value of modulus is the smallest in the three types of rubber, because the interactions of filler–rubber in series G are faint which lead to the fragile filler network. The immobilized rubber of series G can act as supplementary crosslinks. Particularly, for the sample of G7, the effective filler volume fraction is approximately 34.404% and the bound rubber accounts for approximately 10.234%. The filler–filler interactions are relatively stronger than the composites filled with other contents of silica G, but the amplitude of Payne effect and the value of modulus are still small due to the remaining small number of immobilized rubber. It is indicated that the Payne effect is intimately related to the immobilized rubber molecular chains, and it is faint when the composite has weak immobilized rubber which is a part of filler network.
Temperature effect
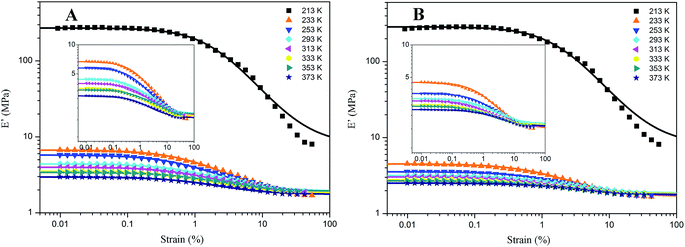
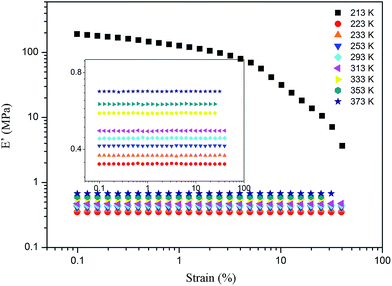
For the samples of A4 and Z4, we have researched the influence of temperature on the Payne effect from 213 to 373 K as shown in Fig. 7. It can be seen that the amplitude of the nonlinear viscoelastic behavior for A4 and Z4 is gradually decreased with the increasing temperature on account of the initial storage modulus diminishment, and the final storage modulus of the sample at different temperature remains nearly closed. The variation in this behavior can be associated with the increasing rate of destruction of the filler network, and it is accompanied with the increasing mobility of immobilized rubber molecular chains because of the increasing temperature. However, the storage modulus is increased proportionally with the temperature for pure silicone rubber as shown in Fig. 8, and it is exactly opposite to the results of A4 and Z4 observed in Fig. 7, which is due to the theory of entropic elasticity.54As for G4, the temperature effect is given in Fig. 9. It combines the characteristics of A4, Z4 and pure rubber for Payne effect at different temperature. Above the temperature of 253 K, the storage modulus is gained with the temperature in the same manner with pure silicone rubber, but it reduces when the temperature is below 253 K. This phenomenon is related to the motion of rubber molecular chains with the variation of temperature. Above 253 K, the motion of rubber molecular chains becomes drastic with the increasing temperature which makes the immobilized molecular chains return to the state of freedom. The amount of bound rubber decreases with the increasing temperature as shown in Fig. 2 and 4, whereas the content of rubber in freedom increases. The system performs the feature of entropic elasticity as pure rubber. The Payne effect of G4 is mainly attributed to the collapse of incomplete filler network by the breakdown of direct contacts. Below 253 K, the motion of rubber molecular chains becomes subdued with the drop of temperature, so the filler–rubber interactions and the number of immobilized molecular chains are increased. The system shows the similar temperature effect as normal reinforced rubber which is that the modulus increases and the amplitude of Payne effect is improved with the decreasing temperature. The effective filler volume fraction is increased with the immobilized rubber which results in the modulus increasing. The Payne effect is due to the collapse of incomplete filler network via the breakdown of direct contacts and the motion of immobilized rubber molecular chains.
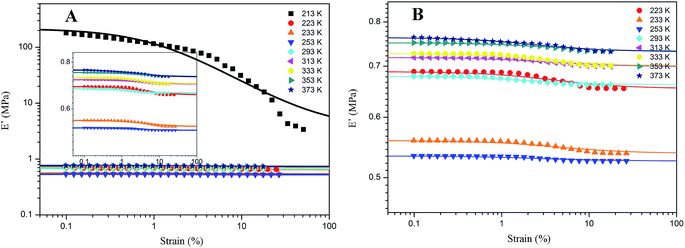 | ||
| Fig. 9 Storage modulus vs. strain for 40 phr silica G filled rubber at different temperature. (A) 213 K to 373 K; (B) partial enlarged drawing of Fig. 7(A). The solid lines represent fitting curves of Maier–Göritz model. | ||
Therefore, the temperature of 253 K is a demarcation point for G4 at which the amount of immobilized rubber exactly reaches a critical value operating on the Payne effect. The immobilized rubber is decreased with the temperature up. The experiments at different temperature for G4 show that the immobilized rubber begins to influence the Payne effect of reinforced rubber when the number of immobilized rubber approximately obtains the value at 253 K, and then the modulus is increased with the decreasing temperature below 253 K. This critical value of immobilized rubber is beyond the volume fraction of 6.329% for the bound rubber of G4 at 293 K. It can be indicated that the immobilized rubber is an important factor to affect the Payne effect of filled rubber, and it has a critical value to influence the Payne effect.
In addition, the amplitude of Payne effect and the modulus are disparate for A4, Z4 and G4 at the same temperature such as 373 K, 293 K and 213 K depicted in Fig. 10. A4 and Z4 exhibit great variations of storage modulus whereas G4 shows the weak non-linearity. It can be interpreted that the strong filler network exists in A4 and Z4 which is not occurred in G4 as the previous results showed. It is worthwhile to note in Fig. 7 to 10 that an enhanced nonlinear viscoelasticity has been observed in the A4, Z4 and G4 at the temperature of 213 K. It is remarkably well correlated to the silicone rubber crystallization55 as shown in Fig. 11. It is observed that the exothermic peaks exist in the filled and unfilled silicone rubber at 213 K. Surprisingly, a analogical Payne effect has been also observed at 213 K in the case of pure rubber with no filler–filler and filler–rubber interactions, which is contrary to the findings in the literature and can be associated to the pure rubber crystallization. This is similar to the result of the strengthened Payne effect near the glass transition region for the unfilled SBR reported by Pan etc.56 and the find of the obvious of the Payne effect at room temperature for pure natural rubber reported by A. P. Meera etc.39 The mechanism of the nonlinear viscoelasticity around the crystal temperature for A4, Z4 and G4 is the destruction related to both the filler network and the second network which was constructed with the appearance of crystallization of rubber molecular chains. At 213 K, the rubber molecular chains nucleate in the composites which would constrain the motion of more chains. The formed crystals act as the physical supplementary crosslinks to improve the modulus. The number of immobilized rubber and effective filler volume fraction are increased. Especially, this mechanism can be evidenced by the sample of pure rubber in which there is no filler network. Therefore, the constructed second network is the mainly reason for the improvement of modulus and the enhancement of Payne effect.
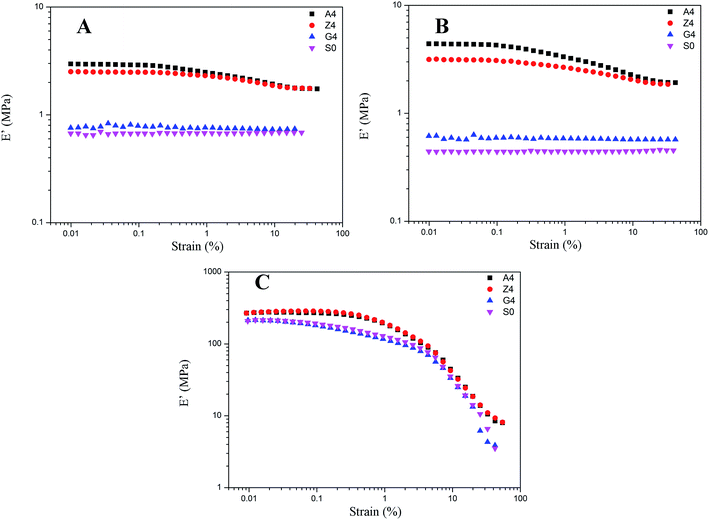 | ||
| Fig. 10 Storage modulus vs. strain for filled rubber with 40 phr silica A, Z, and G respectively and for unfilled rubber at the same temperature. (A) at 373 K; (B) at 293 K; (C) at 213 K. | ||
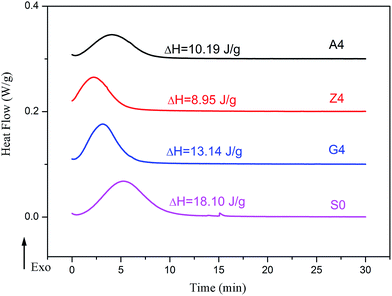 | ||
| Fig. 11 Heat flow versus time during the isothermal crystallization of filled rubber with 40 phr silica and unfilled rubber. | ||
Application of Maier–Göritz model
In the Maier–Göritz model, it has been proposed a molecular interpretation for Payne effect. When the rubber molecular chains adsorption occurs, both stable bonds and unstable bonds have been formed at the interface contributed to the network density of a filled compound which is directly related to Payne effect.| E′ = NkBT | (1) |
| N = Nc + Nst + Ni | (2) |
 | (3) |
We applied the Maier–Göritz model to fit the experimental data with the variation of silica loading. The fit curves are shown in Fig. 5 of solid lines, and the corresponding fit values are given in Tables 1–3. r is defined as correlation coefficient, which reflects the cohesion of correlation of variables. The fit results of series A, Z and G indicate that both E′st, E′i and c have the same discipline of augment with the increasing silica loading. However this model does not take into account the contribution to the modulus value arising from the inclusion of rigid particles and therefore leads to unrealistic values of the number of unstable bonds. So the simulation results of Maier–Göritz model in the large deformation range are higher than the experimental data.
| Silica content (phr) | E′st (MPa) | E′i (MPa) | c | r2 |
|---|---|---|---|---|
| A1 | 0.85 | 0.09 | 0.3578 | 0.9819 |
| A2 | 1.12 | 0.32 | 0.7172 | 0.9947 |
| A3 | 1.37 | 0.87 | 0.7063 | 0.9955 |
| A4 | 1.95 | 2.45 | 0.7230 | 0.9928 |
| A5 | 2.25 | 5.27 | 0.8333 | 0.9932 |
| A6 | 3.14 | 10.26 | 0.9072 | 0.9937 |
| A7 | 4.40 | 17.60 | 0.9116 | 0.9941 |
| Silica content (phr) | E′st (MPa) | E′i (MPa) | c | r2 |
|---|---|---|---|---|
| Z1 | 0.75 | 0.05 | 0.3623 | 0.9750 |
| Z2 | 1.08 | 0.14 | 0.6009 | 0.9875 |
| Z3 | 1.35 | 0.50 | 0.7071 | 0.9949 |
| Z4 | 1.86 | 1.31 | 0.7409 | 0.9919 |
| Z5 | 2.04 | 2.81 | 0.8006 | 0.9933 |
| Z6 | 2.80 | 6.73 | 0.8300 | 0.9904 |
| Z7 | 3.53 | 10.69 | 0.8421 | 0.9866 |
| Silica content (phr) | E′st (MPa) | E′i (MPa) | c | r2 |
|---|---|---|---|---|
| G1 | 0.54 | 0.002 | 0.3135 | 0.8824 |
| G2 | 0.58 | 0.008 | 0.3236 | 0.9137 |
| G3 | 0.66 | 0.010 | 0.3370 | 0.9033 |
| G4 | 0.66 | 0.017 | 0.5246 | 0.9091 |
| G5 | 0.72 | 0.020 | 0.5050 | 0.9174 |
| G6 | 0.73 | 0.033 | 0.5730 | 0.9146 |
| G7 | 0.74 | 0.035 | 0.5810 | 0.9062 |
The Payne effect at different temperature is fitted by this model as shown in Fig. 7 and 9, and the fit parameters are given in Tables 4–6. From the fitting results of A4 and Z4 in 213 K to 373 K temperature range, the parameters E′i, and c are reduced with the temperature, and the values of E′st are changed faintly. It can be indicated that the amplitude of Payne effect is decreased with the temperature up which is in accord with the experimental results. The c parameter decreases when temperature increases, which reflects the shift in the position of the E′ drop. In terms of G4, the E′st reduces initially then increases while E′i reduces initially then remains unchanged with the increasing temperature. The variations of E′st and E′i manifest that the effect of temperature on Payne effect can be divided into two stages which is also in keeping with the experiments. The parameters Nc + Nst and Ni are decreased with the temperature for both three composites. The decrease in stable bonds cannot be attributed to the desorption of tightly bounded chains, which was backed by NMR results that the glassy layer remains 1 nm when temperature up to Tg + 200 K for EPDM system.20 Merabia et al.57,58 have proposed a plausible explanation that materializing the stable bonds as glassy bridges to illustrate the reduction of stable bonds with temperature. According to this model, the unstable bonds can easily break by applying stress or raising temperature. The decrease of Ni reveals that the number of unstable bonds of the network is reduced when the temperature up. Also, it just meets the experimental results for G4 at different temperature. When the temperature is above a certain value at which the number of immobilized rubber is below the critical value to affect the Payne effect, the motion of rubber molecular chains becomes drastic with the increasing temperature which makes the unstable bonds remove from filler surface and return to a state of freedom, so the composites perform the property of entropic elasticity as the rubber in freedom. Below the critical value of immobilized rubber, the E′st increased and the E′i remains constant with temperature. From the fit solid lines and experimental mark lines, it can be seen that this model cannot completely fit the experimental data of A4, Z4 and G4 in the atmosphere of 213 K as shown in Fig. 7 and 9. The enhancement of Payne effect at crystallized temperature improves more unstable factors which are not described in this model.
| T (K) | E′st (MPa) | E′i (MPa) | Nc + Nst (1020 cm−3) | Ni (1020 cm−3) | c | r2 |
|---|---|---|---|---|---|---|
| 213 | 7.93 | 263.22 | 26.96 | 895.07 | 0.485 | 0.9916 |
| 223 | 1.87 | 6.44 | 6.07 | 20.93 | 0.7293 | 0.9948 |
| 233 | 1.70 | 4.95 | 5.29 | 15.39 | 0.6946 | 0.9936 |
| 253 | 1.89 | 4.00 | 5.40 | 11.46 | 0.6596 | 0.9942 |
| 293 | 1.94 | 2.45 | 4.79 | 5.93 | 0.6630 | 0.9937 |
| 313 | 1.89 | 2.09 | 4.37 | 4.83 | 0.6241 | 0.9940 |
| 333 | 1.83 | 1.73 | 3.98 | 3.76 | 0.6068 | 0.9953 |
| 353 | 1.91 | 1.50 | 3.92 | 3.08 | 0.5862 | 0.9969 |
| 373 | 1.75 | 1.18 | 3.41 | 2.30 | 0.5796 | 0.9979 |
| T (K) | E′st (MPa) | E′i (MPa) | Nc + Nst (1020 cm−3) | Ni (1020 cm−3) | c | r2 |
|---|---|---|---|---|---|---|
| 213 | 8.07 | 278.49 | 27.43 | 947.00 | 0.5179 | 0.9911 |
| 223 | 2.28 | 7.73 | 7.41 | 25.12 | 0.6716 | 0.9990 |
| 233 | 1.67 | 2.78 | 5.25 | 8.64 | 0.6628 | 0.9921 |
| 253 | 1.73 | 1.80 | 4.97 | 5.16 | 0.6138 | 0.9943 |
| 293 | 1.86 | 1.31 | 4.60 | 3.24 | 0.6209 | 0.9920 |
| 313 | 1.78 | 1.23 | 4.12 | 2.84 | 0.5529 | 0.9919 |
| 333 | 1.80 | 1.01 | 3.97 | 2.20 | 0.5701 | 0.9940 |
| 353 | 1.78 | 0.93 | 3.65 | 1.91 | 0.4922 | 0.9934 |
| 373 | 1.76 | 0.76 | 3.44 | 1.48 | 0.4573 | 0.9895 |
| T (K) | E′st (MPa) | E′i (MPa) | Nc + Nst (1020 cm−3) | Ni (1020 cm−3) | c | r2 |
|---|---|---|---|---|---|---|
| 213 | 3.52 | 212.17 | 11.97 | 721.49 | 0.8970 | 0.9329 |
| 223 | 0.66 | 0.041 | 2.13 | 0.135 | 0.6784 | 0.9292 |
| 233 | 0.54 | 0.032 | 1.67 | 0.100 | 0.4613 | 0.9113 |
| 253 | 0.53 | 0.018 | 1.51 | 0.053 | 0.3985 | 0.9017 |
| 293 | 0.66 | 0.019 | 1.64 | 0.047 | 0.3760 | 0.9045 |
| 313 | 0.70 | 0.020 | 1.62 | 0.045 | 0.3805 | 0.9056 |
| 333 | 0.70 | 0.020 | 1.52 | 0.044 | 0.3781 | 0.9027 |
| 353 | 0.73 | 0.021 | 1.50 | 0.043 | 0.3751 | 0.9302 |
| 373 | 0.73 | 0.021 | 1.42 | 0.041 | 0.3770 | 0.9413 |
The application of Maier–Göritz model to the experimental data of different Payne effect with the variation of silica loading or temperature demonstrates that this model is consistent with experiment results. In the Maier–Göritz model, the fit results meet the experimental data and can prove the result of critical value of immobilized rubber and the special phenomenon of Payne effect for G4 at different temperature. It can prove that the drop of storage modulus with strains of composites is related not only to the break and reform of filler network but to the motion of immobilized rubber molecular chains.
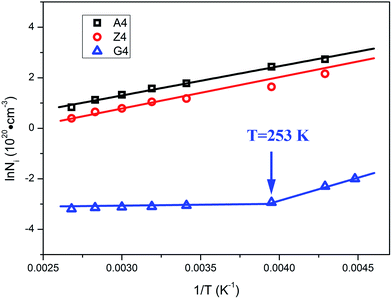
The Arrhenius-plot of the density of unstable chains is shown in Fig. 12 to further analyze the function of immobilized rubber in Payne effect. The temperature dependence of the density of unstable chains is in accord with the Arrhenius law and follows the function:
 | (4) |
From the slope of Arrhenius-plot, the activation energy representing the variation of the number of unstable bonds with temperature can be derived. For samples A4 and Z4, the activation energies are calculated as 9.6 kJ mol−1 and 9.8 kJ mol−1, respectively. These values are in the range of van der Waals interactions and indicate that the unstable bonds are the van der Waals bonds. The occurrence of Payne effect is attributed to the breakage of theses van der Waals bonds. As for G4, the temperature dependence of the density of unstable chains can be also divided into two parts. Above 253 K, the density of unstable chains is independent with temperature. It indicates that the unstable bonds, which vary with temperature, cannot play a leading role in Payne effect, so the influence of the immobilized rubber on Payne effect is inapparent when the temperature is above 253 K. The Payne effect of G4 is mainly due to the incomplete filler network collapses by the breakdown of direct contacts which is not contained in the Maier–Göritz model. So the activation energy of this part in the Maier–Göritz model cannot be reached. Below 253 K, the density of unstable chains for G4 is proportional to the reciprocal temperature. The calculated activation energy is located around 14 kJ mol−1, value typical for van der Waals interactions, and gives evidence that the breakage of unstable bonds leads to Payne effect. The immobilized rubber starts to affect the Payne effect, and the Payne effect is due to the incomplete filler network collapses via the breakdown of direct contacts and the immobilized layer. It also provides the proof of the existence of critical value of immobilized rubber and the special phenomenon of Payne effect with two absolutely different trends for activation energy of G4. In this temperature range, the number of immobilized rubber for G4 is close to the critical value to affect Payne effect, so the density of unstable chains is more sensitive than the other two composites and the value of activation energy of G4 is larger than A4 and G4.
Conclusion
This paper is aimed at the influence of immobilized rubber on Payne effect for filled poly(methyl vinyl) silicone rubber. The spherical silica (silica G) was introduced to weaken the filler–rubber interactions which can be compared with the composites filled with commercial silica. The structures of immobilized rubber were characterized by Transmission Electron Microscopy (TEM) and Thermogravimetric Analysis (TGA). The results show that the immobilized rubber with silica A flocculates a homogeneous continuous structure similar to BRZ, which leads to the strong filler network. For sample BRG, the small number of immobilized rubber exist on the filler surface to form the incomplete filler network. The amount of immobilized rubber is decreased with the increasing temperature.The variations of Payne effect with silica contents show that the amplitude of Payne effect is the greatest in the composite with strong filler–filler interactions and immobilized rubber, and it is the weakest in the composite with incomplete filer network. It indicates that the mechanism of Payne effect is due to the breakdown of filler network caused by the direct contacts of filler aggregates and immobilized rubber.
The immobilized rubber is an important structure in the non-linear viscoelasticity. It is proved by temperature effect of Payne effect especially the occurrence of two kinds of tendencies at different temperature for G4 which is related to the motion of immobilized rubber molecular chains with the variation of temperature. Generally, the amplitude of Payne effect is reduced with the increasing temperature for samples with intensive interfacial interaction. However, for G4, it performs the feature of entropic elasticity as pure rubber above 253 K and shows the similar temperature effect as normal reinforced rubber below 253 K. It is found that the immobilized rubber has been weakened when the temperature increased and it has a critical value to influence the Payne effect. The mechanism of Payne effect is attributed to the accelerated movements of immobilized rubber and the breakage of direct contacts which result in the destruction of filler network. Particularly, the Payne effect has been enhanced at 213 K for A4, Z4 and G4, especially for unfilled silicone rubber, which is related to a new network constructed by rubber crystallization. The effects of immobilized rubber and direct contacts are not obvious due to the Payne effect for all samples are almost close.
The fitting outcomes of Maier–Göritz model reveal that this model is consistent with experiment results. In the Maier–Göritz model, the fit results meet the experimental data and can prove the result of critical value of immobilized rubber and the special phenomenon of Payne effect for G4 at different temperature. The similar two sections have been observed in activation energy of the unstable chains desorption which can also evidence the experimental results above. It indicates that the Payne effect is related to both the accelerated motion of immobilized rubber and the break of direct contacts.
Acknowledgements
We acknowledge financial support from National Natural Science Foundation of China (Grant no. 51173174, 51473151 and 11302197) and Science and Technology Foundation of Institution of Chemical Material (Grant no. KJCX-201402).References
- J. A. C. Harwood, A. R. Payne and R. E. Whittaker, J. Macromol. Sci., Part B: Phys., 1971, 5, 473 CrossRef CAS.
- K. K. Sadasivuni, A. Saiter, N. Gautier, S. Thomas and Y. Grohens, Colloid Polym. Sci., 2013, 291, 1729–1740 CAS.
- I. S. Gunes, G. A. Jimenez and S. C. Jana, Carbon, 2009, 47, 981 CrossRef CAS.
- S. Bhattacharyya, C. Sinturel, O. Bahloul, S. Thomas and J. Salvetat, Carbon, 2008, 46, 1037 CrossRef CAS.
- P. Cassagnau, Polymer, 2003, 44, 2455–2462 CrossRef CAS.
- Y. L. Chen, Z. W. Li, S. P. Wen, Q. Y. Yang, L. Q. Zhang, C. L. Zhong and L. Liu, J. Chem. Phys., 2014, 141, 104901 CrossRef PubMed.
- J.-C. Majesté and F. Vincent, J. Rheol., 2015, 59, 405–427 CrossRef.
- Z. Y. Zhu, T. Thompson, S.-Q. Wang, E. D. V. Meerwall and A. Halasa, Macromolecules, 2005, 38, 8816–8824 CrossRef CAS.
- D. Tscharnuter, S. Gastl and G. Pinter, Int. J. Eng. Sci., 2012, 60, 37–52 CrossRef CAS.
- A. R. Payne, J. Appl. Polym. Sci., 1962, 6, 57–63 CrossRef CAS.
- A. R. Payne, J. Appl. Polym. Sci., 1962, 6, 368–372 CrossRef CAS.
- A. R. Payne, J. Appl. Polym. Sci., 1965, 9, 1073–1082 CrossRef CAS.
- A. R. Payne, J. Appl. Polym. Sci., 1965, 8, 2661–2686 CrossRef.
- W. M. Zhou, L. Chen, J. Lu, Z. M. Qi, N. D. Huang, L. B. Li and W. X. Huang, RSC Adv., 2014, 4, 54500–54505 RSC.
- G. Kraus, Rubber Chem. Technol., 1978, 51, 297–321 CrossRef.
- G. Kraus, J. Appl. Polym. Sci., 1984, 39, 75 CAS.
- M. I. Aranguren, E. Mora, C. W. Macosko and J. Saam, Rubber Chem. Technol., 1910, 67, 820–832 CrossRef.
- M. I. Aranguren, E. Mora, J. V. DeGroot and C. W. Macosko, J. Rheol., 1992, 36, 1165–1181 CrossRef CAS.
- V. M. Litvinov and H. W. Spiess, Macromol. Chem., 1991, 192, 3005 CrossRef CAS.
- V. M. Litvinov and P. A. M. Steeman, Macromolecules, 1999, 32, 8476–8490 CrossRef CAS.
- P. G. Maier and D. Goritz, Kautsch. Gummi Kunstst., 1996, 49, 18 CAS.
- M. J. Wang, Rubber Chem. Technol., 1998, 71, 520 CrossRef CAS.
- C. Gauthier, E. Reynaud, R. Vassoille and L. Ladouce-Stelandre, Polymer, 2004, 45, 2761–2771 CrossRef CAS.
- L. Ladouce-Stelandre, Y. Boml, L. Flandin and D. Labarre, Rubber Chem. Technol., 2003, 76, 145–159 CrossRef CAS.
- K. W. Stöckelhuber, A. S. Svistkov, A. G. Pelevin and G. Heinrich, Macromolecules, 2011, 44, 4366–4381 CrossRef.
- J. Ramier, C. Gauthier, L. Chazeau, L. Stelandre and L. Guy, J. Polym. Sci., Part B: Polym. Phys., 2007, 45, 286–298 CrossRef CAS.
- S. S. Sternstein and A.-J. Zhu, Macromolecules, 2002, 35, 7262–7273 CrossRef CAS.
- A.-J. Zhu and S. S. Sternstein, Compos. Sci. Technol., 2003, 63, 1113–1126 CrossRef CAS.
- X. Huang, X. L. Fang, Z. Lu and S. Chen, J. Mater. Sci., 2009, 44, 4522–4530 CrossRef CAS.
- X. Fu, G. S. Huang, Z. T. Xie and W. Xing, RSC Adv., 2015, 5, 25171–25182 RSC.
- M. Mortezaei, M. H. N. Famili and M. Kokabi, Compos. Sci. Technol., 2011, 71, 1039–1045 CrossRef CAS.
- A. Papon, H. Montes, F. Lequeux, J. Oberdisse, K. Saalwächter and L. Guy, Soft Matter, 2012, 8, 4090–4096 RSC.
- F. Fleck, V. Froltsov and M. Klüppel, Soft Matter, 2014, 12, S121–S134 CrossRef.
- A. Papon, H. Montes, F. Lequeux and L. Guy, J. Polym. Sci., Part B: Polym. Phys., 2010, 48, 2490–2496 CrossRef CAS.
- J. L. Leblanc, Prog. Polym. Sci., 2002, 27, 627–687 CrossRef CAS.
- J. X. Shen, J. Liu, H. D. Li, Y. Y. Gao, X. L. Li, Y. P. Wu and L. Q. Zhang, Phys. Chem. Chem. Phys., 2015, 17, 7196–7207 RSC.
- F. Clément, L. Bokobza and L. Monnerie, Rubber Chem. Technol., 2005, 78, 211–231 CrossRef.
- F. Clément, L. Bokobza and L. Monnerie, Rubber Chem. Technol., 2005, 78, 232–244 CrossRef.
- A. P. Meera, S. Said, Y. Grohens and S. Thomas, J. Phys. Chem. C, 2009, 113, 17997–18002 CAS.
- D. Ponnamma, K. K. Sadasivuni, M. Strankowski, P. Moldenaers, S. Thomas and Y. Grohens, RSC Adv., 2013, 3, 16068 RSC.
- J. Sun, Y. Song, Q. Zheng, H. Tan, J. Yu and H. Li, J. Polym. Sci., Part B: Polym. Phys., 2007, 45, 2594–2602 CrossRef CAS.
- J. Berriot, F. Martin, H. Montes, L. Monnerie and P. Sotta, Polymer, 2003, 44, 1437–1447 CrossRef CAS.
- G. Simon, K. Baumann and W. Gronski, Macromolecules, 1992, 25, 3624–3628 CrossRef CAS.
- J. Rault, J. Marchal, P. Judeinstein and P. A. Albouy, Eur. Phys. J. E: Soft Matter Biol. Phys., 2006, 21, 243–261 CrossRef CAS PubMed.
- N. Kida, M. Ito, F. Yatsuyanagi and H. Kaido, J. Appl. Polym. Sci., 1996, 61, 1345–1350 CrossRef CAS.
- A. Robisson, Mech. Mater., 2010, 42, 974–980 CrossRef.
- S. Wolff, M. J. Wang and E. H. Tan, Rubber Chem. Technol., 1993, 66, 163–177 CrossRef CAS.
- W. Xing, J. R. Wu, G. S. Huang, H. Li, M. Z. Tang and X. Fu, Polym. Int., 2014, 63, 1674–1681 CrossRef CAS.
- Y. L. Yue, H. Zhang, Z. Zhang and Y. F. Chen, Compos. Sci. Technol., 2013, 86, 1–8 CrossRef CAS.
- G. Camino, S. M. Lomakin and M. Lazzari, Polymer, 2001, 42, 2395 CrossRef CAS.
- T. Thomas and T. Kendrick, J. Polym. Sci., Part B: Polym. Phys., 1969, 7, 537 CrossRef CAS.
- N. Grassie and I. G. Macfarlane, Eur. Polym. J., 1978, 14, 875 CrossRef CAS.
- L. L. Qu, L. J. Wang, X. M. Xie, G. Z. Yu and S. H. Bu, RSC Adv., 2014, 4, 64354–64363 RSC.
- L. R. G. Treloar and D. J. Montgomery, Phys. Today, 1959, 12, 32 CrossRef.
- A. M. Stricher, R. G. Rinaldi, C. Barres, F. Ganachaud and L. Chazeau, RSC Adv., 2015, 5, 53713–53725 RSC.
- X. D. Pan and E. D. Kelley, Polym. Eng. Sci., 2003, 43, 1512–1521 CAS.
- S. Merabia, P. Sotta and D. R. Long, Macromolecules, 2008, 41, 8252–8266 CrossRef CAS.
- S. Merabia, P. Sotta and D. R. Long, J. Polym. Sci., Part B: Polym. Phys., 2010, 48, 1495–1508 CrossRef CAS.
| This journal is © The Royal Society of Chemistry 2016 |

