Raman spectroscopic study on the equilibrium of carbon dioxide in aqueous monoethanolamine†
M. K. Wong,
A. M. Shariff* and
M. A. Bustam
Research Centre for CO2 Capture (RCCO2C), University Teknologi PETRONAS, 31750 Tronoh, Perak, Malaysia. E-mail: azmish@petronas.com.my; Tel: +605 3687570
First published on 12th January 2016
Abstract
Aqueous phase characterization and thermodynamic modeling of the vapor liquid equilibrium of CO2 in a reactive solvent are important for designing and operating CO2 removal systems. A quantitative method using Raman spectroscopy was applied to determine the absorption capacity and molality of various ionic and molecular species in liquid phase CO2 loaded monoethanolamine (MEA) solutions. Species distribution profiles during absorption were reported for a wide range of CO2 loading. CO2 solubility in aqueous MEA with concentrations varied from 10 to 30 mass% were studied using in situ Raman spectroscopic analysis for pressure ranges from 1 to 50 bar at 303.15, 313.15 and 323.15 K. Vapor liquid equilibrium data for the CO2–MEA–water ternary system was analyzed using the Deshmukh–Mather model.
Introduction
Anthropogenic greenhouse gas emission, particularly carbon dioxide (CO2), is one of the major factors accelerating global warming. It is imperative to develop and deploy efficient methods for acid gas separation across the globe. Alkanolamine based solvent chemisorption is the most established technique for bulk removal of CO2 from a mixed gas stream and aqueous monoethanolamine (MEA) is widely used as a solvent in industry.1 Characterization of liquid phase speciation is important for both the modeling of equilibrium behavior and the kinetics of a reactive CO2 absorption system. Plenty of studies on the equilibrium of CO2 in aqueous amine solution were performed based on pressure changes in the gas phase, but reports on liquid phase analysis are comparatively scarce in the literature.2,3Raman spectroscopy offers some advantages over other spectroscopic or optical methods. With application of fiber optic probes, both vapor and liquid phases can be directly analyzed without disturbing the equilibrium of the system or having to collect sample from the apparatus for remote analysis. It also allows measurement in aqueous system because of the weak Raman scattering of water molecules.4 Several studies on speciation of acid gas in alkanolamine and ammonium systems were reported.5–7 A systematic quantitative method of ionic and molecule species in liquid phase in CO2 loaded MEA solution was recently developed for Raman spectroscopy.8 Comprehensive spectral analysis was performed to identify characteristic peak and calibrate concentration of individual component with assistance of mass balance and electroneutrality equations.
Thermodynamic model is vital for operation of CO2 separation processes and development of new amine based solvent, hence accurate determination of the thermodynamic properties of CO2 in aqueous amine is of major interest for both technical and economical considerations. A number of models can be used to represent vapor–liquid equilibrium of acid gas in aqueous amine solutions. Essentially the models can be classified into three categories.
Empirical models such as models introduced by Danckwerts and McNeil9 and also Kent and Eisenberg,10 which are relatively simple because non-idealities of the system are accounted in equilibrium constants. All activity and fugacity coefficients are assumed to be one and two pseudo equilibrium constants are fitted to experimental solubility data. Despite its simplicity, Kent–Eisenberg model is widely used and can give fairly good prediction of partial pressure of CO2 over aqueous solution of alkanolamines.11,12 However, extrapolation applicability beyond experimentally tested region is rather limited. The model is modified to include more data and parameters for fitting to better represent vapor liquid equilibrium of CO2 absorption in solutions of single and blended amines.13
Semi empirical activity models based on excess Gibbs free energy. Deshmukh–Mather model employed Debye–Huckel law and the Guggenheim equation to represent activity coefficients.14 Electrolyte NRTL model was developed by Chen and Evans15 to examine the behavior of aqueous multicomponent electrolyte systems by adopting Pitzer–Debye–Huckel equation and NRTL model to determine excess Gibbs energy. The model is applied by Austgen et al.16 and Posey17 for acid gas–alkanolamine–water systems to correlate CO2 solubility and describe speciation in liquid phase via chemical equilibria. A more rigorous model, extended UNIQUAC model is used by Thomsen and Rasmussen18 and Faramarzi et al.19 to analyze VLE for CO2 absorption in aqueous amines.
Equation of state (EoS) model derived from a development of Helmholtz energy is first proposed by Fürst and Renon.20 Application of this approach in reactive absorption system for CO2 capture is comparatively more recent. This modeling method provides representation of thermodynamic properties in both liquid and vapor phases. Equilibrium of CO2 and H2S in different amine solutions over a large gas loading range is modeled with electrolyte EoS.21,22
In this work, Deshmukh–Mather model was selected to simulate reactions of CO2 with aqueous MEA and represent experimental vapor liquid equilibrium data for its practicality and thermodynamics rigorousness. It is also reasonably simpler compared to e-NRTL and EOS models.23 Raman spectroscopic method introduced in previous study was used to measure concentration of ionic and molecular species present in CO2 loaded MEA solution.8 The major chemical species identified are MEA, protonated MEA (MEAH+), carbamate (MEACOO−) bicarbonate (HCO3−), carbonate (CO32−) and molecular CO2. CO2 solubility in aqueous MEA was determined with Raman technique based on total carbon containing species in liquid phase. Experiments of CO2 absorption in MEA solution were conducted at pressures in the range of 1–50 bar and temperatures from 303.15 K to 323.15 K for MEA concentrations of 10, 20 and 30 mass%. Species distribution in equilibrated ternary CO2–MEA–water system for a wide range of CO2 loading was evaluated. Raman speciation data is compared to aqueous phase composition profile predicted by models available in literature.
Experimental
Material
CO2 (99.8%) used in this study was purchased from Air Product Malaysia Sdn. Bhd. MEA with minimum purity of 99% and sodium perchlorate (NaClO4) were supplied by Merck Sdn. Bhd and used as received. 99% MEA was diluted with deionized water to the desired concentration of aqueous MEA solution. A digital analytical balance (Mettler Toledo AS120S) with (uncertainty, ±0.0001 g) was used to prepare the solutions.Methods
An equilibrium setup that combines a high pressure stirred tank reactor (STR) and Raman spectroscopy with immersion probe was utilized for in situ analysis of CO2 reactions and equilibrium phenomena in CO2–MEA–water system. The setup was reported in previous work.8 A known volume of aqueous MEA was injected into STR and the solution was degassed by applying vacuum for a short period. CO2 was pressurized in gas vessel (GV), and then transferred to STR to the desired pressure. Pressures inside STR and GV were measured by BCM pressure transmitters within uncertainty of ±0.1 bar. The gas and liquid were allowed to equilibrate at constant temperature regulated by an oven fitted with heating elements and PID controller which keeps temperature of the equipment enclosed at the setpoint temperature with precision of ±0.5 °C. Equilibrium is attained when no change in pressure of STR is observed for 30 minutes. Equilibration time varies (1–8 hours) with different experiment conditions.Raman spectrum in the liquid phase was collected at the initial condition of experiment and after equilibrium was attained with a Thermo Scientific DXR SmartRaman system. Baseline of spectra was corrected with polynomial function of fourth degree to eliminate background noise using Omnic Specta software (Thermo Fisher Scientific Inc.). Curve-fitting program PeakFit V. 4.12 (Systat Software Inc.) was utilized to resolve complex experimental band envelopes in the region between 300 cm−1 and 3100 cm−1 to detect, separate and quantify overlapping composite peaks. Band resolution was achieved using deconvolution method, which employs Gaussian response function with a Fourier filtering algorithm. Area of species peak is normalized against a reference component peak to eliminate errors introduced by background scattering, laser power, spectral resolution and instrument noise, sodium perchlorate, NaClO4 (AR grade, Merck Sdn Bhd) was added to all MEA solutions to concentration of 0.517 mol kg−1 as internal intensity reference prior to contacting with CO2.
CO2 solubility was measured spectroscopically based on total of carbon containing species detected in liquid phase which represents amount of CO2 absorbed into aqueous MEA. CO2 loading, α (mol of CO2/mol of amine), was determined using eqn (1) with molality of carbamate, bicarbonate, carbonate and molecular CO2 in liquid phase predicted with area ratio of species peak in Raman spectrum.
| α = (CMEACOO− + CHCO3− + CCO32− + CCO2)/CMEA,0 | (1) |
For comparison, CO2 loading in solvent was also calculated based on pressure drop of CO2 in gas phase as shown in eqn (2).
| α = [VGV(P1/z1 − P2/z2) − (PSTR(VSTR − VMEA)/z)]/nMEA,0RT | (2) |
Concentration of species is quantified based on relative molar scattering factor of characteristic band of individual and internal reference band, where relation between concentration of species and area ratio can be expressed as eqn (3).
| mi = (Av/A933)/Jv | (3) |
| Species | Correlation |
|---|---|
| MEA | CMEA = (A2930/A933)/0.2782 |
| MEAH+ | CMEAH+ = (A2975/A933)/0.3573 |
| MEACOO− | CMEACOO− = (A1155/A933)/0.0458 |
| CO2 (aq) | CCO2 = (A1380/A933)/0.0941 |
| HCO3− | CHCO3− = (A1015/A933)/0.2273 |
| CO32− | CCO32− = (A1066/A933)/0.4782 |
Thermodynamic modeling
Chemical equilibrium
A series of parallel reactions that occurs during CO2 absorption in aqueous solution of MEA are represented in eqn (4)–(8).Amine protonation:
| MEA + H+ ↔ MEAH+ | (4) |
Carbamate hydrolysis:
| MEACOO− + H2O ↔ MEA + HCO3− | (5) |
Carbon dioxide first ionization:
| CO2 + H2O ↔ HCO3− + H+ | (6) |
Water dissociation:
| H2O ↔ H+ + OH− | (7) |
Carbon dioxide second ionization:
| HCO3− ↔ CO32− + H+ | (8) |
In addition, the carbonated aqueous amine system is also subject to amine and carbon mass balances constraints as well as electroneutrality as presented in eqn (9)–(11).
Amine balance:
| mMEA,0 = mMEAH+ + mMEACOO− + mMEA | (9) |
Carbon balance:
| αmMEA,0= mMEACOO− + mHCO3− + mCO32− + mCO2 | (10) |
Electroneutrality:
| mMEAH+ + mH+ = mMEACOO− + mHCO3− + 2mCO32− + mOH− | (11) |
Aqueous phase nonideality
Non idealities of the CO2–MEA–H2O system are taken into considerations in long-range electrostatic interactions and short-range van der Waals interactions between different ionic and molecular species in liquid phase. These interactions are represented by activity coefficients. The equilibrium constants, K for the independent reactions (eqn (3)–(7)) are related to concentrations of species, activity coefficients, γ and activity of water, aW as expressed in eqn (12)–(16).| K1 = mMEAmH+γMEAγH+/(mMEAH+γMEAH+) | (12) |
| K2 = mMEAmHCO3−γMEAγHCO3−/(mMEACOO−γMEACOO−) | (13) |
| K3 = mHCO3−mH+γHCO3−γH+/(mCO2γCO2aw) | (14) |
| K4 = mCO32−mH+γCO32−γH+/(mHCO3−γHCO3−) | (15) |
| K5 = mOH−mH+γOH−γH+/aw | (16) |
For ionic and molecular species, the reference state selected is a hypothetical ideal solution. Activity coefficient of the species is unity in an infinitely dilute aqueous solution. The standard state for solvent is defined as that of pure water at the system pressure and temperature. Equilibrium constants are correlated with temperature, T in the form as given in eqn (17).
ln![[thin space (1/6-em)]](https://www.rsc.org/images/entities/char_2009.gif) K = a + b/T + c K = a + b/T + c![[thin space (1/6-em)]](https://www.rsc.org/images/entities/char_2009.gif) ln ln![[thin space (1/6-em)]](https://www.rsc.org/images/entities/char_2009.gif) T T
| (17) |
Values for parameters a, b and c taken from literature are summarized in Table 2. Equilibrium constants (K1 to K5) are based on molality scale. Activity of water is equal to its mole fraction. The extended Debye–Hückel expression as given in eqn (18) is used to calculate activity coefficients of all solute species. The expression is originally proposed by Guggenheim and Stokes (1958) for electrolyte solutions.26
 | (18) |
The long-range electrostatic forces between ionic species are taken into account by the first term, while the short-range van der Waals interactions between molecular and ionic species in the aqueous phase are taken into account by the second term in eqn (18). The Debye–Hückel proportionality factor, A and the parameter B are a function of dielectric constant of solvent (water), ε and temperature. Dielectric constant can be calculated according to eqn (19).27,28
| ε = 80 − 0.4(T − 293) | (19) |
The ionic strength of the solution, I, is defined as in eqn (20).
 | (20) |
| βij = aij + bijT | (21) |
There are 10 species present in the ternary system of CO2–MEA–H2O system. Taking into account interaction for all molecule–molecule binary, ion–ion binary and molecule-ion binary may results in overabundant and unnecessary adjustable parameters. The number of interaction parameter can be reduced to seven based on results of sensitivity analysis.24 aij and bij coefficients for the selected ions or molecules binary interactions are presented in Table 3.
| Species interaction (kg mol−1) | Coefficient for eqn 22 | |
|---|---|---|
| aij (kg mol−1) | bij (kg (K−1 mol−1)) | |
| CO2–MEA | −0.171 | 2.086 × 10⁻⁴ |
| CO2–MEAH+ | −1.001 | 3.209 × 10⁻³ |
| CO2–CO32− | 0.489 | — |
| MEA–CO32− | −0.202 | — |
| MEAH+–HCO3− | −0.192 | 4.140 × 10⁻⁴ |
| MEAH+–CO32− | −0.328 | — |
| MEACOO−–HCO3− | −0.154 | — |
Physical solubility
Physical solubility of acid gas in solvent at equilibrium state can be expressed by Henry's law. Henry's law constant of CO2 in aqueous MEA is temperature dependant and can be found in literature.25 Henry's constant (kg kPa mol−1) was estimated using eqn (22).
HCO2 = 94.4914 + 6789.04/T −11.4519![[thin space (1/6-em)]](https://www.rsc.org/images/entities/char_2009.gif) ln ln![[thin space (1/6-em)]](https://www.rsc.org/images/entities/char_2009.gif) T + 0.01045T T + 0.01045T
| (22) |
Equilibrium, mass balance and electroneutrality equations are required to be solved simultaneously for the calculation of CO2 loading and concentration of individual chemical species. The nonlinear equations were solved using Levenberg Marquardt algorithm with numerical computing software, Matlab R2013a.
Results and discussion
CO2 solubility
Measurements of equilibrium solubility of CO2 in aqueous MEA solutions were carried out at 303.15, 313.15 and 323.15 K with pressure varied from 1 to 50 bar. MEA mass percent in unloaded solution from 10 to 30% was tested. Spectra of aqueous MEA at different CO2 loadings are given in Fig. 1. Characteristic Raman peak of major species, namely MEA (2930 cm−1), MEAH+ (2975 cm−1), MEACOO− (1155 cm−1), HCO3− (1015 cm−1), CO32− (1066 cm−1) and molecular CO2 (1380 cm−1) are indicated in the figure. Comprehensive vibrational assignment of all peaks in the range of interest can be found in previous work.8 CO2 equilibrium solubility for 10% MEA solution obtained using Raman method were compared with gas phase analysis based on CO2 pressure drop. Mean squared error (MSE) was computed and presented along with loading data in Table 4. Gas used in all experiments was 100% CO2, hence pressure in Table 4 corresponds to total pressure of CO2. Liquid and gas phase measurements are in good agreement with average MSE of 0.0025.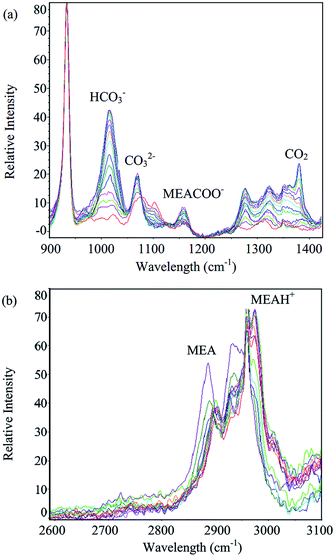 | ||
| Fig. 1 Spectra of aqueous MEA at different CO2 loadings for (a) 900–1400 cm−1 range and (b) 2600–3100 cm−1 range. | ||
| T (K) | P (bar) | CO2 loading | MSE | |
|---|---|---|---|---|
| Pressure drop | Raman | (×10−2) | ||
| 303.15 | 1.0 | 0.751 | 0.754 | 0.00 |
| 2.3 | 0.823 | 0.832 | 0.01 | |
| 3.0 | 0.883 | 0.888 | 0.00 | |
| 6.1 | 1.043 | 1.012 | 0.10 | |
| 10.0 | 1.157 | 1.161 | 0.00 | |
| 19.8 | 1.219 | 1.219 | 0.00 | |
| 30.0 | 1.342 | 1.424 | 0.67 | |
| 40.1 | 1.465 | 1.517 | 0.28 | |
| 50.3 | 1.504 | 1.621 | 1.36 | |
| 313.15 | 1.0 | 0.706 | 0.693 | 0.01 |
| 2.2 | 0.812 | 0.794 | 0.03 | |
| 3.2 | 0.888 | 0.859 | 0.08 | |
| 6.0 | 1.029 | 0.914 | 1.33 | |
| 9.3 | 1.042 | 1.019 | 0.05 | |
| 20.0 | 1.204 | 1.157 | 0.22 | |
| 30.0 | 1.304 | 1.339 | 0.13 | |
| 40.0 | 1.347 | 1.435 | 0.79 | |
| 50.0 | 1.491 | 1.539 | 0.23 | |
| 323.15 | 1.0 | 0.684 | 0.639 | 0.20 |
| 2.0 | 0.769 | 0.742 | 0.08 | |
| 3.2 | 0.809 | 0.794 | 0.02 | |
| 6.0 | 0.986 | 0.900 | 0.74 | |
| 10.1 | 1.038 | 0.941 | 0.93 | |
| 20.1 | 1.102 | 1.025 | 0.58 | |
| 30.0 | 1.162 | 1.085 | 0.60 | |
| 40.0 | 1.210 | 1.155 | 0.30 | |
| 50.0 | 1.293 | 1.255 | 0.14 | |
Fig. 2 depicts comparison between CO2 solubility in 20% MEA solution obtained from Raman experiments and modeling results. It can be seen that the model estimation is in good agreement with CO2 loading measured using Raman method over the temperature range considered. Pressure of CO2 over aqueous MEA of various concentrations at a fixed temperature is presented in Fig. 3. It is noted that CO2 is less soluble with increasing MEA concentration. This observation is consistent with behavior of CO2–amine–water ternary system. Fig. 4 illustrates the overall comparison of equilibrium solubility data reported in this work and values correlated from Deshmukh–Mather model. The model satisfactorily correlates experimental loadings with an overall Average Absolute Deviation (AAD) of 5.08%. As shown in the parity plot, all 81 data points fall within 20% AAD. Deviation is more apparent at higher loadings where model tends to overpredict absorption capacity at elevated pressure conditions.
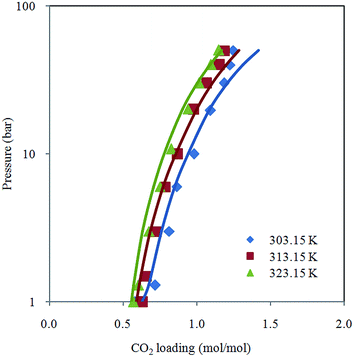 | ||
| Fig. 2 CO2 loading in 20% aqueous MEA from 1 to 50 bar at different temperatures (303.15 K, 313.15 K and 323.15 K) with model prediction. | ||
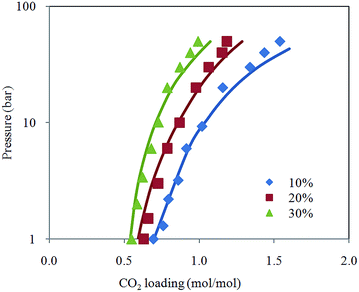 | ||
| Fig. 3 CO2 loading in aqueous MEA at various concentrations for pressure from 1 to 50 bar and temperature at 313.15 K with model prediction. | ||
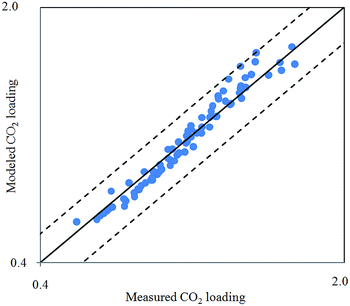 | ||
| Fig. 4 Parity plot of CO2 solubility in aqueous MEA from 303.15 K to 323.15 K obtained from Raman measurement and Deshmukh–Mather model. | ||
Chemical species distribution
Raman quantification method is applied to examine liquid phase speciation during CO2 absorption in aqueous MEA up to 50 bar. Fig. 5 shows distribution of MEA, MEAH+, MEACOO−, HCO3−, CO32− and molecular CO2 molalities at 313.15 K as a function of CO2 loading with Deshmukh–Mather model prediction. Equilibrium species profile of CO2 loaded 20% aqueous MEA demonstrates a typical behavior of CO2 in primary alkanolamine solution. Trend of species molality change is found to be consistent with modeled values. Primary alkanolamines are known to have solubility of 0.5 mol of CO2 per mole of amine stoichiometrically. Results of CO2 solubility experiment in this work shows loading higher than 0.5 because CO2 reacts with water or hydroxide ions to form carbonic acid and bicarbonate. Besides, carbamate hydrolyzes to generate bicarbonate and MEA which enable more CO2 to be absorbed. Decomposition of carbamate into bicarbonate is evident after equilibrium loading exceeds 0.5, where molality of carbamate decreases while a sharp rise of bicarbonate is observed. In addition, at high pressure condition, physical absorption contributes significantly to overall CO2 loading as CO2 bind physically to the aqueous solution.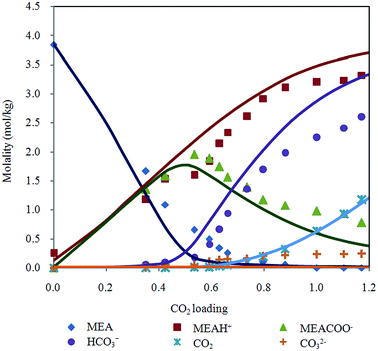 | ||
| Fig. 5 Chemical speciation according to CO2 loading in 20% MEA aqueous solution at 313.15 K with Deshmukh–Mather model predictions. | ||
Deshmukh–Mather model gives acceptable representation of experimental data on speciation of CO2 in MEA solution by Raman spectroscopy. Difference between predicted and experimental molalities observed for bicarbonate, MEAH+, carbamate at high loading could be due to over approximation of forward reaction of carbamate deformation (eqn (5)). The increased of MEACOO− molality results in higher MEAH+ and HCO3− molalities modeled. Physical solubility was calculated in the model based on Henry's law (eqn (22)) for unloaded aqueous MEA. However, solubility behavior of gas may deviate from linear dependence of pressure on Henry's constant as depicted in eqn (23) when MEA solution is loaded with CO2.
| P = mCO2HCO2 | (23) |
Difference of CO2 molality values obtained from experiment and model could be due to change of property of MEA solution as more CO2 is chemically absorbed in the solution.
In addition, liquid phase mole fraction of the major components determined by Raman spectroscopy in 30% MEA solution at 313.15 K (Fig. 6) is compared to speciation result of refined electrolyte NRTL (e-NRTL) and extended UNIQUAC models. These two models are based on excess free Gibbs energy, which are known to be thermodynamically rigorous.
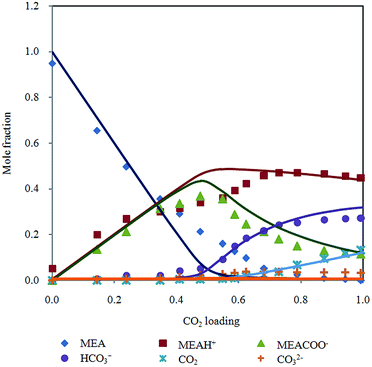 | ||
| Fig. 6 Chemical speciation in mole fraction according to CO2 loading in 30% MEA aqueous solution at 313.15 K with Deshmukh–Mather model predictions. | ||
Extended UNIQUAC model was implemented by Faramarzi et al.19 for CO2 in aqueous alkanolamine. Debye–Huckel term was added to the original non electrolyte UNIQUAC equation introduced by Abrams and Prausnitz29 to account for electrostatic interactions. Equilibrium species distribution reported generally follows the trend obtained from Raman spectra but magnitude of mole fraction deviates significantly. Notable discrepancies are over prediction of bicarbonate, underestimation of carbamate and CO2 in higher loading region as well as substantial amount of unreacted MEA past half molar. Besides, the analysis did not include CO32− as main component in the reactive system. Aronu et al.30 incorporated correlation based on experimentally determined physical solubility of CO2 in loaded MEA. Carbonate molality was underestimated and rapid consumption of MEA above CO2 loading 0.6 does not agree with experimental speciation data. Overall, the model adequately describes aqueous phase speciation.
Fair comparison cannot be performed with e-NRTL model because of different temperature condition (293 K) employed by Zhang et al.31 Besides, concentration of molecular CO2 in aqueous phase was neglected, meanwhile CO2 shows significant contribution in solubility of CO2 in MEA solution in current study. Utilization of NMR speciation measurements in regression analysis of e-NRTL model by Hilliard32 may yield improved liquid phase composition. However, molalities of MEA and MEAH+ were combined, while CO2, CO32− and HCO3− were lumped in his speciation diagram. Presentation of species evolution in both works does not allow direct comparison of individual species.
Bollas et al.33 indicated that e-NRTL model is inconsistent for systems with multiple cations and/or anions, therefore refined e-NRTL was applied to model equilibrium behavior of CO2–MEA–H2O system.34 Pitzer–Debye–Huckel and Born terms were added to the original e-NRTL model to account for long range coulombic interactions and chemical potential change, respectively. Model predictions of mole fraction distribution is close to results presented by Aronu et al.30 despite the different thermodynamic frameworks used. This model gives higher mol fraction of CO32− compared to extended UNIQUAC, which is a better approximation to values measured by Raman.
Model prediction by Aronu et al.30 and Hessen et al.34 demonstrate good representation of chemical speciation determined by Raman spectroscopy. The drawback of these models is complexity of activity coefficient expressions which is tedious to compute. Both approaches require regression of a considerable quantity of interaction parameters using a large experimental database (16 for refined e-NRTL and 13 for extended UNIQUAC). Accuracy of model relies heavily on choice of experimental data and literature parameters for regression.
Kent–Eisenberg correlation is widely used for prediction of vapor liquid equilibrium CO2–amine–water systems. However, most studies emphasize on CO2 loading or partial pressure modeling and no speciation data has been reported.35–37 This may be because of the incapability of this model to simulate aqueous phase composition due to the simplicity of the thermodynamic framework, which all activity coefficients and fugacity are assumed to be unity.
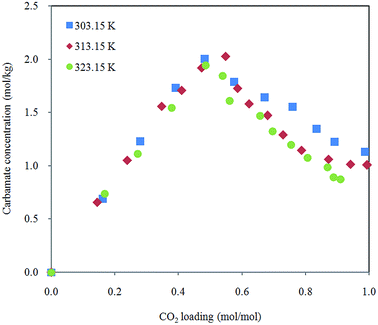
Effect of temperature on carbamate formation and dissociation is demonstrated in Fig. 7. Distribution of carbamate during CO2 absorption in 30% aqueous MEA is not affected in the scope of temperature in this study. Growth of carbamate reaches maximum around half molar (CO2 loading between 0.5 and 0.6 mol mol−1) and then decreases with increased CO2 dissolved in the solution. Marginally lower amount of carbamate ions were detected when temperature is raised. This observation is in agreement with speciation data obtained by NMR spectroscopy.38,39
Conclusions
Chemical speciation of CO2 in aqueous solution of MEA across a range of pressures from 1 to 50 bar was investigated and reported in this work. Absorption capacity of aqueous MEA in high pressure conditions was determined using in situ Raman spectroscopy based on total carbon containing species in liquid phase, which includes carbamate, bicarbonate, carbonate and molecular CO2. Aqueous phase Raman analysis provides direct evidence of the role of carbamate dissociation and physical absorption which contribute to higher equilibrium loading in MEA solution as compared to stoichiometric coefficient of primary amine reaction with CO2. Deshmukh–Mather model was applied to represent vapor liquid equilibrium behavior of CO2 absorption in aqueous MEA. The model represents well the measured CO2 loading at temperature ranging from 303.15 to 323.15 K and amine concentration varying from 10 to 30%. The Raman spectroscopic method is capable of providing in-depth knowledge of vapor liquid equilibrium during CO2 separation process by absorption in aqueous amine solution. Findings from this study are useful to facilitate development of new tool for in situ analysis of ionic and molecular species in high pressure gas sweetening system.References
- S. D. Kenarsari, D. Yang, G. Jiang, S. Zhang, J. Wang, A. G. Russell, Q. Wei and M. Fan, RSC Adv., 2013, 3, 22739–22773 RSC.
- R. Rivera-Tinoco and C. Bouallou, J. Cleaner Prod., 2010, 18, 875–880 CrossRef CAS.
- Z.-Y. Yang, A. N. Soriano, A. R. Caparanga and M.-H. Li, J. Chem. Thermodyn., 2010, 42, 659–665 CrossRef CAS.
- M. J. Pelletier, Appl. Spectrosc., 2003, 57, 20A–42A CrossRef CAS PubMed.
- H. Jilvero, K.-J. Jens, F. Normann, K. Andersson, M. Halstensen, D. Eimer and F. Johnsson, Fluid Phase Equilib., 2015, 385, 237–247 CrossRef CAS.
- P. Beumers, T. Brands, H.-J. Koss and A. Bardow, Fluid Phase Equilib., 2016 DOI:org/10.1016/j.fluid.2015.10.004.
- N. Wen and M. H. Brooker, J. Phys. Chem., 1995, 99, 359–368 CrossRef CAS.
- M. K. Wong, M. A. Bustam and A. M. Shariff, Int. J. Greenhouse Gas Control, 2015, 39, 139–147 CrossRef CAS.
- P. Danckwerts and K. McNeil, Trans. Inst. Chem. Eng., 1967, 45, T32 CAS.
- R. L. Kent and B. Eisenberg, Hydrocarbon Process., 1976, 55, 87–90 CAS.
- A. Chakma and A. Meisen, Gas Sep. Purif., 1990, 4, 37–40 CrossRef CAS.
- M. Z. Haji-Sulaiman, M. K. Aroua and A. Benamor, Chem. Eng. Res. Des., 1998, 76, 961–968 CrossRef CAS.
- A. Benamor and M. K. Aroua, Fluid Phase Equilib., 2005, 231, 150–162 CrossRef CAS.
- R. D. Deshmukh and A. E. Mather, Chem. Eng. Sci., 1981, 36, 355–362 CrossRef CAS.
- C.-C. Chen and L. B. Evans, AIChE J., 1986, 32, 444–454 CrossRef CAS.
- D. M. Austgen, G. T. Rochelle, X. Peng and C. C. Chen, Ind. Eng. Chem. Res., 1989, 28, 1060–1073 CrossRef CAS.
- M. L. Posey, Thermodynamics Model for Acid Gas Loaded Aqueous Alkanolamine Solutions, Universiti of Texas, Austin, 1996 Search PubMed.
- K. Thomsen and P. Rasmussen, Chem. Eng. Sci., 1999, 54, 1787–1802 CrossRef CAS.
- L. Faramarzi, G. Kontogeorgis, K. Thomsen and E. H. Stenby, Fluid Phase Equilib., 2009, 282, 121–132 CrossRef CAS.
- W. Fürst and H. Renon, AIChE J., 1993, 39, 335–343 CrossRef.
- G. Vallée, P. Mougin, S. Jullian and W. Fürst, Ind. Eng. Chem. Res., 1999, 38, 3473–3480 CrossRef.
- L. Chunxi and W. Fürst, Chem. Eng. Sci., 2000, 55, 2975–2988 CrossRef CAS.
- R. H. Weiland, T. Chakravarty and A. E. Mather, Ind. Eng. Chem. Res., 1993, 32, 1419–1430 CrossRef CAS.
- D. Tong, J. P. M. Trusler, G. C. Maitland, J. Gibbins and P. S. Fennell, Int. J. Greenhouse Gas Control, 2012, 6, 37–47 CrossRef CAS.
- T. J. Edwards, G. Maurer, J. Newman and J. M. Prausnitz, AIChE J., 1978, 24, 966–976 CrossRef CAS.
- E. A. Guggenheim and R. H. Stokes, Trans. Faraday Soc., 1958, 54, 1646–1649 RSC.
- A. F. Portugal, J. M. Sousa, F. D. Magalhães and A. Mendes, Chem. Eng. Sci., 2009, 64, 1993–2002 CrossRef CAS.
- A. E. Knowlton and R. M. Shoop, Standard Handbook for Electrical Engineers, McGraw-Hill Book Co., New York, London, 7th edn, 1941 Search PubMed.
- D. S. Abrams and J. M. Prausnitz, AIChE J., 1975, 21, 116–128 CrossRef CAS.
- U. E. Aronu, S. Gondal, E. T. Hessen, T. Haug-Warberg, A. Hartono, K. A. Hoff and H. F. Svendsen, Chem. Eng. Sci., 2011, 66, 6393–6406 CrossRef CAS.
- Y. Zhang, H. Que and C.-C. Chen, Fluid Phase Equilib., 2011, 311, 67–75 CrossRef CAS.
- M. D. Hilliard, 3321102 Ph.D., The University of Texas at Austin, 2008.
- G. M. Bollas, C. C. Chen and P. I. Barton, AIChE J., 2008, 54, 1608–1624 CrossRef CAS.
- E. T. Hessen, T. Haug-Warberg and H. F. Svendsen, Chem. Eng. Sci., 2010, 65, 3638–3648 CrossRef CAS.
- M.-H. Li and K.-P. Shen, Fluid Phase Equilib., 1993, 85, 129–140 CrossRef CAS.
- J. I. Lee, F. D. Otto and A. E. Mather, J. Appl. Chem. Biotechnol., 1976, 26, 541–549 CAS.
- S. H. Park, K. B. Lee, J. C. Hyun and S. H. Kim, Ind. Eng. Chem. Res., 2002, 41, 1658–1665 CrossRef CAS.
- W. Böttinger, M. Maiwald and H. Hasse, Fluid Phase Equilib., 2008, 263, 131–143 CrossRef.
- A. F. Ciftja, A. Hartono and H. F. Svendsen, Chem. Eng. Sci., 2014, 107, 317–327 CrossRef CAS.
Footnote |
| † Electronic supplementary information (ESI) available. See DOI: 10.1039/c5ra22926j |
| This journal is © The Royal Society of Chemistry 2016 |

