Exploring the critical dependence of the adsorption of various dyes on the degradation rate using a ferrihydrite surface under visible light
Shan Liuab,
Chunyan Niab,
Hui Suab,
Hui Liu*ab,
Rufen Chenab,
Ping Liab and
Yu Wei*ab
aCollege of Chemistry and Material Science, Hebei Normal University, Shijiazhuang, 050024, China. E-mail: liuhuicn@126.com; weiyu@mail.hebtu.edu.cn; Tel: +86-311-80787433
bKey Laboratory of Inorganic Nanomaterial of Hebei Province, Shijiazhuang, 050024, China
First published on 21st March 2016
Abstract
The adsorption and degradation of Mordant Yellow 10 (MY10), Eriochrome Black T (EBT) and Phenol Red (PR) in a ferrihydrite (Fh)/H2O2/visible light system were investigated. The affinity of Fh to the three dyes was evaluated based on the Langmuir model parameters, dimensionless separation factor RL, and adsorption–desorption isotherms. The effects of the affinity between the dyes and Fh on the degradation rate of the dyes were studied. The results show that the saturated adsorption capacities of the three dyes on Fh were 206.61, 126.26, and 73.26 mg g−1 for EBT, MY10, and PR, respectively. The degradation rate of EBT was much larger than those of MY10 and PR, but the difference between the degradation rates of MY10 and PR were small. The affinity between the dyes and Fh followed the order of MY10 ≫ EBT > PR. Both strong and weak affinities between the dyes and Fh were unfavorable for their degradation. Only moderate affinity allowed the adsorption–degradation–desorption process of dyes to occur continuously, which resulted in a high degradation rate. When NaNO3 solution was added into the MY10 system, the affinity between MY10 and Fh weakened, and the degradation rate of MY10 increased.
1. Introduction
Advanced oxidation technologies (AOTs) have been broadly applied for the elimination of recalcitrant pollutants during the past two decades.1–3 AOTs are based on the generation of a powerful oxidant, the hydroxyl radical (˙OH), which can react with most organic pollutants and then degrade them.4,5 The Fenton-like process using iron oxides as catalysts is one of the most widely used AOTs based on their easy handling, relatively low cost, nontoxicity, and environmentally friendly properties.6 Various organic compounds, such as industrial dyes, phenolics, and other environmentally harmful aromatic compounds, can be successfully oxidized and degraded by hydrogen peroxide promoted by iron oxides.7–10 The degradation rate of these pollutants is related to the species and crystallinity of iron oxides, as well as some environmental factors, such as pH, dose of catalyst, temperature and H2O2 concentration etc.11,12Our group has explored the transformation mechanism of ferrihydrite (Fh) in solution and its application in environmental field. To investigate the effect of formation environment of Fh on its properties, the three different procedures were used to prepare Fh (marked as Fh-1 Fh-2 and Fh-3, respectively).13–15 Fh-1 was prepared by using the procedure reported by Cornell and Schwertmann,16 in which alkaline solution was added into Fe3+ solution to adjust pH to 7. In this process, the formation of Fh went through a pH change from acidic to neutral. Fh-2 was prepared by adding Fe3+ solution into alkaline solution until pH 7 and in this process the formation of Fh went through a pH change from alkaline to neutral. Fh-3 was prepared by adding alkaline solution and Fe3+ solution simultaneously into a certain amount of water until Fe3+ solution was exhausted. The rate of addition of the two solutions was controlled via peristaltic pump by maintaining pH 7 with an accuracy of better than 0.5 pH units. The results revealed that the difference of three Fhs in their microstructure results in their various physico-chemical properties. One typical example is that Fh-3 exhibits a high adsorption capacity but a low degradation rate for MY10.15 The fitted data by Langmuir adsorption model reveals that the affinity between MY10 and Fh-3 is the largest, suggesting that the magnitude of adsorption affinity between pollutants and adsorbents has an important influence on their degradation rate.
In this work, the Fh prepared by the third procedure described above was used as a adsorbent or catalyst and three dyes with different structures (MY 10, EBT, and PR) as model pollutants. Their adsorption behavior and degradation rate on Fh under the same conditions were investigated. The effect of the adsorption affinity between the three dyes and Fh on their degradation rate was evaluated.
2. Experimental
2.1. Materials
Fe(NO3)3·9H2O, NaOH of analytical purity and distilled water were used. The ferric salt solutions were filtered through a 0.22 μm Millipore filter to remove any particulate contaminants. MY10, EBT and PR were of guaranteed reagent grade and H2O2 was of analytical reagent grade. They were used without further purification.2.2. Preparation and characterization of sample
Fh was prepared following the procedure reported in ref. 13 and 14 NaOH solution (3.0 mol L−1) and 100 mL of 1.0 mol L−1 Fe3+ solution were added simultaneously into 50 mL of water until Fe3+ solution was exhausted. The rate of addition of the two solutions was controlled via peristaltic pump by maintaining pH 7 with an accuracy of better than 0.5 pH units. The above process was carried out under vigorous stirring at room temperature and the total volume was adjusted to 200 mL. The gels were collected, thoroughly washed with deionized water and dried at about 70–80 °C.High-resolution transmission electron microscopy (HRTEM) image and SAED pattern were obtained using a JEOL 2010 microscope operating at 200 kV. X-ray diffraction (XRD) measurement was carried out at room temperature using a D8ADVANCE diffractometer with Cu Kα radiation (λ = 0.15418 nm). The Brunauer–Emmett–Teller (BET) specific surface area was measured using a Micromeritics ASAP 2020 apparatus.
The point of zero charge of the samples was determined by the solid addition method.17 A 25 mL 0.01 mol L−1 KNO3 solution was added to a series of centrifuge tubes. The solution's pH values were roughly adjusted from 3.0 to 12.0 by adding either 0.1 mol L−1 HNO3 or NaOH. The total volume of the solution in each tube was made exactly to 30 mL by adding the KNO3 solution (0.01 mol L−1). The solutions' initial pH values (pH0) were accurately noted. Then, 0.1 g of the sample was added to each tube, which was securely capped immediately. The suspensions were then shaken and allowed to equilibrate for 24 h. The pH values of the supernatant liquid (pHe) were noted. The difference between the initial and final pH values (ΔpH = pH0 − pHe) was plotted against the pH0. The point of intersection of the resulting curve with abscissa, at which pH = 0, gave the pHpzc. The procedure was repeated for the 0.1 mol L−1 KNO3 solution.
2.3. Photochemical experiment
Photochemical experiments were carried out with a photocatalytic reactor system. The bench-scale system is a cylindrical Pyrex-glass cell with 0.5 L capacity. Irradiation experiments were performed using visible light lamp (λ ≥ 420 nm). The reaction was carried out at 25 °C under the condition of 0.1 g L−1 of the solid catalyst in 200 mL solution of MY10, EBT or PR dye (60 ppm). A dilute HNO3 and NaOH solutions were used to adjust the pH of the reaction systems to 3.Prior to irradiation, the suspension was magnetically stirred in the dark for 60 min to establish the adsorption/desorption equilibrium between dye and catalyst. H2O2 was added to the reaction vessel at the beginning of the irradiation, and the concentration of H2O2 in reaction system is 5 mmol L−1. At given irradiation time intervals, about 8 mL suspensions were sampled and centrifuged. The concentration of dye in the supernatant was analyzed by UV-vis spectrophotometer (UV-vis 752 Dongxing, Hangzhou) at the wavelength of maximum absorption (354 nm for MY10, 526 nm for EBT and 432 nm for PR) of the dye. Total organic carbon (TOC) was measured by Shimadzu TOC-V CPH total organic carbon analyzer.
2.4. Absorption–desorption experiments
The sorption of the pollutants on as-prepared samples was investigated by using batch technique in polyethylene tubes sealed with screw-cap. 0.0150 g of each sample was added into six tubes. Then, a given amount of dye stock solution was added in turn into the reaction system. At the same time, the total volume of the system was adjusted to 30 mL and the pH of each system was adjusted to 3 by adding HNO3 or NaOH solution. The system was shaken at 300 rpm using a thermostatic shaker at 298.15 K for 5 h. The suspensions were centrifuged and the supernatant was analyzed for dye concentration by UV-vis spectrophotometer.The adsorption capacity of samples was calculated through eqn (1)
| qe = (c0 − ce)V/m | (1) |
The experiment of desorption for the dye adsorbed was conducted based on the method described by Yang et al.18 Briefly, desorption processes were conducted by removing 25 mL of the supernatant solution after centrifugation, then topping this up to the original volume with DI water. The preparation was maintained with shaking for 12 h and pH was adjusted to 3 thrice during this equilibrium time. After that, the solution was centrifuged and the amount of dye in the supernatant solution was measured. When calculating the amount of dye desorbed, the amount of dye in the residual (5 mL) volume should be deducted. A second round of desorption was carried out using the same procedure to complete a two-step desorption.
The structures of MY10, EBT, and PR are shown in Fig. 1.
3. Results and discussion
Fig. 2 presents XRD pattern, HRTEM image, SAED pattern and pHpzc of sample. XRD pattern of sample (Fig. 2a) confirms that the as-prepared powder is a pure phase of 2-line Fh. From Fig. 2b, it can be seen that the as-prepared Fh particles are quasi-spherical. Most crystallites are 2 to 4 nm across and approximately equant. The crystallites at the edges of Fh aggregates display a single orientation of lattice fringes. Widely scattered areas that have distinct lattice fringes are surrounded by areas without recognizable fringes. SAED pattern has two bright rings, suggesting that crystalline of ferrihydrite is poor. The pHpzc value and BET specific surface area of Fh are 7.40 (Fig. 2c) and 256.52 m2 g−1, respectively.Fig. 3a shows that the adsorption rates of MY10, EBT, and PR on Fh changed with time. All three dyes established an adsorption/desorption equilibrium within 60 min. The equilibrium adsorption capacities of EBT (∼114.0 mg g−1) and MY10 (∼110.4 mg g−1) were highly similar, and both were larger than that of PR (∼59.04 mg g−1). The molecular structures of both MY10 and EBT show that they are azo dyes with the –SO3 group. The –SO3 group in the MY10 and EBT molecules exists mainly in anionic form in solution. The point of zero charge (pHpzc) of Fh was pH 7.4, indicating that the adsorption of both MY10 and EBT on Fh was favorable at pH 3. No anion groups exist in the PR structure, which was unfavorable for its adsorption on Fh at pH 3.
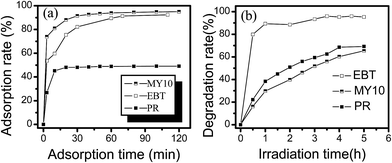 | ||
| Fig. 3 Adsorption rate (a) and degradation rate (b) of the three dyes vs. time (dose of Fh-3: 0.5 g L−1; pH = 3, cdye = 60 mg L−1). | ||
The degradation of the three dyes on Fh was observed at pH 3 under visible light irradiation, and the results are shown in Fig. 3b. In each degradation system, the same amount of H2O2 was added at a concentration of 5 mmol L−1. The Fh/dye dispersion was stirred in the dark for 60 min before visible light irradiation to ensure the establishment of an adsorption/desorption equilibrium. Of the three systems, the degradation rate of EBT was 95.3%, whereas the degradation rates of MY10 and PR were 65.4% and 69.2%, respectively. TOC analysis was performed to verify that these dyes did not simply lose their color (Fig. 4). TOC values reflect the amount of organic carbon in the solution, and therefore, the changes in TOC mirror the degree of degradation of an organic substrate. In Fig. 4, the degradation rate of EBT was consistent with that in Fig. 3, whereas the degradation rates of MY10 and PR were slightly lower, suggesting that an almost complete mineralization for EBT and partial mineralization for MY10 and PR occurred.
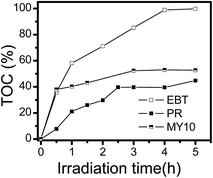 | ||
| Fig. 4 Changes in TOC during the degradation process in the presence of H2O2 (5 mmol L−1) and Fh-3 (0.5 g L−1) at pH 3. | ||
Both high adsorption capacity and degradation rate were observed in the EBT system, whereas a similar adsorption capacity but lower degradation rate was observed in the MY10 system. Neither the adsorption capacity nor the degradation rate of PR was very high. To further understand the results above, the equilibrium adsorption data of the three dyes at different initial concentrations were determined and fitted using Langmuir isotherm equations to confirm the above deduction (eqn (2)).
 | (2) |
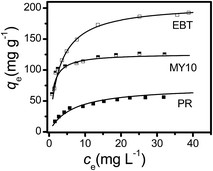 | ||
| Fig. 5 Adsorption isotherms of the three dyes on Fh-3 by plotting the equilibrium concentration (ce) vs. the adsorbed capacity of dyes (qe). Data are shown as symbols and fitting results as lines. | ||
| Sample | qm (mg g−1) | b (L mg−1) | R2 |
|---|---|---|---|
| EBT | 206.61 | 0.3467 | 0.9998 |
| MY10 | 126.26 | 1.1020 | 0.9957 |
| PR | 73.26 | 0.1563 | 0.9978 |
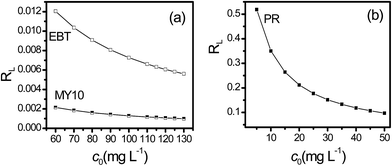
The Langmuir model could better describe the adsorption behavior of the three dyes on Fh based on their linear correlation coefficients. The maximum adsorption capacity, qm (mg g−1 Fh), followed the order of EBT ≫ MY10 ≫ PR. The b value of MY10 was much higher than those of EBT and PR, indicating that MY10 has greater affinity for Fh than the other two dyes. To further understand the differences in the adsorption property of Fh to the three dyes under different concentrations, the dimensionless separation factor RL (eqn (3)) was used to predict the affinity between the adsorbate and adsorbent, as well as adsorption reversibility.19
 | (3) |
The values of RL, classified as RL > 1, 0 < RL < 1 and RL = 0, suggests that adsorption is unfavorable, favorable and irreversible, respectively. The RL values of the three dyes obtained at different initial concentrations are shown in Fig. 6. RL of PR was higher than that of EBT and MY10, whereas RL of MY10 was very small and close to zero. These findings indicate that the adsorption of MY10 on Fh was more irreversible than that of EBT. The degree of reversibility for PR adsorption was the highest among the three dyes.
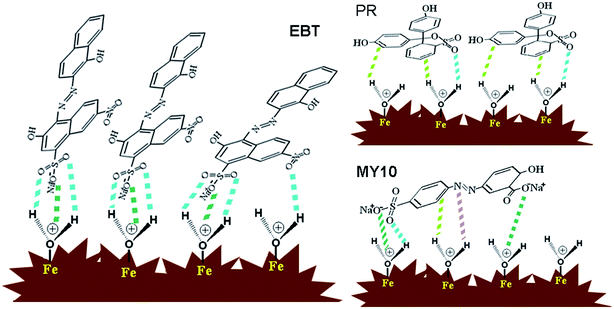
Based on molecule structure of the three dyes, pHpzc of Fh, fitting results of Langmuir model and RL values, the difference among the three dyes in their adsorption and degradation properties could be well explained. For convenience, a schematic of the adsorption model is shown in Fig. 7. (1) Fig. 2c shows that pHpzc of as-prepared sample is 7.4. The surface of Fh was positively charged when pH was less than 7.4. There are groups with negative charge (e.g. –SO3 and –COO−) both in MY10 and EBT molecules, which means that, compared with PR, the adsorption of the two pollutants on Fh is favorable at pH 3. From the molecule structure of the three dyes (Fig. 1), it can be inferred that there are two kinds of adsorption action between Fh and dyes. One is electrostatic force between Fh and the groups with negative charge. The other is hydrogen bonding between ![[triple bond, length as m-dash]](https://www.rsc.org/images/entities/char_e002.gif) FeIII–OH and aromatic rings, as well as nitrogen atoms and oxygen atoms.20,21 Because electrostatic attraction is much stronger than hydrogen bonding, both MY10 and EBT exhibit a higher adsorption capacity and larger affinity than PR. (2) Compared MY10 with EBT, although the –SO3 group is present in both two molecules, there is a –COO− group in MY10 structure. Moreover, the two negative charged groups are located at the both ends of MY10 molecule, which makes one adsorbed MY10 molecule occupy multiple sites. Thus, MY10 molecules are apt to be adsorbed laterally on the surface of Fh aggregate (Fig. 7). As for EBT molecule, there is only one negative charged group (–SO3) and the electrostatic force is stronger than hydrogen bonding. Thus, EBT molecules are apt to be adsorbed vertically (Fig. 7). The vertical adsorption model for EBT will occupy less sites, which leads to a large adsorption capacity. In addition, the two negative charged groups located at the both ends of MY10 molecule can form a very large π–π electron conjugated system with aromatic rings, which leads to a higher affinity between MY10 and Fh. PR molecules were adsorbed on Fh only by hydrogen bonding and hydrogen bonding easily occurs for a lateral PR molecule (Fig. 7). Both conditions lead to the low affinity and adsorption capacity of PR.
FeIII–OH and aromatic rings, as well as nitrogen atoms and oxygen atoms.20,21 Because electrostatic attraction is much stronger than hydrogen bonding, both MY10 and EBT exhibit a higher adsorption capacity and larger affinity than PR. (2) Compared MY10 with EBT, although the –SO3 group is present in both two molecules, there is a –COO− group in MY10 structure. Moreover, the two negative charged groups are located at the both ends of MY10 molecule, which makes one adsorbed MY10 molecule occupy multiple sites. Thus, MY10 molecules are apt to be adsorbed laterally on the surface of Fh aggregate (Fig. 7). As for EBT molecule, there is only one negative charged group (–SO3) and the electrostatic force is stronger than hydrogen bonding. Thus, EBT molecules are apt to be adsorbed vertically (Fig. 7). The vertical adsorption model for EBT will occupy less sites, which leads to a large adsorption capacity. In addition, the two negative charged groups located at the both ends of MY10 molecule can form a very large π–π electron conjugated system with aromatic rings, which leads to a higher affinity between MY10 and Fh. PR molecules were adsorbed on Fh only by hydrogen bonding and hydrogen bonding easily occurs for a lateral PR molecule (Fig. 7). Both conditions lead to the low affinity and adsorption capacity of PR.
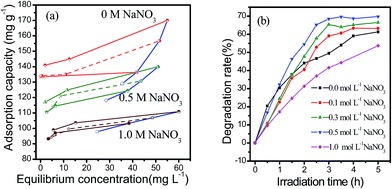
To further confirm the inference above, the adsorption/desorption isotherms of the three dyes were determined and the results were shown in Fig. 8. The desorption lines of MY10 and EBT did not coincide with the corresponding adsorption isotherms, indicating that the adsorption reactions were irreversible.19 However, the angles between adsorption and its corresponding desorption isotherms varied from dye to dye. Qin et al.22 hypothesized that this angle can be used to describe quantitatively the degree of adsorption hysteresis. The angle difference can be used to assess the basic trend in reversibility. A smaller angle indicates a more reversible adsorption, which indicates weak affinity between the pollutant and adsorbent. Of the three dyes, the angle in the PR system was clearly the smallest, which indicates that its degree of reversible adsorption was the highest. The affinity of Fh to PR was the weakest. Compared with PR and EBT, the largest angle in the MY10 system indicates that Fh could strongly bind to MY10. This conclusion was consistent with the aforementioned analysis.
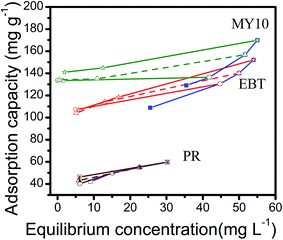 | ||
| Fig. 8 Adsorption–desorption isotherms of the three dyes (adsorption: blue lines; desorption: red, green and brown lines). | ||
Based on the data above, the effects of the adsorption affinity of a dye on its degradation can be understood. The heterogeneous catalytic degradation of pollutants usually experiences the following processes. (1) Adsorbate is adsorbed on the surface of the adsorbent. (2) When H2O2 and visible light are introduced into the reaction system, dye degradation by H2O2 promotion mainly occurs on the surface of iron oxide photocatalysts rather than in bulk solution.23 The effects of H2O2 in enhancing the photocatalytic performance of catalysts is ascribed to two aspects,7 namely, conduction electron scavenging and the Fenton-like reaction. When visible light illuminates iron oxides, charge carriers (e.g., electrons and holes) are generated. Two pathways may be used to annihilate the electrons. First, H2O2 directly traps electrons to form OH˙. Second, Fe3+ on the surface of iron oxides traps electrons to transform Fe2+, and Fe2+ reacts with H2O2 to form OH˙. Moreover, iron oxide can catalyze the decomposition of hydrogen peroxide to produce OH˙.24 These hydroxyl radicals can oxidize almost all organic substances because of their high oxidation potential. (3) After the degraded pollutant molecules leave the surface of Fh, pollutant molecules in the bulk solution are again adsorbed, which allows the adsorption–degradation–desorption process to occur continuously and more pollutant molecules to become degraded.
Higher affinity between MY10 and Fh enabled its adsorption on Fh to be more irreversible (Table 1, Fig. 6 and 8). Thus, the degraded MY10 molecules were not easily desorbed from the surface of Fh, which hindered the continuous occurrence of the adsorption–degradation–desorption process and led to low degradation efficiency (Fig. 3). The affinity between PR and Fh was so low that some adsorbed PR molecules desorbed from Fh before degradation. Compared with MY10 and PR, the affinity between EBT and Fh was neither very high nor very low, which allowed the adsorption–degradation–desorption process to occur continuously and more EBT molecules to be degraded.
The above results show that moderate affinity between pollutant and adsorbent was favorable for a high degradation rate. The ion strength of a system can affect the interaction between the adsorbate and adsorbent.20,25 Considering that MY10 molecules exist mainly in anionic form in solution, its adsorption on Fh should be influenced by the ion strength of the solution. We determined the adsorption–desorption isotherms and degradation rate of MY10 in the presence of different concentrations of NaNO3, and the results are shown in Fig. 9. Fig. 9a shows that the angles between adsorption and corresponding desorption isotherms decreased with the increase in NaNO3 concentration, suggesting that the affinity between MY10 and Fh decreased. It is probably because NO3− ions can screen the charged sites of the adsorbents, leading to a suppress of the electrostatic interactions.20 Fig. 9b shows that the degradation rate of MY10 initially increased and then decreased with the increase in NaNO3 concentration. When the NaNO3 concentration was 0.5 mol L−1, the degradation rate peaked. Therefore, when the degradation rate of a pollutant was hindered by high affinity between pollutant and adsorbate, its degradation rate could be enhanced by adding electrolytes into the reaction system.
4. Conclusions
In this study, we compared the adsorption and degradation of MY10, EBT, and PR in Fenton-like systems using Fh as a catalyst. The affinity of Fh to the three dyes was evaluated based on the Langmuir model parameters, dimensionless separation factor RL, and adsorption–desorption isotherms. The effect of the molecule structure of pollutants on their adsorption capacity, affinity, and degradation rate were investigated. The main conclusions are summarized as follows:(1) There exist two kinds of adsorption action – electrostatic interaction and hydrogen bonding – between Fh and MY10, EBT, or PR. The electrostatic attraction is much stronger than hydrogen bonding, which makes both MY10 and EBT exhibit a higher adsorption capacity and larger affinity than PR.
(2) MY10 molecules with two negative charged groups are apt to be adsorbed laterally, while EBT molecules one negative charged group are apt to be adsorbed vertically on the surface of Fh. The adsorption capacity of MY10 is less than that of EBT but the affinity of the former on Fh is higher than that of the latter.
(3) The affinity between Fh and the three dyes are ranked in the order MY10 ≫ EBT > PR. Under the same conditions, a moderate affinity for EBT results in a high degradation rate, while both large and little affinity are unfavorable for the degradation.
(4) With increasing ionic strength, some NO3− ions can screen the charged sites of the adsorbents, leading to a suppress of the electrostatic interactions and a decrease of the affinity between MY10 and Fh. The fact that the degradation rate of MY10 initially increased and then decreased with the increase in NaNO3 concentration indicates that a moderate affinity between pollutant and adsorbent is favorable for the degradation.
Acknowledgements
This work was supported by a grant from the Natural Science Foundation of China (21277040, 21477032, 21203052) and Hebei Province (B2012205041, B2013205069).References
- E. Brillas, I. Sires and M. A. Oturan, Chem. Rev., 2009, 109, 6570–6631 CrossRef CAS PubMed.
- S. Mohajeri, H. A. Aziz, M. H. Isa, M. A. Zahed and M. N. Adlan, J. Hazard. Mater., 2010, 176, 749–758 CrossRef CAS PubMed.
- L. C. Almeida, S. Garcia-Segura, N. Bocchi and E. Brillas, Appl. Catal., B, 2011, 103, 21–30 CrossRef CAS.
- S. Valizadeh, M. H. Rasoulifard and M. S. Dorraji, Appl. Surf. Sci., 2014, 319, 358–366 CrossRef CAS.
- M. J. Liou and M. L. Lu, J. Mol. Catal. A: Chem., 2007, 277, 155–163 CrossRef CAS.
- M. Hermanek, R. Zboril, I. Medrik, J. Pechousek and C. Gregor, J. Am. Chem. Soc., 2007, 129, 10929–10936 CrossRef CAS PubMed.
- X. M. Zhou, H. C. Yang, C. X. Wang, X. B. Mao, Y. S. Wang, Y. L. Yang and G. Liu, J. Phys. Chem. C, 2010, 114, 17051–17061 CAS.
- E. J. Shin, D. E. Miser, W. G. Chan and M. R. Hajaligol, Appl. Catal., B, 2005, 61, 79–89 CrossRef CAS.
- T. Dantas, V. P. Mendonca, H. J. Jose, A. E. Rodrigues and R. Moreira, Chem. Eng. J., 2006, 118, 77–82 CrossRef CAS.
- F. Moura, G. C. Oliveira, M. H. Araujo, J. D. Ardisson, W. Macedo and R. M. Lago, Appl. Catal., A, 2006, 307, 195–204 CrossRef CAS.
- C. S. Liu, F. B. Li, X. M. Li, G. Zhang and Y. Q. Kuang, J. Mol. Catal. A: Chem., 2006, 252, 40–48 CrossRef CAS.
- E. M. Rodriguez, G. Fernandez, P. M. Alvarez, R. Hernandez and F. J. Beltran, Appl. Catal., B, 2011, 102, 572–583 CrossRef CAS.
- H. Liu, P. Li, B. Lu, Y. Wei and Y. H. Sun, J. Solid State Chem., 2009, 182, 1767–1771 CrossRef CAS.
- H. Liu, Y. Wang, Y. Ma, Y. Wei and G. Q. Pan, Chemosphere, 2010, 79, 802–806 CrossRef CAS PubMed.
- H. Liu, X. L. Li, Y. Wang, X. Yang, Z. Zhen, R. F. Chen, D. L. Hou and Y. Wei, RSC Adv., 2014, 4, 11451–11458 RSC.
- R. M. Cornell and U. Schwertmann, The Iron Oxides, WILEY-VCH, New York, 2003 Search PubMed.
- V. C. Srivastava, I. D. Mall and I. M. Mishra, J. Hazard. Mater., 2006, 134, 257–267 CrossRef CAS PubMed.
- Y. H. Yang, H. Chen and G. Pan, J. Environ. Sci., 2007, 19, 1442–1445 CrossRef CAS.
- A. Bhatnagar and A. K. Jain, J. Colloid Interface Sci., 2005, 281, 49–55 CrossRef CAS PubMed.
- Y. Q. Hu, T. Guo, X. S. Ye, Q. Li, M. Guo, H. N. Liu and Z. J. Wu, Chem. Eng. J., 2013, 228, 392–397 CrossRef CAS.
- L. Abramian and H. El-Rassy, Chem. Eng. J., 2009, 150, 403–410 CrossRef CAS.
- Y. Qin, G. Pan, M. Zhang and X. Li, J. Environ. Sci., 2004, 16, 627–630 CAS.
- W. Du, Y. Xu and Y. Wang, Langmuir, 2008, 24, 175–181 CrossRef CAS PubMed.
- S. S. Lin and M. D. Gurol, Environ. Sci. Technol., 1998, 32, 1417–1423 CrossRef CAS.
- D. Xu, X. L. Tan, C. L. Chen and X. K. Wang, Appl. Clay Sci., 2008, 41, 37–46 CrossRef CAS.
| This journal is © The Royal Society of Chemistry 2016 |


