Designer porous antibacterial membranes derived from thermally induced phase separation of PS/PVME blends decorated with an electrospun nanofiber scaffold†
Priti Xavier,
Shubham Jain,
Vijay Srinivas T,
Kaushik Chatterjee and
Suryasarathi Bose *
*
Department of Materials Engineering, Indian Institute of Science, Bangalore-560012, India. E-mail: sbose@materials.iisc.ernet.in
First published on 14th January 2016
Abstract
We report the development of porous membranes by thermally induced phase separation of a PS/PVME (polystyrene/polyvinyl[methyl ether]) blend, which is a typical LCST mixture. The morphology of the membrane after etching out the PVME phase was characterized by scanning electron microscopy. To give the membrane an antibacterial surface, polystyrene (PS) and poly[vinyl(methyl ether)]-alt-maleic anhydride (PVME-MAH) with silver nanoparticles (nAg) were electrospun on the membrane surface. Pure water flux was evaluated by using a cross-flow membrane setup. The microgrooved fibers changed the flux across the membrane depending on the surface properties. The antibacterial properties of the membrane were confirmed by the reduction in the colony count of E. coli. The SEM images show the disruption of the bacterial cell membrane and the antibacterial mechanism was discussed.
Introduction
Membrane technology is widely used for separation processes in various industries such as food and beverages, metallurgy, pharmaceuticals, automotive, biotechnology, and domestic and industrial water treatment.1 Owing to their high throughput, energy efficiency and cheap fabrication, polymers have been used in designing membranes.2 Phase inversion,3,4 interfacial polymerization,5 layer-by-layer deposition,6 and thermally induced phase separation7,8 are some of the many techniques for preparing porous structures.In this paper, we used the thermally induced phase separation (TIPS) technique for designing porous membranes. Phase separation is a fundamental physical phenomena used to develop heterogeneous structures.9 The pattern evolution in these multicomponent mixtures is used to generate porous structures for applications like membranes for water filtration and gas separation, and also for separators in electrochemical cells and fuel cells. The homogeneous polymer blend solution produces heterogeneous structures upon thermal treatment. One of the components from the heterogeneous structure can be etched out to generate porous structures. A proper understanding of the thermodynamics of the component mixing in the heterogeneous structure is necessary to control the membrane morphologies.10 A porous PE film of was prepared by selectively etching out one of the phases from compatibilized binary blends of PE/PEO.11,12 The crystallization-induced phase separation in PVDF/PMMA has also been used to generate nanoporous structures by selectively etching the PMMA phase.13
A major problem with these membranes is biofilm formation on the membrane surface resulting from microbial adhesion and colonization. The growth of biofilms can be minimized by applying backpressure or by periodic washing with chemicals like sodium hypochlorite. Chemical treatments can alter the membrane, causing degradation over time.14 Microbial growth can be prevented by incorporating nanoparticles with biocidal properties. Common nanoparticles with antimicrobial properties include CNTs,15 silver nanoparticles (nAg),16 titanium dioxide (TiO2),17 and graphene oxide (GO).18 The antimicrobial mechanisms vary from physical disruption caused by the roughness of the particles, as seen in GO particles, through charge transfer leading to the formation of reactive oxygen species, to the destruction of the cell membrane by the formation of amine–phosphate complexes, as in particles bearing amine groups.
In this work, we produced microgrooved electrospun fibers on the surface of a porous membrane, which shows improved antibacterial properties. The surface morphologies, such as porous, wrinkled or microgrooved structures on the electrospun fibers, are formed by buckling instability during solvent evaporation. The surface architecture can decrease biofouling by changing the surface hydrophobicity.19 The additional electrospun fiber assembly can also act as a pre-filter, aiding the removal of microparticles and prolonging the lifetime of the membrane.20 The morphology of the electrospun fibers was modified by the solvent.21 Fibers with porous morphology or wrinkles are generated by the solubility differences of the various electrospinning solvents for the polymers. Silver nanoparticles, which have antimicrobial properties, were incorporated into PS and PS/PVME-MAH fibers and the bactericidal activity was assessed. Different polymers and nanoparticles have different mechanisms for preventing biofouling owing to the difference in the repulsive forces between the charged surface and co-ions.
Experimental section
Materials and methods
Polystyrene (PS; Mw 192 kDa, PDI of 2.0) was purchased from Sigma-Aldrich and poly[vinyl(methyl ether)] (PVME; 80 kDa, 30% aqueous solution) was obtained from Tokyo Chemical Industry Co., Ltd (Japan). Poly[vinyl(methyl ether)]-alt-maleic anhydride (Mw 216 kDa) was purchased from Sigma-Aldrich. PVP (polyvinylpyrrolidone) coated silver nanoparticles (Sigma-Aldrich) with a specific surface area of 5 m2 g−1 were used without further surface treatment. Commercial analytical grade solvents were used without further purification.Preparation of blends
Neat blends of PS/PVME 90/10 (w/w) were prepared by melt mixing at 170 °C for 20 min with a screw speed of 60 rpm by using an extruder (HAAKE Minilab II CTW5, 7 cm3). The samples were compression molded at 170 °C to form discs 25 mm in diameter. The samples were annealed until the PS-rich and PVME-rich phases separated, and then they were selectively etched with methanol for 24 h to remove the PVME phase.Electrospinning of polymer fibers
A needle-based electrospinning setup (ESPIN NANO) was used to prepare nanofiber mats on the as-prepared porous membranes. To optimize the electrospinning process, we varied the polymer concentration, solvent (DMF/THF/methanol) concentrations, solution feed rate, working distance, and voltage. During electrospinning, the flow rate was kept at 1 mL h−1 to produce uniform fibers. This flow rate was chosen because the electrospinning process at this flow rate is maintained stably regardless of the variation of the other parameters. The thickness of fiber mats was controlled by the electrospinning deposition time. The electrospinning was conducted at room temperature and the membranes with electrospun nanofiber mats were dried in a vacuum oven at 40 °C for 5 h to remove any traces of residual solvent.PS fibers containing 1 wt% silver nanoparticles and PS/PVME-MAH fibers containing 1 wt% silver nanoparticles were electrospun. 1 wt% nAg was placed in a glass vial and dispersed in the solvent for the polymer. The particles were probe sonicated for 20 min and bath sonicated for 30 min to ensure proper dispersion. The polymer was added to this solution and stirred for 4 h. The solution was loaded into a syringe at a speed of 1 mL h−1 through a 25G needle. A voltage of 15 kV was supplied to the solution at a syringe tip-to-plate collector distance of 15 cm for the PS and PS/PVME-MAH-nAg solutions. A voltage of 15 kV with a syringe tip-to-plate collector distance of 11 cm was used for the PVME-MAH solution. A voltage of 15 kV with a syringe tip-to-plate collector distance of 13 cm was used for the PS-nAg and PS/PVME-MAH solutions.
After the fiber morphology was optimized, fibers were collected on the porous membrane. The time for electrospinning was 15 min for each side of the membrane for all the samples to prepare fiber mats with a constant thickness. The membranes with the electrospun fibers were compression moulded at 70 °C, which is lower than the processing temperature, to fuse together the fibers on the membrane.
The rheological phase separation temperature of the LCST blend was determined by performing isochronal temperature sweep measurements of the sample by using a stress-controlled Discovery Hybrid Rheometer (DHR-3, TA Instruments). The evolution of morphology as a function of temperature was monitored by a polarized optical microscope (POM; BX51, Olympus, Japan) fitted with an automated hot stage (THMS600, Linkam). The samples were scanned at a heating rate of 1 K min−1 from 150 to 250 °C.
The pure water flux across the membranes was measured by using a custom-designed cross-flow cell. The membrane was loaded into the test cell and was passed through different pressures by using an HPLC pump. The volume of the permeate collected was measured to calculate the flux. Three replicates were measured for statistical analysis. The transmembrane flux (J) was calculated by
 | (1) |
The antibacterial properties of the polymeric membranes were analyzed by using a direct contact method. The porous membrane without the electrospun fibers was used as the control. Escherichia coli (E. coli) (ATCC 25922) bacteria was grown in sterile nutrient broth (100 mL, HiMedia) overnight at 150 rpm and 37 °C until the culture reached the exponential phase. The bacterial culture was adjusted to an optical density (OD) of 0.5 at 600 nm. Prior to seeding the bacterial cells, the membrane was sterilized with 70% ethanol. The plate was subsequently sterilized under UV for 30 min. A bacterial suspension (0.1 mL) with an OD600 of 0.5 was added to each well and was incubated for 1 h at 37 °C. After 1 h incubation, the bacterial suspension was removed and membranes were washed with 0.9% saline solution. The membranes were bath sonicated to remove the adhered E. coli in 0.9% saline solution (3.0 mL) for 3 min. Saline solution (0.1 mL) was spread on nutrient agar plates and they were incubated overnight at 37 °C to obtain a colony count. For each sample, three plates were used. For SEM analysis, the medium was removed from the wells, and then the bacterial cells on the membranes were fixed by using 3.7% formaldehyde for 20 min. The fixed bacterial cells were analyzed by SEM to study the membrane–bacteria interactions.
Inductively coupled plasma-optical emission spectroscopy (ICP-OES; iCAP 6000, Thermo Scientific) was performed to quantify the release of silver ions from the electrospun fibers. A replica of the membrane used for the bacterial culture was incubated in ultrapure water (1 mL) for 1 h. A standard curve was generated by serial dilution of a solution containing a known concentration of silver ions. Water from the membrane was collected after 1 h to quantify the amount of silver ions leached from the electrospun film into the water.
Results and discussion
Phase morphology and morphology evolution in the blend
Porous membranes were prepared by thermally induced phase separation. The membranes contained a multicomponent structure with controlled morphology and the minor component (PVME) was selectively etched with methanol. An in-depth understanding of the demixing mechanism is necessary for better control of the morphology of these structures. The global demixing in polymer blends can be measured by analyzing the dynamic elastic modulus (G′) and tan![[thin space (1/6-em)]](https://www.rsc.org/images/entities/char_2009.gif) δ as a function of temperature by low-amplitude oscillatory strain rheology.22 The thermally assisted Brownian motion decreases G′ as the system is heated. Near the demixing region, the increased concentration fluctuations are characterized by an increase in G′, causing the sample to move to an unstable regime in the phase diagram (Fig. 1a). This is generally observed only in blends with dynamic asymmetry and is not present in dynamically symmetric blends like PMMA/SAN23 and PαMSAN/PMMA.24 The correlation length (ξ), which is the length scale of the concentration fluctuation, increases abruptly around the phase separation temperature. It is related to the parameters obtained from rheology by
δ as a function of temperature by low-amplitude oscillatory strain rheology.22 The thermally assisted Brownian motion decreases G′ as the system is heated. Near the demixing region, the increased concentration fluctuations are characterized by an increase in G′, causing the sample to move to an unstable regime in the phase diagram (Fig. 1a). This is generally observed only in blends with dynamic asymmetry and is not present in dynamically symmetric blends like PMMA/SAN23 and PαMSAN/PMMA.24 The correlation length (ξ), which is the length scale of the concentration fluctuation, increases abruptly around the phase separation temperature. It is related to the parameters obtained from rheology by
 | (2) |
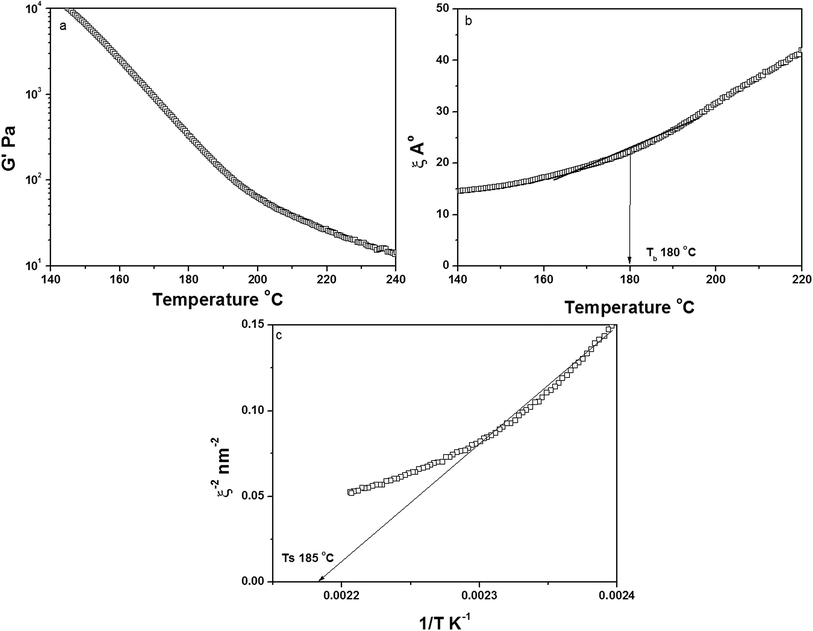 | ||
| Fig. 1 (a) G′ as a function of temperature, (b) ξ as a function of temperature, and (c) 1/ξ2 as a function of T−1, derived from the temperature sweep of PS/PVME 90/10. | ||
The reciprocal of correlation length (ξ−2) is plotted as a function of temperature Fig. 1c.25,26 A straight line intercepting the x-axis can be taken as the spinodal decomposition temperature.
 | (3) |
The binodal temperature was obtained from the slope change in the plot of G′ as a function of temperature. Furthermore, the correlation length was plotted as a function of temperature (Fig. 1b). The increase in the correlation length, obtained from the inflection point of the curve, was considered as the binodal temperature (Tb). The spinodal temperature was obtained as 188 °C by considering the straight-line intercept of the ξ−2 vs. T−1 plot.
The POM images (Fig. S1, ESI†) showed that the size of the PVME domains was nearly 100 μm near 200 °C. Hence, the annealing temperature was chosen as 190 °C, well above the temperature at which the droplets coarsen and higher than the spinodal temperature of the blend (188 °C). The compression-molded discs were annealed for different times to optimize the droplet size. The SEM image of the as pressed sample, which shows no pores, is shown in Fig. S2 (ESI†). The samples were annealed for 30 min, 45 min and 1 h. The samples annealed for 45 min suggested pore sizes of 1–5 μm and was used for further studies (Fig. 2). This supports the fact that upon annealing, the PVME droplets coarsened, generating porous structures after etching.
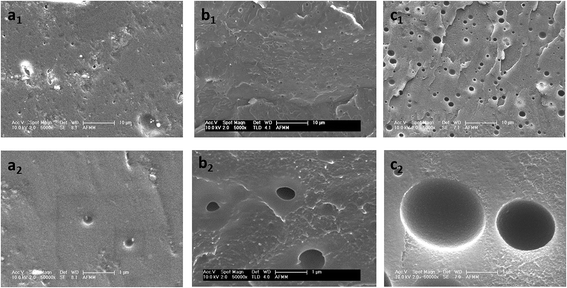 | ||
| Fig. 2 SEM images for neat 90/10 PS/PVME blends annealed at 190 °C (a1 and a2) for 30 min (b1 and b2) 45 min and (c1 and c2) 1 h. | ||
Electrospinning of polymer fiber scaffolds onto the membranes
To optimize the fiber mats, the polymers (PS and PVME-MAH) were dissolved in various solvents (Table 1) at various concentrations to form non-beaded fibers. The electrospun fiber mats were electrospun from polymer solution at various concentrations (10, 15 and 20% w/v) in different ratios of DMF/THF/methanol. The processing conditions for different electrospun fiber mats are shown in Table 1. Because 20% (w/v) solution of PS gave fibers with microgrooved or corrugated structures, the rest of the experiments were carried out at this concentration. The morphology of different electrospun fibers are shown in Fig. 3. At polymer concentrations below 20 wt%, beaded fibers were obtained because of the low viscosity of the polymer solution.| Polymer + solvent | Voltage | Working distance | Flow rate |
|---|---|---|---|
| PS + 1 wt% nAg (THF/methanol 5/1 mL) | 15 kV | 13 cm | 1 mL h−1 |
| PS/PVME-MAH (50/50 wt%) + 1 wt% nAg in THF/DMF/methanol (5/5/2 mL) | 15 kV | 15 cm | 1 mL h−1 |
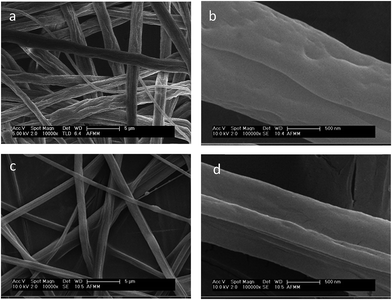
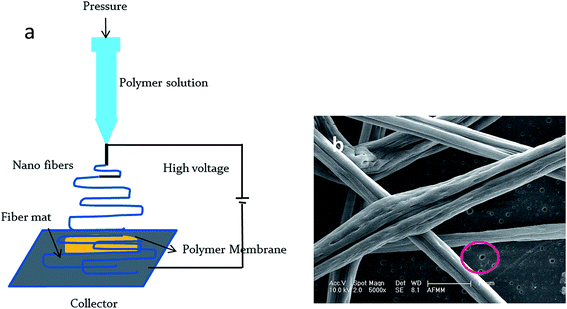
Fibers with a non-circular cross section and a microgrooved structure were obtained by electrospinning PS in THF/methanol. This is because of the buckling instability that occurs during the solvent evaporation, arising from the lateral deformation in the skin of the fiber owing to elastic instability. It is controlled by the drying time (tD) and buckling time (tB).27 The competition between the electrostatic force and the surface tension of polymer determines whether the fiber has a porous or wrinkled morphology.28 The electrospun fibers were collected on the surface of the porous membrane, as explained in the Experimental section and shown in the schematic in Fig. 4a. The SEM images (Fig. 4b) taken after compression molding the fibers on the membrane confirm that the fibers are properly embedded on the membranes and are intact. Amphiphilic copolymers of vinyl ethers like PVME-MAH are inherently antibacterial.29 The interaction of hydrophobic segments in the copolymer with the hydrophobic region of lipid bilayers in the bacterial cell causes membrane disruption, whereas the cationic segment remains attached to the aqueous environment. The effect of the combination of different electrospun fibers, like PS and PVME-MAH, on the transmembrane flux and antibacterial properties was assessed.
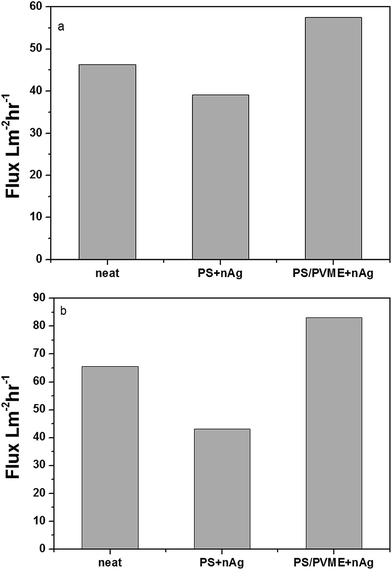
The performance of the PS/PVME membranes with various electrospun polymers was assessed by our in-house cross flow setup. Flux was calculated by using eqn (1) and was plotted with respect to the transmembrane pressure (Fig. 5). The membranes were annealed for 45 min. For comparison, water flux was measured for membranes annealed for a longer time of 1 h. During the structural evolution, the droplets coarsen. Hence, the increased annealing time created larger droplets of PVME and increased the pore diameter, thereby increasing the flux. The PS/PVME 90/10 membranes annealed for 45 min and 1 h are compared in ESI 3.† Thus, the membranes were annealed for 45 min before etching out PVME and electrospinning the polymers.
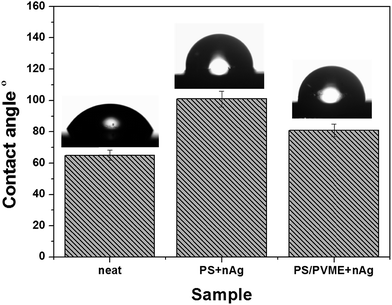
The difference in the water flux for the modified membranes depended on the surface behavior of the pores, and hence the contact angle was evaluated. Highly hydrophobic surfaces are advantageous because they can adsorb various type of solute from the feed.30,31 Hydrophilic surfaces are less susceptible to fouling.32 The modification of the porous membrane by PS + nAg made the surface more hydrophobic, increasing the contact angle. However, the addition of hydrophilic PVME-MAH also made the membrane more hydrophilic. Fig. 6 shows the dependence of water flux on the transmembrane pressure. The dependence of surface roughness on the hydrodynamic mechanism is still unclear; however, the increase in surface roughness can increase the effective surface area, and thereby increase the membrane flux.14
Antibacterial and antifouling properties of the membrane
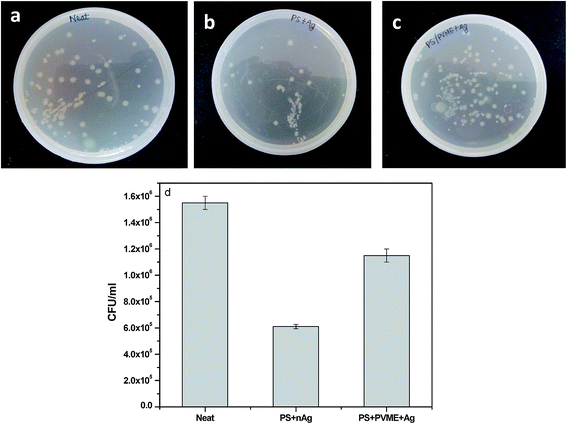
E. coli was chosen as a model bacterium because it is one of the most common microorganisms in drinking water that causes biofouling of membranes. E. coli can form bio-films by adhering to the surface of the film by various physico–chemical interactions. The antibacterial and antifouling performance in these membranes were assessed by the inactivation of E. coli by using the direct contact method. The direct contact method is used to analyze the interaction of bacterial cells with a substrate.33 Bacterial cells during 1 h incubation come into contact with the membrane and show their response to the surface coating.The colony count on the agar plate shows that the membrane with PS + nAg fibers had the lowest number of colonies indicating that it had the highest antibacterial activity, followed by PS + PVME-MAH + nAg fibers, and then the control sample (Fig. 7). Apart from altering flux, the surface properties of the membrane can reduce or increase biofouling. For hydrophobic membranes, the absence of hydrogen bonds in the boundary layer between the membrane interface and water can repel water molecules from the surface. This allows the foulants to be adsorbed on the surface. For hydrophilic membranes, the high surface tension leads to the formation of a thin layer of water molecules on the surface of the membrane, which can prevent solutes from breaking the boundary layer of the water and causing biofouling. The colony count studies of these membranes showed contrasting results. The membranes coated with PS + nAg fibers showed a higher contact angle and were hydrophobic. The combined effect of the microgrooved topography of the PS fiber and the presence of antibacterial nAg particles on the surface resulted in excellent antifouling properties for the membrane with PS + nAg fibers. The silver particles accumulate in cells and cause cell toxicity. Studies suggest that the silver ions generated on the surface of nAg particles can attack the membrane lipids and affect the membrane function.34,35 The most commonly proposed mechanisms for the bactericidal properties of silver nanoparticles in E. coli are (i) the disruption of ATP production and DNA replication by the gradual release of silver ions, (ii) direct damage to the cell membranes in the presence of silver nanoparticles, and (iii) silver nanoparticles and ions generating reactive oxygen species.36
To quantify the effect of silver nanoparticles on the bactericidal properties of the membrane, the release of silver ions was characterized by ICP. This study was extended to the membrane coated with PS + nAg and PS/PVME-MAH + nAg fibers. The concentration of silver released after 1 h in for PS + nAg was 73.3 ppb, and that for PS/PVME-MAH + nAg was 21.9 ppb. The release of silver ions was higher for membranes decorated with PS + nAg fibers, which showed the highest bactericidal activity compared with the other samples. In addition, we performed ICP experiments on the permeate and no silver was detected. Hence, the leaching process was different in the mobile and continuous phases.
Substantial bactericidal activity was observed in this case, even though the concentration of silver released was lower than the minimum inhibitory concentration.37 Other studies have found that nAg particles at parts per billion concentrations show antibacterial properties, and the topography is also a deciding factor.38 The PS fibers in this case have a microgrooved morphology. Bacterial cells adhere better to microgrooved structures. Hence, there is a synergistic effect arising from the roughness of the fibers increasing the adhesion of a large number of bacterial cells to the membrane and the antibacterial silver particles released by water in the membrane. The pits formed on the surface of bacteria visible in the SEM images of the membranes (Fig. 8) indicate the antibacterial mechanism of these surfaces. The pits increase the permeability of the bacterial cells affecting the transport through the plasma membrane, causing a progressive release of lipopolysaccharide (LPS) molecules, resulting in cell death. The microgrooved PS fibers with silver nanoparticles showed better antibacterial properties than the PS/PVME-MAH (inherently antibacterial) fibers with silver particles. This observation suggests that the surface characteristics of the fibers are important for their antifouling properties.
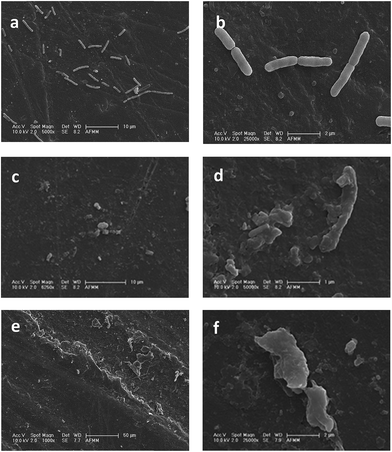 | ||
| Fig. 8 SEM images of the irreversible cell damage to E. coli on PS/PVME 90/10 (a and b) neat, (c and d) with PS + nAg electrospun fibers, and (e and f) with PS/PVME-MAH + nAg electrospun fibers. | ||
Conclusions
In this study, we have used the thermally induced phase separation mechanism of the PS/PVME blend to fabricate heterogeneous structures. The microsized droplets of PVME were etched out to generate porous structures. The membrane was given antibacterial properties by decorating the surface with the electrospinning polymers, PS and PVME-MAH, with and without nAg particles. The transmembrane flux was altered by membranes with electrospun fibers. The electrospun fibers of PS containing nAg and with a microgrooved structure showed better antifouling properties than the antibacterial block copolymer PVME-MAH. Hence, this strategy of modifying the membrane with an electrospinning fiber scaffold by using different polymers containing biocidal nanoparticles is a new strategy for improving the antibacterial surface.Acknowledgements
The authors would like to acknowledge the funding provided by DST, India.References
- M. Mulder, Basic principles of membrane technology, Springer Science & Business Media, 1996 Search PubMed.
- L. J. Zeman and A. L. Zydney, Microfiltration and Ultrafiltration: Principles and Applications, Taylor & Francis, 1996 Search PubMed.
- C. A. Smolders, A. J. Reuvers, R. M. Boom and I. M. Wienk, J. Membr. Sci., 1992, 73, 259–275 CrossRef CAS.
- R. M. Boom, I. M. Wienk, T. van den Boomgaard and C. A. Smolders, J. Membr. Sci., 1992, 73, 277–292 CrossRef CAS.
- V. Freger, Langmuir, 2003, 19, 4791–4797 CrossRef CAS.
- P. Stroeve, V. Vasquez, M. A. N. Coelho and J. F. Rabolt, Thin Solid Films, 1996, 284–285, 708–712 CrossRef CAS.
- D. R. Lloyd, K. E. Kinzer and H. Tseng, J. Membr. Sci., 1990, 52, 239–261 CrossRef CAS.
- D. R. Lloyd, S. S. Kim and K. E. Kinzer, J. Membr. Sci., 1991, 64, 1–11 CrossRef CAS.
- P. Van de Witte, P. Dijkstra, J. Van den Berg and J. Feijen, J. Membr. Sci., 1996, 117, 1–31 CrossRef CAS.
- D. Li, W. B. Krantz, A. R. Greenberg and R. L. Sani, J. Membr. Sci., 2006, 279, 50–60 CrossRef CAS.
- P. K. S. Mural, A. Banerjee, M. S. Rana, A. Shukla, B. Padmanabhan, S. Bhadra, G. Madras and S. Bose, J. Mater. Chem. A, 2014, 2, 17635–17648 CAS.
- P. K. S. Mural, A. Shukla, S. Bhadra, B. Padmanabhan, G. Madras and S. Bose, RSC Adv., 2015, 5, 32441–32451 RSC.
- M. Sharma, G. Madras and S. Bose, J. Mater. Chem. A, 2015, 3, 5991–6003 CAS.
- D. Rana and T. Matsuura, Chem. Rev., 2010, 110, 2448–2471 CrossRef CAS PubMed.
- S. Kang, M. Herzberg, D. F. Rodrigues and M. Elimelech, Langmuir, 2008, 24, 6409–6413 CrossRef CAS PubMed.
- C. Baker, A. Pradhan, L. Pakstis, D. J. Pochan and S. I. Shah, J. Nanosci. Nanotechnol., 2005, 5, 244–249 CrossRef CAS PubMed.
- K. Sunada, Y. Kikuchi, K. Hashimoto and A. Fujishima, Environ. Sci. Technol., 1998, 32, 726–728 CrossRef CAS.
- W. Hu, C. Peng, W. Luo, M. Lv, X. Li, D. Li, Q. Huang and C. Fan, ACS Nano, 2010, 4, 4317–4323 CrossRef CAS PubMed.
- H. Fashandi and M. Karimi, Polymer, 2012, 53, 5832–5849 CrossRef CAS.
- D. Aussawasathien, C. Teerawattananon and A. Vongachariya, J. Membr. Sci., 2008, 315, 11–19 CrossRef CAS.
- C.-L. Pai, M. C. Boyce and G. C. Rutledge, Macromolecules, 2009, 42, 2102–2114 CrossRef CAS.
- A. Ajji and L. Choplin, Macromolecules, 1991, 24, 5221–5223 CrossRef CAS.
- K. Sharma, M. Sharma, A. Chandra and S. Bose, Macromol. Chem. Phys., 2013, 214, 2651–2669 CrossRef CAS.
- G. Vleminckx, S. Bose, J. Leys, J. Vermant, M. Wübbenhorst, A. A. Abdala, C. MacOsko and P. Moldenaers, ACS Appl. Mater. Interfaces, 2011, 3, 3172–3180 CAS.
- C. C. Han, B. J. Bauer, J. C. Clark, Y. Muroga, Y. Matsushita, M. Okada, Q. Tran-cong, T. Chang and I. C. Sanchez, Polymer, 1988, 29, 2002–2014 CrossRef CAS.
- G. H. Fredrickson and R. G. Larson, J. Chem. Phys., 1987, 86, 1553–1560 CrossRef CAS.
- L. Pauchard and C. Allain, Europhys. Lett., 2003, 62, 897 CrossRef CAS.
- S. Megelski, J. S. Stephens, D. B. Chase and J. F. Rabolt, Macromolecules, 2002, 35, 8456–8466 CrossRef CAS.
- P. Lambert and C. Blanvalet, US Pat., US 2009/0311200 A1, 2009.
- M. Ulbricht, Polymer, 2006, 47, 2217–2262 CrossRef CAS.
- R. Gopal, S. Kaur, Z. Ma, C. Chan, S. Ramakrishna and T. Matsuura, J. Membr. Sci., 2006, 281, 581–586 CrossRef CAS.
- B. S. Lalia, V. Kochkodan, R. Hashaikeh and N. Hilal, Desalination, 2013, 326, 77–95 CrossRef CAS.
- L. Clarke and J. Carbon, Cell, 1976, 9, 91–99 CrossRef CAS PubMed.
- J. S. Kim, E. Kuk, K. N. Yu, J.-H. Kim, S. J. Park, H. J. Lee, S. H. Kim, Y. K. Park, Y. H. Park and C.-Y. Hwang, Nanomedicine: Nanotechnology, Biology and Medicine, 2007, 3, 95–101 CrossRef CAS PubMed.
- K.-H. Cho, J.-E. Park, T. Osaka and S.-G. Park, Electrochim. Acta, 2005, 51, 956–960 CrossRef CAS.
- P. Dallas, V. K. Sharma and R. Zboril, Adv. Colloid Interface Sci., 2011, 166, 119–135 CrossRef CAS PubMed.
- G. Zhao and S. E. Stevens Jr, Biometals, 1998, 11, 27–32 CrossRef CAS PubMed.
- E. P. Ivanova, J. Hasan, V. K. Truong, J. Y. Wang, M. Raveggi, C. Fluke and R. J. Crawford, Appl. Microbiol. Biotechnol., 2011, 91, 1149–1157 CrossRef CAS PubMed.
Footnote |
| † Electronic supplementary information (ESI) available. See DOI: 10.1039/c5ra24084k |
| This journal is © The Royal Society of Chemistry 2016 |

