A general and rapid approach to hybrid metal nanoparticle–ZnO nanowire arrays and their use as active substrates for surface-enhanced Raman scattering detection†
Qiyan Huab,
Xiaowang Liua,
Chaoting Wua,
Qing Youa,
Tianchao Shia and
Wu Zhang*a
aCollege of Chemistry and Materials Science, Anhui Normal University, Key Laboratory of Functional Molecular Solids, Ministry of Education, Anhui Laboratory of Molecule-Based Materials, Wuhu 241000, P. R. China. E-mail: zhangwu@mail.ahnu.edu.cn
bCollege of Pharmacy, Wannan Medical College, Wuhu 241002, PR China
First published on 18th December 2015
Abstract
We report a general and facile approach for the preparation of metal nanoparticle (such as Cu, Ag, Au, Pt and Ni)–ZnO hybrid nanowire arrays by taking advantage of a spontaneous redox reaction between the ZnO–Zn substrates and corresponding metal precursors in aqueous solution. The size and density of the metal nanoparticles grown on the ZnO nanowire can be rationally controlled by adjusting the reaction time. Interestingly, the plasmonic nanoparticles render the prepared ZnO-based hybrid nanoarrays with the ability to enhance surface-Raman scattering signals of a diverse array of molecules, including Rh 6G, 4-mercaptobenzoic acid and 4-nitrothiophenol. Moreover, a mesoporous arrangement of Ag nanoparticles with clean surfaces enables both high sensitivity and extraordinary reproducibility in the surface-enhanced Raman scattering (SERS) detection. The outstanding performance of the hybrid ZnO NW arrays in the SERS application, combined with the benefit of their fast preparation (<30 s), makes them particularly useful in rapid SERS detection of bioactive molecules for potential clinical diagnosis.
Introduction
Recently, considerable efforts have been devoted to the development of highly oriented semiconductor arrays comprising advanced and well-defined building blocks, such as nanorods and nanowires, for a wide range of applications spanning from solar cell, catalysis to photodetector.1–6 A number of semiconducting nanorod (NR) or nanowire (NW) arrays, for instance, ZnO, SnO2, TiO2, and α-Fe2O3 have been successfully fabricated by a set of synthetic techniques, mainly including seed-mediated growth and substrate-etching approach.7–9 Among these semiconducting NR/NW arrays, ZnO is probably the most widely used inorganic oxide in advanced materials not only for its intrinsic properties, for example, piezoelectric response, high biocompatibility, and considerable chemical/photochemical stability, but also due to its ease of large-scale synthesis under mild conditions.10–13Reliable access to ZnO NR or NW arrays lays the foundation for developing NR/NW array-based innovative materials for broadening their utility or improving their performance in the applications. For example, coupling of quantum dots on the surface of ZnO NW arrays has proven to be effective in boosting sunlight absorption and in facilitating subsequent charge transfer, thus leading to their enhanced behavior in photocatalytic and photovoltaic use.14–19 Alternatively, growth of metal nanoparticles on the surfaces of the components of ZnO NR/NW arrays provides another pathway to develop novel nanostructures with intriguing properties.20–24 A case in point is the observation of an increased lifetime for photon-induced charge carriers from ZnO nanowire arrays due to the trapping effect provided by the noble nanoparticles.25 As expected from the prolonged lifetime of the charge carriers, metal nanoparticle–ZnO NW arrays exhibit superior photocatalytic performance over pure ZnO NW arrays. Additionally, as noble nanoparticles are a class of attractive catalysts,26–28 immobilization of such nanoparticles on the surfaces of the components of ZnO NR/NW arrays may affords efficient and recyclable catalysts for a diversity of coupling reactions.29,30
Driven by the promise of diverse and exciting applications of metal nanoparticle–ZnO NW arrays, tremendous attempts have been made to develop this kind of hybrid nanostructures. In general, the synthesis involves two steps: (i) preparation of ZnO NW arrays on a variety of substrates; (ii) modification of the synthesized NWs with metal nanoparticles. For example, electrophoresis deposition,31 photo-assisted reduction,32 and thermal decomposition of metal precursors33,34 have been widely exploited to modify ZnO NW arrays with metal nanoparticles such as Au and Ag in the second step. Despite the advances in the synthesis of hybrid ZnO NW arrays, it has been challenging to grow transition metal nanoparticles on the surface of ZnO NWs. In addition, a long reaction time needed for surface-functionalization in a matter of hours appears to be another limitation for the majority of the developed strategies, oftentimes hindering their promising applications in rapid molecule detection based on the use of SERS technique.
In this work, we report a general and robust approach to synthesize a variety of metal nanoparticle (metal = Cu, Ni, Ag, Au and Pt)–ZnO composite nanowire arrays by directly inserting ZnO NW arrays (grown on the surface of Zn foil substrates, referring to as ZnO@Zn) into corresponding metal precursor aqueous solutions for a short period of time (<30 s). This method offers a facile means to control the size and density of metal nanoparticles as well as the length of ZnO NWs deposited with the nanoparticles by rational tuning of the reaction time. Mechanistic studies of metal nanoparticles growth reveal that the driving force for the reduction of the metal ions derives from a combined effect of the highly reductive capability of Zn foil and the low reduction potential of ZnO/Zn, other than from the intrinsic nature of the ZnO NWs. We also found that Ag–ZnO@Zn composite NW arrays hold great promise as an active substrate for SERS detection. Note that the SERS analysis shows both high activity and extraordinary reproducibility. These findings suggest that this method is particular attractive for synthesizing SERS-active substrates for rapid biological and environmental diagnosis.
Results and discussion
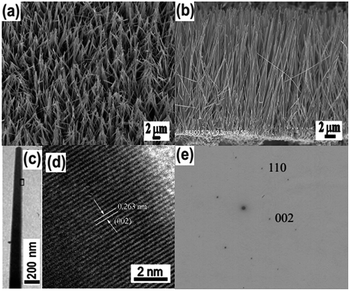
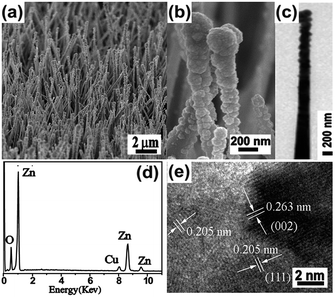
Metal nanoparticle (metal = Cu, Ni, Ag, Au and Pt)–ZnO NW composite arrays were synthesized by a typical two-step method. Firstly, ZnO NW arrays grown on a Zn foil substrate were fabricated according to the procedure reported by Yang et al.35 The growth of ZnO NW arrays is governed by a self-catalysis mechanism—the preformed ZnO nanoparticles grow along their [001] direction. The diameter distribution (Fig. 1a and c) of the NWs in the array is in the range of 150–300 nm, and the average length of the ZnO NWs is about 20 μm. A representative cross-sectional scanning electron microscopy (SEM) (Fig. 1b) reveals that the ZnO NWs are grown on the surface of the zinc foil with high orientation. The ZnO NWs have single-crystalline nature as evidenced by the observation of d-spacing of 0.263 nm (Fig. 1d), which is in good agreement with the lattice spacing in the (002) planes of hexagonal-phase ZnO. Furthermore, combing the results of HRTEM image with the corresponding selected area electron diffraction (SAED) pattern (Fig. 1e) indicates that the ZnO NW grows along its [001] direction, which is in line with previous studies.35We first utilized the synthesis of Cu–ZnO NW array as a model system to introduce a substrate-induced spontaneous reduction in making hybrid ZnO NW arrays. After being immersed into an aqueous solution of CuCl2 (5 mM) for 5 s, the ZnO@Zn substrate substantially changed from white to black. When compared with the starting ZnO NWs, the treated ZnO NWs possess highly rough surfaces as a result of the formation of numerous secondary nanoparticles (Fig. 2a). A close SEM inspection indicates that the density of the nanoparticle gradually decreases from the tip of the ZnO NW (Fig. 2b). This observation is further confirmed by TEM characterization (Fig. 2c), and the secondary nanoparticles are mainly concentrated at a short length, about 1 μm from the tip of the ZnO NW. The energy-dispersive-spectroscopy (EDS) analysis (Fig. 2d) indicates that the hybrid NW array contains element Cu in addition to Zn and O, suggesting that the secondary nanoparticles should be Cu. This hypothesis is validated later by XPS analysis of Cu 2p3/2 for the hybrid ZnO NW arrays. The position for Cu 2p3/2 (Fig. S1a†) peak is located at 932.4 eV, which is identical to the binding energy of bulk copper.36 Interestingly, the Cu nanoparticle is in high crystallinity, and the observed interplanar distance in individual grains is of approximately 0.205 nm (Fig. 2e). Notably, the measured value is in accordance with the d-spacing in the (111) planes of cubic Cu. Taken together, these results suggest that reduction of Cu2+ ions and nucleation of Cu species occur at the surfaces of ZnO@Zn NWs, leading to the formation of Cu–ZnO@Zn hybrid NW arrays.
We next examined the effect of reaction time on the morphology of Cu–ZnO@Zn. With an increased exposure time of 15 s, the density and the size of Cu nanoparticles grown at the tips of ZnO NWs are further increased (Fig. 3a and b). By comparison, the length of the ZnO NW deposited with Cu nanoparticles increases from 1 to 5 μm. However, a similar tendency that the density and size of Cu nanoparticles gradually decrease from the tip of the ZnO NWs remains unchanged. As expected, a further increase in reaction time (30 s) leads to a continuous growth of Cu nanoparticles and results in the connection of the big-sized Cu nanoparticles at the tips of ZnO NWs (Fig. 3c and d).
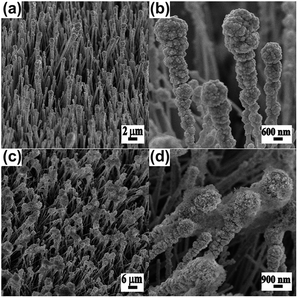 | ||
| Fig. 3 SEM images of Cu–ZnO composite NW arrays prepared with the use of different reaction times. (a and b) 15 s and (c and d) 30 s. | ||
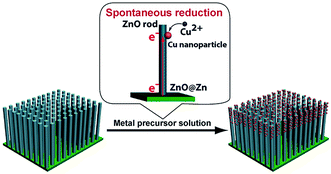
In a initial set of experiments, we investigated the mechanism accounting for the reduction of Cu2+ at the tips of the ZnO@Zn NWs. Direct reduction of Cu2+ ions by ZnO NWs is impossible as the Fermi level of ZnO NWs is about 0.7–0.8 V,37 well below the reduction potential of Cu2+ (0.34 V). This is supported by the observation that no Cu nanoparticles were produced at the tips of ZnO NWs@ITO which was treated in the CuCl2 aqueous solution for 30 s (Fig. S2†). The experimental result implies that the driving force for the reduction of Cu2+ ions may stem from the Zn foil. It was found that ZnO NWs have a much larger work function (5.2–5.3 eV) than Zn (3.63–4.9 eV). Moreover, the standard reduction potential of the Cu2+/Cu (0.34 V) is higher than that of ZnO/Zn (0.88 V). As a consequence, electrons will partially transfer to ZnO NWs at the interfaces of Zn and ZnO NWs. When the ZnO@Zn substrate was subjected to an aqueous solution of Cu2+, electrons transportation would be stimulated along c-axis ([001] direction) of the ZnO NW. The electrons at the surface of the ZnO NW enable the reduction of the arriving Cu2+ ions (Fig. 4). The transportation of electrons from the Zn substrate to the ZnO layer to participate the reduction of Cu2+ ions can be further validated by the experimental observation that an annealed ZnO@Zn substrate (400 °C, 5 h in the presence of O2) is also applicable to the preparation of hybrid Cu–ZnO NW arrays (Fig. S3†). On a separate note, the kinetics of the Cu nanoparticle formation is obviously dictated by the concentration of Cu2+ at the surface of ZnO NWs. The concentration gradient of Cu2+ along the length of ZnO NWs allows for gradual decrease in diameter and density of the Cu nanoparticles from the tip of the ZnO NW.
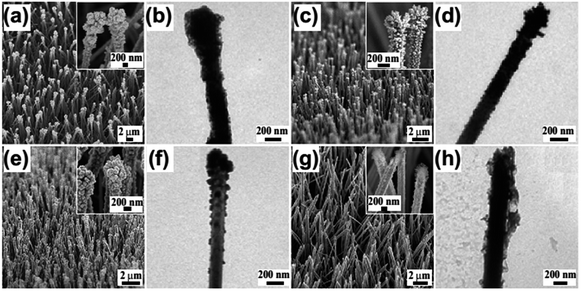
We reasoned that the substrate-induced reduction effect hold promise to modify ZnO@Zn with a broad spectrum of metal nanoparticles once their standard reduction potential of Mx+/M (x: oxidation state of the metal—M) is lower than that for Cu2+/Cu. As a proof-of-concept experiment, we first inserted a ZnO@Zn substrate into an aqueous solution of AgNO3 (5 mM) for 15 s, and a large number of secondary nanoparticles (Fig. 5a) were confirmed to form on the surfaces of the ZnO NWs as well. A further set of characterization (inset of Fig. 5a and b) reveals that the growth manner of Ag nanoparticles is almost identical to that for Cu nanoparticles. The tendency that nanoparticle size and density reduce gradually from the tips of the ZnO NW is also clearly observed. The formation of Ag nanoparticles was confirmed by the presence of characteristic Ag peaks in the EDS profile (Fig. S4a†). Additional experimental results confirms the robustness of the substrate-induced reduction synthesis by the development of a variety of M–ZnO@Zn (M = Au, Pt and Ni) (Fig. 5c–h and S4b–d†) through the use of a similar strategy. However, the morphology of each kind of metal nanostructures formed at the tips of the ZnO NWs significantly varied, for example, Ag and Pt possess particle-like shape; meanwhile Au mainly has dendrite-like structure. In the case of transition metal—Ni, it appears to be in a film-like morphology. The morphological difference should be attributed to a combined result of the variety of the reduction potentials of the metal electrode pairs and the intrinsic crystal-growth habits of each metal.
In a following set of experiments, we studied the UV-vis absorption property of the pure ZnO@Zn, Cu–ZnO@Zn, Ag–ZnO@Zn and Au–ZnO@Zn hybrid NW arrays (Fig. S5†). The results show that all metal nanoparticle–ZnO hybrid NWs as well as pure ZnO@Zn NWs have a strong absorption centered at 366 nm, which is obviously a direct result of band gap absorption of ZnO NWs (3.37 eV).38 Note that the modification of metal nanoparticles has marginable effect on this absorption band. Another absorption feature is that metal nanoparticle-modified ZnO NW arrays have a much stronger absorption in the whole visible spectral region. The enhanced visible absorption capability of the hybrid ZnO NWs may be partially caused by surface plasmon absorption of the metal nanoparticles. More interestingly, surface plasmon resonance absorptions (Fig. S5b–d†) for Ag, Au and Cu nanoparticles were observed at 480, 587 and 604 nm, respectively, in the enlarged absorption profiles. However, the surface plasmon absorptions are relatively weak because of the nature and the low mass loading of these plasmonic nanoparticles. The strong tendency of Cu nanoparticles to undergo oxidation may be another reason for their poor absorption centered at 604 nm.
The robust and rapid synthesis of plasmonic metal nanoparticle–ZnO NWs, combined with excellent surface-enhanced Raman scattering (SERS) performance of plasmonic nanoparticles, especially Ag,39–41 stimulated us to perform a set of experiments to check the feasibility of using hybrid ZnO NW arrays as a substrate for SERS-based analysis. SERS technique has been proven effective in sensitive and selective detection of trace amount of molecules and metal ions.42–44 The signal enhancement of Raman scattering is determined by a number of factors, such as the intrinsic properties of the metal, the nanoparticle size and interparticle distance.45–47 It has been theoretically and experimentally demonstrated that the gap between two plasmonic nanoparticles (referred to as “hot spots”) is the most active site to give rise to enhanced Raman scattering signals.48 In our experiments, Rh 6G was selected as a probe molecule for SERS studies due to its large Raman cross-section and considerable photostability. Typically, a droplet (5 μL) of methanol solution of Rh 6G was homogeneously placed on a metal nanoparticle–ZnO NW array substrate. After the evaporation of methanol, the substrate was shined by a focused laser beam (2 mW, 1.55 μm in diameter) to generate Raman signals. We found that all substrates have SERS activity due to the observation of a set of characteristic Raman signals for Rh 6G (Fig. 6) at low concentrations, for example, a peak located at 1186 cm−1 is ascribed to the C–C stretching vibrations, while Raman bands at 1313, 1367, 1515, 1581(1604) and 1654 cm−1 are assigned to aromatic C–C stretching vibrations.49 Noticeably, the detection sensitivity of different types of hybrid NW arrays significantly varied. To quantitatively compare the Raman enhancement of these hybrid ZnO NWs, a parameter, enhancement factor (EF), was introduced and could be calculated by using following equation.50
It is worth noting that the Ag–ZnO@Zn also possesses an extraordinary capability in affording reproducible Raman scattering signals. SERS spectra for 60 points (Rh 6G, 1 × 10⁻¹² M) obtained by using a line-mapping method (step-size: 1 μm) show SERS bands of similar intensity. A quantitative study of the main Raman vibrations at 1367, 1515 and 1654 cm−1 for the obtained SERS profiles indicates that their relative standard deviations is in the range of 18.2 to 20.9% (Fig. S9†). The sensitive and reproducible detection of Rh 6G allow us to extend the list of probe molecule. Additional experimental results suggest that the Ag–ZnO hybrid NW arrays are also suitable for sensitive SERS detection of 4-mercaptobenzoic acid and 4-nitrothiophenol. At a low concentration of 4-mercaptobenzoic acid (1 × 10⁻⁴ M), its characteristic Raman bands (Fig. 7a) at 1582 (ring C–C stretching, asymmetric C–H in-plane bending) and 1074 cm−1 (aromatic ring breathing, symmetric C–H in-plane bending, C–S stretching) were clearly observed.51 For 4-nitrothiophenol (1 × 10⁻⁵ M), in addition to the stretching of C![[double bond, length as m-dash]](https://www.rsc.org/images/entities/char_e001.gif) C (1571 cm−1) and C–S stretching (1080 cm−1), νsym (NO2) (1336 cm−1) (Fig. 7b) was obviously detected.52 Taken together, these findings indicates that the Ag–ZnO@Zn substrates prepared by using the substrate-induced reduction method should be technically superior to those substrates prepared by ex situ reduction methods considering both of the ease of substrate fabrication and outstanding performance of the hybrid substrate in SERS applications.48
C (1571 cm−1) and C–S stretching (1080 cm−1), νsym (NO2) (1336 cm−1) (Fig. 7b) was obviously detected.52 Taken together, these findings indicates that the Ag–ZnO@Zn substrates prepared by using the substrate-induced reduction method should be technically superior to those substrates prepared by ex situ reduction methods considering both of the ease of substrate fabrication and outstanding performance of the hybrid substrate in SERS applications.48
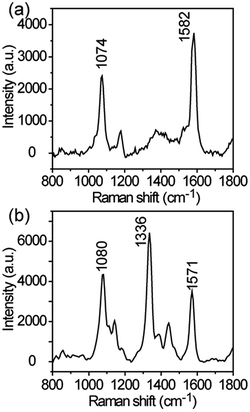 | ||
| Fig. 7 SERS detection of 4-mercaptobenzoic acid (1 × 10⁻⁴ M) and 4-nitrothiophenol (1 × 10⁻⁵ M) by using Ag–ZnO (15 s) hybrid nanoarrays as a substrate. | ||
Conclusions
In summary, a general and rapid approach has been developed for the synthesis of hybrid metal (Cu, Ag, Au, Pt and Ni)–ZnO NW arrays via a spontaneous reduction reaction between the ZnO@Zn NW arrays and corresponding metal precursor solutions in a matter of seconds. The Zn foil substrate-induced in situ reduction of metal ions, combined with the concentration gradient of the metal ions along the c-axis of the ZnO NWs, allows localized synthesis of metal nanoparticles at the tip of the ZnO NW. Our finding also demonstrates that the as-prepared hybrid Ag–ZnO NW array has attractive promise in rapid, sensitive and reproducible SERS detection of biomolecules. Given the rich properties of metal nanoparticles and the highly ordered characteristic of the array structure, the as-prepared hybrid ZnO NW arrays may find widespread application in other fields, such as solar cell and catalysis.Experimental section
Synthesis of ZnO@Zn NW arrays
Zn foil (99.99%), ammonia (25%, analytical grade) and metal salts (analytical grade) were obtained from Shanghai Chemical Reagents Company. ZnO NW arrays were fabricated via a reported method with slight modifications.35 Typically, ammonia (6 mL) was firstly dissolved in distilled water (34 mL), and then four pieces of Zn foil (1.5 cm × 1 cm) was added into the resulting solution. Note that the Zn foils were washed with acetone and ion-exchanged several times before the use. Thereafter, the as-prepared aqueous solution of ammonia and Zn substrates transferred into a 60 mL Teflon-lined autoclave, and the autoclave was kept at 110 °C for 14 h.Synthesis of metal nanoparticle–ZnO NW heterostructure arrays
As-prepared ZnO NW arrays were washed with ion-exchanged water, and then dried under N2 atmosphere. Typically, a dried ZnO@Zn NW array was immersed into an aqueous solution of CuCl2 (5 mM) for 5 (15 or 30 s). Note that the ZnO@Zn substrate changed from white to black after the exposure to CuCl2 solution. The resulting Cu–ZnO@Zn NW array was washed with ion-exchanged water, and then dried under N2 atmosphere for further use. Other hybrid metal nanoparticle–ZnO NW arrays were synthesized by a similar strategy.Characterization
TEM, HRTEM, and EDX spectrometry were performed using a JEM-2010 microscope operated at 200 kV. SEM characterization was taken with a field emission scanning electron microscope (Hitachi S-4800). X-ray photoelectron spectroscopy investigation was conducted on a Thermo ESCALAB 250 electron spectrometer with the use of a monochromated Al Ka X-ray source. UV-visible absorption profiles were obtained on a Shimadzu UV-2450 spectrometer. Raman spectra were recorded with an HR 800 Raman spectrometer (J Y, France) equipped with a synapse charge-coupled device (CCD) detector and a confocal Olympus microscope. SERS experiments were conducted by using line-mapping mode (increment: 1 μm). SERS signals were collected at LMPlanFl 50× objective lens (lens with the long focal length) with a numerical aperture of 0.50. Note that the accumulation time is of 1 s. According the UV-visible absorption spectra of Ag–ZnO@Zn, Cu–ZnO@Zn and Au–ZnO@Zn NW arrays, a 514 nm He–Ne laser was employed for optimizing SERS application by using Ag–ZnO@Zn NW arrays as a substrate. In case of using Cu–ZnO@Zn and Au–ZnO@Zn NW arrays for SERS studies, a 633 nm laser was used.Acknowledgements
This work was supported by the National Natural Science Foundation of PR China (No. 21272006, 21471007), the Foundation of The Key Laboratory of Functional Molecular Solids, Ministry of Education (No. 14009).Notes and references
- B. A. Gonfa, M. R. Kim, N. Delegan, A. C. Tavares, R. Izquierdo, N. Wu, M. A. E. Khakani and D. Ma, Nanoscale, 2015, 7, 10039–10049 RSC.
- R. Tang and L. Yin, J. Mater. Chem. A, 2015, 3, 17417–17425 CAS.
- A. B. Wong, S. Brittman, Y. Yu, N. P. Dasgupta and P. Yang, Nano Lett., 2015, 15, 4096–4101 CrossRef CAS PubMed.
- Y. Liu, L. Zhao, J. Su, M. Li and L. Guo, ACS Appl. Mater. Interfaces, 2015, 7, 3532–3538 CAS.
- S. Sarkar and D. Basak, ACS Appl. Mater. Interfaces, 2015, 7, 16322–16329 CAS.
- D. Lee and K. Yong, J. Phys. Chem. C, 2014, 118, 7788–7800 CAS.
- C. Zhang, C. E. Marvinney, H. Y. Xu, W. Z. Liu, C. L. Wang, L. X. Zhang, J. N. Wang, J. G. Ma and Y. C. Liu, Nanoscale, 2015, 7, 1073–1080 RSC.
- L. Vayssieres and M. Graetzel, Angew. Chem., Int. Ed., 2004, 43, 3666–3670 CrossRef CAS PubMed.
- B. Liu and E. S. Aydil, J. Am. Chem. Soc., 2009, 131, 3985–3990 CrossRef CAS PubMed.
- K. C. Pradel, W. Wu, Y. Ding and Z. L. Wang, Nano Lett., 2014, 14, 6897–6905 CrossRef CAS PubMed.
- S. L. Cheng, J. H. Syu, S. Y. Liao, C. F. Lin and P. Y. Yeh, RSC Adv., 2015, 5, 67752–67758 RSC.
- D. Kim, K. K. Sakimoto, D. Hong and P. Yang, Angew. Chem., Int. Ed., 2015, 55, 3259–3266 CrossRef PubMed.
- N. Kumar, A. K. Srivastava, R. Nath, B. K. Gupta and G. D. Varma, Dalton Trans., 2014, 43, 5713–5720 RSC.
- M. Seol, E. Ramasamy, J. Lee and K. Yong, J. Phys. Chem. C, 2011, 115, 22018–22024 CAS.
- H. Kim and K. Yong, ACS Appl. Mater. Interfaces, 2013, 5, 13258–13264 CAS.
- Z. Zhu, J. Qiu, K. Yan and S. Yang, ACS Appl. Mater. Interfaces, 2013, 5, 4000–4005 CAS.
- H. M. Chen, C. K. Chen, Y.-C. Chang, C.-W. Tsai, R.-S. Liu, S.-F. Hu, W.-S. Chang and K.-H. Chen, Angew. Chem., Int. Ed., 2010, 49, 5966–5969 CrossRef CAS PubMed.
- D. Liu, Z. Zheng, C. Wang, Y. Yin, S. Liu, B. Yang and Z. Jiang, J. Phys. Chem. C, 2013, 117, 26529–26537 CAS.
- L. Vayssieres, C. Sathe, S. M. Butorin, D. K. Shuh, J. Nordgren and J. Guo, Adv. Mater., 2005, 17, 2320–2323 CrossRef CAS.
- F. Xu, Y. Zhang, Y. Sun, Y. Shi, Z. Wen and Z. Li, J. Phys. Chem. C, 2011, 115, 9977–9983 CAS.
- C. Yang, C. Xu and X. Wang, Langmuir, 2012, 28, 4580–4585 CrossRef CAS PubMed.
- J. Huang, F. Chen, Q. Zhang, Y. Zhan, D. Ma, K. Xu and Y. Zhao, ACS Appl. Mater. Interfaces, 2015, 7, 5725–5735 CAS.
- H. Tang, G. Meng, Q. Huang, Z. Zhang, Z. Huang and C. Zhu, Adv. Funct. Mater., 2012, 22, 218–224 CrossRef CAS.
- Y. H. Ko and J. S. Yu, Phys. Status Solidi A, 2012, 209, 297–301 CrossRef CAS.
- I. Unlu, J. W. Soares, D. M. Steeves and J. E. Whitten, Langmuir, 2015, 31, 8718–8725 CrossRef CAS PubMed.
- H. Wang, L. Thia, N. Li, X. Ge, Z. Liu and X. Wang, ACS Catal., 2015, 5, 3174–3180 CrossRef CAS.
- C. S. Hinde, D. Ansovini, P. P. Wells, G. Collins, S. V. Aswegen, J. D. Holmes, T. S. Andy Hor and R. Raja, ACS Catal., 2015, 5, 3807–3816 CrossRef CAS.
- J. Wang, S. A. Kondrat, Y. Wang, G. L. Brett, C. Giles, J. K. Bartley, L. Lu, Q. Liu, C. J. Kiely and G. J. Hutchings, ACS Catal., 2015, 5, 3575–3587 CrossRef CAS.
- D. Shao, J. Gao, G. Xin, Y. Wang, L. Li, J. Shi, J. Lian, N. Koratkar and S. Sawyer, Small, 2015, 11, 4785–4792 CrossRef CAS PubMed.
- M. R. Hasan, S.-H. Baek, K. S. Seong, J. H. Kim and I.-K. Park, ACS Appl. Mater. Interfaces, 2015, 7, 5768–5774 CAS.
- H. He, W. Cai, Y. Lin and B. Chen, Langmuir, 2010, 26, 8925–8932 CrossRef CAS PubMed.
- M. Wu, W.-J. Chen, Y.-H. Shen, F.-Z. Huang, C.-H. Li and S.-K. Li, ACS Appl. Mater. Interfaces, 2014, 6, 15052–15060 CAS.
- X. Zhang, Y. Liu and Z. Kang, ACS Appl. Mater. Interfaces, 2014, 6, 4480–4489 CAS.
- L. Chen, L. Luo, Z. Chen, M. Zhang, J. A. Zapien, C. S. Lee and S. T. Lee, J. Phys. Chem. C, 2010, 114, 93–100 CAS.
- H. Yang, Y. Song, L. Li, J. Ma, D. Chen, S. Mai and H. Zhao, Cryst. Growth Des., 2008, 8, 1039–1043 CAS.
- C. D. Wagner, W. M. Riggs, L. E. Davis and J. F. Moulder, Handbook of X-ray Photoelectron Spectroscopy, ed. G. E. Muilenberg, Perkin-Elmer Corp., Eden Prairie, MN, 1979, pp. 82–83 Search PubMed.
- R. Memming, Top. Curr. Chem., 1994, 169, 105–181 CrossRef CAS.
- C. Ren, B. Yang, M. Wu, J. Xu, Z. Fu, Y. Lv, T. Guo, Y. Zhao and C. Zhu, J. Hazard. Mater., 2010, 182, 123–129 CrossRef CAS PubMed.
- H. B. Tang, G. W. Meng, Q. Huang, Z. Zhang, Z. L. Huang and C. H. Zhu, Adv. Funct. Mater., 2012, 22, 218–224 CrossRef CAS.
- B. H. Zhang, H. S. Wang, L. H. Lu, K. L. Ai, G. Zhang and X. L. Cheng, Adv. Funct. Mater., 2008, 18, 2348–2355 CrossRef CAS.
- M. S. Schmidt, J. Hübner and A. Boisen, Adv. Mater., 2012, 24, OP11–OP18 CAS.
- L. Yang, P. Li, H. Liu, X. Tang and J. Liu, Chem. Soc. Rev., 2015, 44, 2837–2848 RSC.
- X. Tang, W. Cai, L. Yang and J. Liu, Nanoscale, 2013, 5, 11193–11199 RSC.
- Q. Cai, F. Liao, F. Hu, Y. Li, T. Wang and M. Shao, RSC Adv., 2014, 4, 6424–6429 RSC.
- L. Guerrini and D. Graham, Chem. Soc. Rev., 2012, 41, 7085–7107 RSC.
- F. Liao, L. Cheng, J. Li, M. Shao, Z. Wang and S. Lee, J. Mater. Chem. C, 2013, 1, 1628–1632 RSC.
- X. Tang, W. Cai, L. Yang and J. Liu, Nanoscale, 2014, 6, 8612–8616 RSC.
- L. Guerrini and D. Graham, Chem. Soc. Rev., 2012, 41, 7085–7107 RSC.
- M.-W. Shao, L. Lu, H. Wang, S. Wang, M.-L. Zhang, D.-D.-D. Ma and S.-T. Lee, Chem. Commun., 2008, 2310–2312 RSC.
- Q. Shao, R. H. Que, M. W. Shao, L. Cheng and S.-T. Lee, Adv. Funct. Mater., 2012, 22, 2067–2070 CrossRef CAS.
- P. Jia, J. Qu, B. Cao, Y. Liu, C. Luo, J. An and K. Pan, Analyst, 2015, 140, 5190–5197 RSC.
- L. Kang, X. Han, J. Chu, J. Xiong, X. He, H. Wang and P. Xu, ChemCatChem, 2015, 7, 1004–1010 CrossRef CAS.
Footnote |
| † Electronic supplementary information (ESI) available. See DOI: 10.1039/c5ra24113h |
| This journal is © The Royal Society of Chemistry 2016 |

