Nitrogen mediated electronic structure of the Ti(0001) surface
Lei Lia,
Fan-Ling Menga,
Xiao-Ying Hub,
Liang Qiaob,
Chang Q. Sunc,
Hong-Wei Tian*a and
Wei-Tao Zheng*a
aDepartment of Materials Science and Key Laboratory of Automobile Materials of MOE and State Key Laboratory of Superhard Materials, Jilin University, Changchun 130012, China. E-mail: Tianhw@jlu.edu.cn; wtzheng@jlu.edu.cn
bCollege of Science, Changchun University, Changchun 130022, China
cSchool of Electrical and Electronic Engineering, Nanyang Technological University, Singapore 639798
First published on 28th January 2016
Abstract
The unusual ability of nitrogen in functionalizing transition metals has tremendous implications for the nitride compounds for chemical, electronic, optical, mechanical, and tribological applications yet a consistent insight into the underlying mechanism remains yet a challenge. A combination of density function theory and photoelectron spectroscopy revealed that the nitrogen atom prefers tetrahedron bonding geometry in the Ti(0001) surface, which derives four additional valence density-of-states:bonding electron pairs, nonbonding lone pairs, electronic holes, and antibonding dipoles. Dipole formation modulates the work function, electron–hole generation opens the bandgap and nonbonding interaction ensures the superlubricity of the N–Ti(0001) skin.
1 Introduction
Nitride compounds have formed a class of materials with fascinating properties that have been widely used for mechanical and elastic enhancement, wear and corrosion resistance, magnetic modulation, and photon and electron emission such as GaN light emission devices, etc.1–7 Even though the performance of nitrides has been intensively investigated and widely used, understanding the correlation between the local atomic-bonding, the energy band structures, and the observed or predicted properties of such compounds and their interdependence is still in its infancy. Concerns over the correlation between the chemical bond and valence density of states (DOS) and their effects on materials performance are therefore necessary.Adsorption of nitrogen on the Ti(0001) surface has been investigated by several experiment and theoretical studies.8–15 By low energy electron diffraction (LEED) and Auger electron spectroscopy (AES) measurements, Shih et al.10 suggested that the nitrogen exposure creates a Ti(0001)-(1 × 1)-N phase followed by a Ti(0001)-( )-N structure, in which nitrogen atoms occupy octahedral holes between the first and second metal layers firstly. They also indicated that three outermost layers of the Ti(0001)-(1 × 1)-N surface have a structure essentially identical to those of TiN(111). Fukuda et al.12 has been experimentally investigated that the effect of nitrogen is very similar to that of oxygen, the work function decreases slightly at lower exposures of N2, then reverses and undergoes a substantial increase at saturation exposures. It is generally accepted that the initial negative change in the work function is due to the N2 molecules dissociate and occupy initially sites just below the first metal atomic layer which induced the negative polarization of the adsorbate pointed inward.16 However, it is contradictory that oxygen atoms tend to absorb above the Ti(0001) surface and nitrogen atoms tend to absorb below the surface in the initial stage.17,18
In the present study, we report density functional theory (DFT) revelation of four DOS features in the valence band of the Ti(0001) surface, representing the bonding electron pairs, nonbonding lone pairs, metal electronic holes, and metal antibonding dipoles. The polarization of the conduction electrons by the nonbonding states lowers the work function of the Ti(0001) surface upon nitrogen adsorption. The generation of the electronic holes turns the conductor into semiconductor.
2 DFT calculations
We conducted spin-polarized DFT calculations using the CASTEP code19 with ultrasoft pseudo-potentials, and a kinetic energy cutoff of 400 eV. The exchange correlation function was formulated using the generalized gradient approximation (GGA) with the Perdew–Wang parameterization (known as GGA-PW91),20 which have proved to be more reasonable than other functional.21 The structural optimization was performed until the energy change per atom was less than 5 × 10⁻⁷ eV per atom, the forces on atoms were less than 0.01 eV Å−1, all the stress components were less than 0.02 GPa and a maximum displacement of 5 × 10⁻⁴ Å was reached.The hcp-structured single crystal Ti structure yields a lattice constant of a = 2.935 Å, c = 4.640 Å, which gives c/a = 1.581. These calculated values are consistent with the experiment values of a = 2.949 Å, c = 4.677 Å and c/a = 1.586,22 and in good agreement with previous DFT results.16,23
To optimize the computational cost and the accuracy of the DFT calculations, a six-layer slab of the Ti(0001) surface with a vacuum region of 20 Å is simulated as three-dimensional infinite periodic structures by defining a supercell and periodic boundary conditions in all three principal axes. The bottom two layers were fixed at their bulk truncated structure. A dipole correction was applied to avoid slab–slab interactions.24
3 Results and analysis
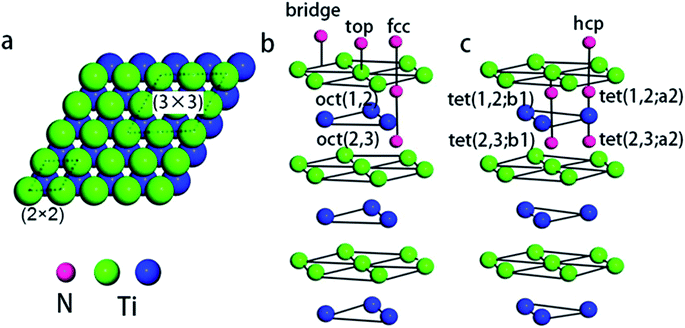
With respect to observations, we assumed that nitrogen adsorbs to the Ti(0001) skin in a mixed monolayer and multilayer configuration. According to LEED and AES measurements, an initial (1 × 1) monolayer and subsequent (1 × 1) + ( ) pattern multilayer can rationalize the subsequent DFT calculations. To calculate the monolayer and multilayer surface structures, two surface models, i.e., (2 × 2) and (3 × 3) supercell as shown in Fig. 1a, are used in this study with a corresponding k-mesh of 6 × 6 × 1 and 4 × 4 × 1, respectively. The calculated work function of clean surface is 4.47 eV that is consistent with experimental values (4.45–4.60 eV)17 and previous DFT calculations (4.45 ± 0.01 eV).13,25
3.1 Adsorption sites and N–Ti bond lengths
Fig. 1b and c shows the possible chemisorption sites. A series of repeated optimization results in the average adsorption energy of nitrogen atoms and work function for possible adsorption sites, as summarized in Table 1.| Adsorption concentration (ML) | Adsorption site | Adsorption energy (eV) | Work function (eV) |
|---|---|---|---|
| 0.25 ML | fcc | 3.46 | 4.39 |
| hcp | 3.42 | 4.54 | |
| Bridge | — | — | |
| Top | — | — | |
| oct(1,2) | 3.97 | 4.21 | |
| tet(1,2;b1) | 2.73 | 4.03 | |
| tet(1,2;a2) | — | — | |
| 0.50 ML | fcc | 3.12 | 5.06 |
| oct(1,2) | 3.82 | 4.13 | |
| fcc + oct(1,2) | 3.68 | 4.75 | |
| hcp + oct(1,2) | 3.80 | 4.68 | |
| 0.75 ML | fcc | 2.94 | 5.49 |
| oct(1,2) | 4.13 | 4.20 | |
| fcc + oct(1,2) | 3.82 | 4.73 | |
| hcp + oct(1,2) | 3.89 | 4.46 | |
| 1.00 ML | fcc | 2.84 | 6.11 |
| oct(1,2) | 4.16 | 4.55 | |
| fcc + oct(1,2) | 3.88 | 4.22 | |
| hcp + oct(1,2) | 3.94 | 4.94 | |
| 1.33 ML | oct(1,2) + fcc | 3.73 | 4.93 |
| oct(1,2) + hcp | 3.90 | 4.88 |
The following formulates the adsorption energy:
The results in Table 1 indicate the following.
First, in the initial stages of adsorption, i.e., at 0.25 ML coverage, the subsurface octahedral (oct(1,2)) site was found to be the most stable location for atomic nitrogen to reside in the Ti(0001) skin. The fcc sites is slightly favorable than the hcp sites, while the top, bridge and tetrahedral sites are energetically unfavorable. Then, nitrogen cover full oct(1,2) sites and form a stable (1 × 1) structure with a saturation coverage 1.00 ML.
Second, with nitrogen concentration increasing, additional ( ) structure formed on the top surface. Due to the interaction of N atoms in adjacent interlayer, the (
 ) surface structure tend to occupied hcp sites.
Third, the work function changes (ΔΦ) relation to the Ti(0001) surface are shown in Fig. 2 and Table 1. We have used as reference the calculation work function of clean Ti(0001) surface (4.47 eV). The work function with a initially decrease, then reverses and undergoes a substantial increase at saturation exposures, which are in excellent agreement with experimental observations.12
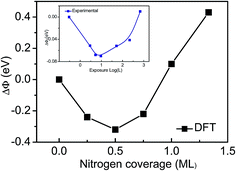 | ||
| Fig. 2 Coverage dependence of the work function for the Ti(0001)–N surface, compared with experimental observations (the inset).12 | ||
Table 2 lists the relaxation of the Ti(0001) slab and the N–Ti bond length of the N–Ti(0001) skin. The relaxation ΔDij is defined by the change in interlayer spacing between the ith and jth Ti metal layers. The dN indicates the average bond length of surface nitrogen atoms (hcp) with respect to topmost Ti plane. The dTi(1)–N and dTi(2)–N indicate the average bond length of subsurface nitrogen atoms (oct(1,2)) with respect to topmost Ti plane and second plane, respectively.
| Relaxation (%) | Bond length (Å) | |||||
|---|---|---|---|---|---|---|
| ΔD12 | ΔD23 | ΔD34 | dN | dTi(1)–N | dTi(2)–N | |
| Ti(0001) (present) | −6.9 | +2.9 | −1.1 | — | ||
| Experiment22 | −2.1 | — | ||||
| DFT26 | −6.8 | +2.8 | −0.5 | — | ||
![[thin space (1/6-em)]](https://www.rsc.org/images/entities/char_2009.gif) |
||||||
| Ti(0001)-(1 × 1)-N | ||||||
| 0.25 ML | +0.8 | +0.1 | −0.4 | — | 2.034 | 2.047 |
| 0.50 ML | +3.1 | +0.5 | +1.2 | — | 2.050 | 2.056 |
| 0.75 ML | +2.0 | +6.3 | −1.3 | — | 2.052 | 2.072 |
| 1.00 ML | +2.0 | +4.6 | −0.8 | — | 2.060 | 2.073 |
![[thin space (1/6-em)]](https://www.rsc.org/images/entities/char_2009.gif) |
||||||
Ti(0001)-(1 × 1)( )-N )-N |
||||||
| 1.33 ML | +7.3 | +0.6 | −1.6 | 1.932 | 2.087 | 2.085 |
| Bulk TiN(111) | 2.123 | 1.227 | ||||
For clean Ti(0001) skin, our calculations yield a contraction of the topmost interlayer spacing of −6.9%, while the second and third interlayer spacing expand and contract by +2.9% and −1.1%, respectively. The contraction of the topmost interlayer spacing is in good agreement with another DFT calculations (−6.8%), while LEED analysis of the Ti(0001) surface predicts a contraction of only −2.1%,22 significantly less than predicted theoretically. The error is due to the main relaxation occurring on the z direction of slab in DFT calculation. When N atoms going into subsurface interlayer, the relaxation induced by undercoordination of skin occurs obviously decreased. However, the surface N atoms significantly expand the topmost interlayer.
For subsurface adsorption, the N–Ti average bond length gradually increased with nitrogen coverage. The Ti(0001)-(1 × 1)-N phase is essentially identical to one (111) double-layer of TiN crystal.
3.2 Valence density of states
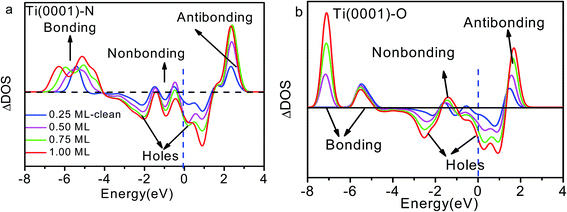 | ||
| Fig. 4 Coverage dependence of the ZPS of n(Ti + X)–n(Ti) for (a) x = N and (b) x = O with respect to that of clean Ti(0001) surface.18 Both sets of profiles exhibit four DOS features that correspond to antibonding dipoles, nonbonding, bonding states and holes. E = 0 eV is the referential Fermi energy. | ||
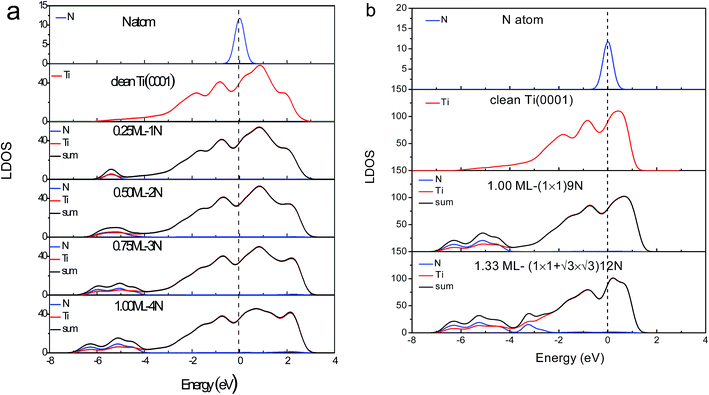
The DOS features between −4.0 and −7.0 eV are derivatives of the Ti–N bonds that are stronger than the original pure Ti–Ti bonds. The stronger interaction lowers the system energy and stabilizes the system. It is reason that TiN is metal ceramic material with high hardness, excellent chemical and thermal stability, reliable mechanical performance at high temperatures. The antibond states (+2.0 eV) arise from polarization of the Ti 3d electronics by the lone pairs of nitrogen. Deeply moving of bonding states and shallow moving of antibonding states lead to form holes near the Fermi level.
 )-N structure is formed based on Ti(0001)-(1 × 1)-N phase, modeled by (3 × 3) supercell. Fig. 3b shows the corresponding valence LDOS. Compared with the clean Ti(0001) surface (Fig. 5), similar four valence DOS features appeared: antibonding (∼+1.5 eV), nonbonding (∼0 eV), holes (−3 to 1 eV) and bonding (−4 eV and −6 eV) states. However, a new bonding state appears at ∼−3.0 eV, which could consider is H-like bonding (N−3–Ti+/dipole:N−3). Meanwhile, antibonding states move to the deeply energy-level and intensity decreased significantly, it is due to H-like bond forms annihilating the electron cloud of the dipoles to the bonding orbitals of the nitrogen at hcp sites.
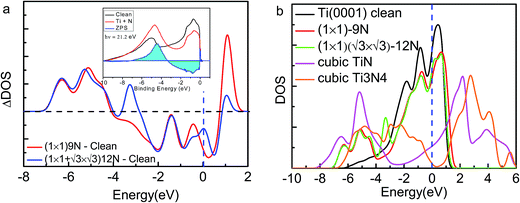 | ||
Fig. 5 (a) Comparison of the measured (inset)8 and calculated ZPS profiles of n(Ti + N)–n(Ti), at Ti(0001)-(1 × 1)-9N and Ti(0001)-(1 × 1)( )-12N with respect to that of clean Ti(0001) surface. (b) The valence DOS dependence on the ration of nitrogen and titanium. Cubic Ti3N4 presents a 0.219 eV bandgap. )-12N with respect to that of clean Ti(0001) surface. (b) The valence DOS dependence on the ration of nitrogen and titanium. Cubic Ti3N4 presents a 0.219 eV bandgap. | ||
Fig. 5 inset shows the differential UPS spectra for Ti(0001) surface with nitrogen exposures based on the zone-resolved photoelectron spectroscopy (ZPS) technique.27 We collected the UPS data of Ti(0001) surface before and after N adsorption.8 Upon the spectral peak area normalization and background correction, we then differentiated the spectra to get the atomic-scale, zone-selective information of the bonding and electronic dynamics. The ZPS features below EF confirms the presence of the mixed hole-nonbonding features as the spectral valley near the EF and the bonding attributes at −7.0 to −4.0 eV as a peak.
3.3 Band gap creation and work function evolution
Fig. 5b shows the sharp fall of the DOS features near the EF results from the holes production in the process of nitrogen ratio increase gradually, until Ti3N4 crystal opening a 0.219 eV bandgap. The sake of simplicity, both TiN and Ti3N4 are cubic-type structure selected in our calculation. The bandgap value of cubic Ti3N4 is slightly small than the theoretical prediction from Peter,28 due to different calculation method. This mechanism may provide reference for band gap modulation of titanium nitride.Fig. 4a and 5a show the antibonding states move to shallow level at low nitrogen coverage and move deeply when the coverage increases. This finding could explain the change of work function. The change of work function corresponds to the shift of the antibonding dipole states, which provides information about the dipoles formation and H-like bond formation. Dipole formation can deepen the antibonding states and reduces the work function; H-like bond formation can shallow the antibonding sub-band and restores the work function, which stabilizes the entire system. According to above, the work function or the threshold in cold cathode field emission of nitrogen compounds can be modulated by the nitrogen content and sites.
4 Discussion
We confirm that the bond–band correlation of nitrides consistent with the bond–band–barrier (3B) correlation notation predictions:29 C, N, O, and F can interact with arbitrary metal to form a tetrahedron with four additional DOS features, i.e., the bonding electron pairs, nonbonding lone pairs, metal electronic holes, and metal antibonding dipoles, which dominate the performance of compounds.The 3B correlation notation indicates that the sp3-orbital hybridization is necessary for O, N, C, and F interacting with atoms in the solid phase to form quasi-tetrahedron like H2O, NH3, CH4, and FH, which determines the crystallography, morphology, band structure, and the chemical physical properties of the chemisorbed skins. Fig. 6a illustrates the physical model of a nitride (NB4) quasi-tetrahedron obtained by replacing the hydrogen in the NH3 molecule with atoms of arbitrary electropositive element B.
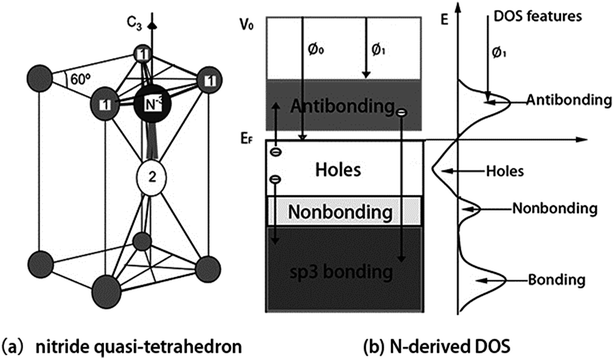 | ||
| Fig. 6 (a) NB4 nitride quasi-tetrahedron structure and (b) the associated valence DOS features. Smaller ions (labeled 1) donate electrons to the central N acceptor of which the sp orbital hybridizes with production of a nonbonding lone pair. N hybridizes its sp-orbit and interacts with arbitrary element B (1 and 2) through bonding (1-N) and nonbonding lone pair (2-N) to form the quasi-tetrahedron: NB4 = N3− + 3B+ (labeled 1) + Bdipole (labeled 2). Arrow represent the process of charge transportation giving rise to four DOS features.29 | ||
Upon interacting with atoms B in a solid phase, the sp orbital of the N atom hybridizes essentially into four directional orbitals, which similar to O atom. There of the four hybridized orbits are occupied by shared electron pairs. The remaining one is occupied by the lone electron pair of nitrogen, which entitles a nitrogen quasi-tetrahedron of C3v group symmetry. Because of the NB4 tetrahedron formation, the electronic structure of the B host solid is modified with four additional valence DOS features: bonding (<EF), nonbonding (∼EF), holes (∼EF), and antibonding (>EF) states. This nitridation defines four features to the valence band of the chemisorbed system in the following electronic dynamics (see Fig. 6b):
(i) Nitrogen catches electrons from its neighboring B atoms to N–B bond and fill its 2s2p4 orbits, which produces energy states slightly lower than the 2p-level of the nitrogen, therefore, electrons in the bonding states should be more stable compared with the otherwise electrons in the host structures. This may explain why a nitride surface is corrosion resistant.
(ii) The N–B bond formation also creates electron holes leave behind the B+ ion, the holes are produced below the EF and hence causing the formation of a bandgap.
(iii) The sp3-orbit hybridization takes place, which creates the nonbonding lone pair states just below the Fermi level (EF).
(iv) The lone pair polarizes its neighboring atoms to form the pinned dipoles (Bdipole) that fill the antibonding orbits. The dipoles reduces the work function from Φ0 to Φ1. So, doping proper amount of nitrogen can lower the work function or threshold in cold-cathode field emitters.
(v) Overdosing nitrogen in chemisorption, the overdosed nitrogen gets electrons from the dipoles that are polarized into antibonding states, H-like bond network (N−3–B+/dipole:N−3) forms at the skin, which annihilates the skin dipoles and raises the work function. The ‘–’ and ‘:’ represent the bonding pair and the nonbonding lone pair, respectively. The arrow from the antibonding to bonding states corresponds to the process of H-like bond formation.
5 Conclusions
Consistency in the 3B theory expectation, DFT calculations, and UPS measurement clarified the essentiality of tetrahedron formation of N–Ti with four additional DOS features: bonding electron pairs; nonbonding lone pairs; holes; and antibonding dipoles. These DOS features determine the physical properties of the chemisorbed Ti(0001) surface. Ti–N bonding states lower the system energy and passivate the Ti(0001) surface; nonbonding lone pairs and antibonding dipoles modify the work function that changes with adsorption concentration and adsorption sites of nitrogen. Creation of electron holes gradually opens the bandgap turning metallic Ti into Ti3N4 semiconductor. The findings is consistent with oxygen adsorption on Ti(0001) surface. Observations will be helpful for understanding the unusual behavior of nitrides and provide powerful means for designing and fabricating functional materials.Acknowledgements
Financial support from the NSF (No. 51472106) of China and the NSF (No. 20140101107JC) of Jilin Province are highly appreciated. The DFT calculations utilized resources at the High Performance Computing Center of Jilin University, China.References
- P. Waltereit, et al., Nitride semiconductors free of electrostatic fields for efficient white light-emitting diodes, Nature, 2000, 406(6798), 865–868 CrossRef CAS PubMed.
- P. Schaaf, Laser nitriding of metals, Prog. Mater. Sci., 2002, 47(1), 1–161 CrossRef.
- Z. Gu, et al., On the nature of point defect and its effect on electronic structure of rocksalt hafnium nitride films, Acta Mater., 2014, 81, 315–325 CrossRef CAS.
- S. Wang, et al., The Hardest Superconducting Metal Nitride, Sci. Rep., 2015, 5, 13733 CrossRef PubMed.
- P. Patsalas, N. Kalfagiannis and S. Kassavetis, Optical Properties and Plasmonic Performance of Titanium Nitride, Materials, 2015, 8(6), 3128–3154 CrossRef.
- H. Morkoç and S. N. Mohammad, High-Luminosity Blue and Blue-Green Gallium Nitride Light-Emitting Diodes, Science, 1995, 267(5194), 51–55 Search PubMed.
- G. M. Yang, et al., Density Functional Theory Calculations for the Quantum Capacitance Performance of Graphene-Based Electrode Material, J. Phys. Chem. C, 2015, 119(12), 6464–6470 CAS.
- D. E. Eastman, Photoemission energy level measurements of sorbed gases on titanium, Solid State Commun., 1972, 10, 933–935 CrossRef CAS.
- H. D. Shih and F. Jona, Atomic underlayer formation during the reaction of Ti {0001} with nitrogen, Surf. Sci., 1976, 60, 445–465 CrossRef CAS.
- H. Shih, et al., Low-Energy-Electron-Diffraction Determination of the Atomic Arrangement in a Monatomic Underlayer of Nitrogen on Ti(0001), Phys. Rev. Lett., 1976, 36(14), 798–801 CrossRef CAS.
- W. Brearley and N. A. Surplice, Changes in the work function of titanium films owing to the chemisorption of N2, O2, CO and CO2, Surf. Sci., 1977, 64, 372–374 CrossRef CAS.
- Y. Fukuda, W. T. Elam and R. L. Park, Nitrogen, Oxygen, and Carbon Monoxide Chemisorption on Polycrystalline Titanium Surfaces, Appl. Surf. Sci., 1978, 1, 278–287 CrossRef CAS.
- P. Feibelman and F. Himpsel, Spectroscopy of a surface of known geometry: Ti(0001)–N(1 × 1), Phys. Rev. B: Condens. Matter Mater. Phys., 1980, 21(4), 1394–1399 CrossRef CAS.
- B. M. Biwer and S. L. Bernasek, A photoelectron and energy-loss spectroscopy study of Ti and its interaction with H2, O2, N2 and NH3, Surf. Sci., 1986, 167, 207–230 CrossRef CAS.
- M. V. Kuznetsov and E. V. Shalaeva, Competing Adsorption of Nitrogen and Oxygen at the Ti(0001) Face : XPS Examination, Phys. Met. Metallogr., 2004, 97, 485–494 Search PubMed.
- S.-Y. Liu, et al., Ab initio study of oxygen adsorption on the Ti(0001) surface, J. Phys.: Condens. Matter, 2007, 19(22), 226004 CrossRef.
- D. Hanson, R. Stockbauer and T. Madey, Photon-stimulated desorption and other spectroscopic studies of the interaction of oxygen with a titanium (001) surface, Phys. Rev. B: Condens. Matter Mater. Phys., 1981, 24(10), 5513–5521 CrossRef CAS.
- L. Li, et al., Oxygenation mediating the valence density-of-states and work function of Ti(0001) skin, Phys. Chem. Chem. Phys., 2015, 17(15), 9867–9872 RSC.
- M. R. Hoffmann, et al., Environmental applications of semiconductor photocatalysis, Chem. Rev., 1995, 95, 69–96 CrossRef CAS.
- J. Perdew, P. Ziesche and H. Eschrig, Chapter Unified Theory of Exchange and Correlation Beyond the Local Density Approximation. Electronic Structure of Solids, ed. P.Ziesche and H. Eschrig, Akademie, Berlin, 1991 Search PubMed.
- J. Guo, et al., Study of hydrogen adsorption on the Ti (0001)-(1 × 1) surface by density functional theory, Appl. Surf. Sci., 2008, 255(5), 3164–3169 CrossRef CAS.
- H. D. Shih, et al., The structure of the clean Ti(0001) surface, J. Phys. C: Solid State Phys., 1976, 9, 1405–1416 CrossRef CAS.
- P. J. Feibelman, J. A. Appelbaum and D. R. Hamann, Electronic structure of a Ti(0001) film, Phys. Rev. B: Condens. Matter Mater. Phys., 1979, 20, 1433 CrossRef CAS.
- L. Bengtsson, Dipole correction for surface supercell calculations, Phys. Rev. B: Condens. Matter Mater. Phys., 1991, 59, 12301 CrossRef.
- M. Huda and L. Kleinman, Density functional calculations of the influence of hydrogen adsorption on the surface relaxation of Ti (0001), Phys. Rev. B: Condens. Matter Mater. Phys., 2005, 71(24), 241406 CrossRef.
- J. L. F. Da Silva, C. Stampfl and M. Scheffler, Converged properties of clean metal surfaces by all-electron first-principles calculations, Surf. Sci., 2006, 600(3), 703–715 CrossRef CAS.
- X. Liu, et al., Coordination-Resolved Electron Spectrometrics, Chem. Rev., 2015, 115(14), 6746–6810 CrossRef CAS PubMed.
- P. Kroll, Hafnium Nitride with Thorium Phosphide Structure: Physical Properties and an Assessment of the Hf–N, Zr–N, and Ti–N Phase Diagrams at High Pressures and Temperatures, Phys. Rev. Lett., 2003, 90(12), 125501 CrossRef PubMed.
- C. Q. Sun, Relaxation of the Chemical Bond, Springer Series in Chemical Physics 108, Springer, Heidelberg, 2014, vol. 108, p. 807 Search PubMed.
| This journal is © The Royal Society of Chemistry 2016 |

