A novel electrochemical sensor of tryptophan based on silver nanoparticles/metal–organic framework composite modified glassy carbon electrode†
Zhewei Peng,
Zhongwei Jiang,
Xin Huang and
Yuanfang Li*
Key Laboratory of Luminescent and Real-Time Analytical Chemistry (Southwest University), Ministry of Education, College of Chemistry and Chemical Engineering, Southwest University, Chongqing 400715, China. E-mail: liyf@swu.edu.cn; Fax: +86 23 68367257; Tel: +86 23 68254659
First published on 27th January 2016
Abstract
For the first time, a familiar metal–organic framework MIL-101(Fe) and silver nanoparticles composite (AgNPs/MIL-101) acted as a novel electrode modified material for the detection of tryptophan (Trp). The AgNPs/MIL-101 modified glassy carbon electrode (AgNPs/MIL-101/GCE) produces an increase in the oxidation current of Trp compared with the bare electrode. Additionally, the electrochemical behaviours of Trp on AgNPs/MIL-101/GCE were investigated by cyclic voltammetry (CV) and differential pulse voltammetry (DPV). Under the optimum experimental conditions, the oxidation peak currents are proportional to the concentrations of tryptophan over the ranges of 1 μM to 50 μM and 50 μM to 150 μM, respectively. The detection limit is 0.14 μM (S/N = 3). Moreover, the presented method was successfully applied to the determination of Trp in urine samples with good recovery.
1. Introduction
Metal–organic frameworks (MOFs) have received considerable attention in the last decade owing to their highly accessible surface area, porosity and chemical tenability.1–6 Due to their excellent properties, MOFs have been applied in a variety of fields such as gas storage,7 catalysis,8 and supercapacitors.9 Moreover, Yan et al. developed a series of analytical applications of MOFs in sample collection and chromatographic separation.10,11 Our group has carried out some works involving DNA and glucose detection based on the instinct of MOFs.12,13 Recently, there has been an increasing interest in the development of MOFs based on the composite in the electrochemical field. However, most of the previous reports focused on cave decoration of MOFs as electrode modified materials.14,15 Surface decoration of MOF materials used for electrode modification was rare. At the same time, silver nanoparticles usually exhibit fast electron transfer activities which can be used as electrochemical sensors. For these reasons, the immobilization of silver nanoparticles on substrate surfaces is crucial procedure for developing new electrocatalytic systems.16,17 For example, electrochemical behaviours of silver nanoparticles/graphene oxide and Ag–MoS2/chitosan nanocomposites towards amino acid oxidization have been reported in previous studies.18,19Tryptophan (Trp) is one of the eight essential amino acids for the human body and animal life activities, which plays a vital role in human and animal growth and metabolism. Metabolic disorder of Trp may induce a waste product in the brain and cause hallucinations and delusions.18 Moreover, Trp deficiency has also been associated with Alzheimer Disease (AD), since it is shown that increased Trp intake would decrease pathological plaques in AD.20 According to the World Health Organization (WHO), the daily minimum Trp requirement is set at 4 mg per kg of body weight. Unfortunately, Trp cannot be directly synthesized in the human body and thus has to come from dietary, food products, and pharmaceutical formulas, to which Trp sometimes is added because of its rare presence in vegetables.21 Therefore, it is important to develop a simple and sensitive approach for the determination of Trp.
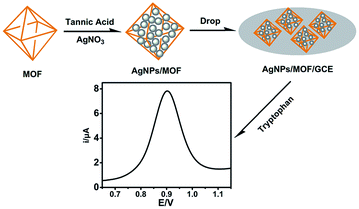
In this work, a well-known MOF MIL-101(Fe) with the exterior modified by silver nanoparticles (AgNPs) was utilized as a novel modifier on the surface of glassy carbon electrode (GCE) (Scheme 1). The combination of large special surface area of MOF and high electrical conductivity of silver nanoparticles makes AgNPs/MIL-101 a very promising candidate as a detection platform for Trp. The as-prepared electrode (AgNPs/MIL-101/GCE) could effectively increase the electron transfer between the electrode and the solution, which leads to a more sensitive current response in the oxidation of Trp under the selected experimental conditions. In addition, the concentrations of Trp in real samples are determined and satisfactory results are obtained. This method extends the application of MOF composites in electrochemistry.
2. Experimental
2.1 Chemicals
Iron(III)chloride hexahydrate (FeCl3·6H2O) and terephthalic acid (H2BDC) (Aladdin, Shanghai, China) were used to prepare MIL-101(Fe). AgNO3 was obtained from Aladdin. Stock solution of tryptophan (1 mM) was prepared by dissolving 20.4 mg of tryptophan in 100 mL of double distilled water and stored in refrigerator before used. The Britton–Robinson buffer solution (pH 2.4) was employed as the supporting electrolyte. All the reagents were analytical grade and commercial, and used without further purification. All the solutions were prepared using ultra-pure water (18.2 MΩ).2.2 Instrumentation
The surface morphology of the nanocomposites was investigated via an S-4800 scanning electron microscope (SEM) (Hitachi, Japan). Powder X-ray diffraction (PXRD) patterns were collected on an D8 ADVANCE X-ray diffractometer (Brooker, Germany) with Cu Kα radiation (λ = 1.5406 Å) in the range of 3–80 θ at a scan rate of 3.00° min−1. Electrochemical experiments were performed on a CHI 660E electrochemical workstation (CH Instruments, Shanghai, China). A conventional three-electrode cell was used with a saturated calomel electrode (SCE) as reference electrode, a Pt wire as counter electrode and a modified glassy carbon electrode (GCE) as working electrode. Electrochemical impedance measurements were performed in 0.1 M KCl containing 5.0 mM Fe(CN)63− and Fe(CN)64−. The impedance spectra were measured in the frequency range from 105 Hz to 0.1 Hz at open circuit potential, with voltage amplitude of 0.005 V. All pH measurements were performed with a pH-510 digital pH-meter with a combined glass electrode (California, USA).2.3 Synthesis of AgNPs/MIL-101(Fe)
MIL-101(Fe) was synthesized according to the earlier report.22 Firstly, 0.675 g of FeCl3·6H2O and 0.206 g of H2BDC were dissolved in DMF (15 mL). The obtained solution was transferred into a Teflon-lined stainless-steel autoclave and heated at 110 °C for 20 h. The impurities were removed by washing with DMF and ethanol for several times. The products were further purified in hot ethanol (70 °C, 4 h). The resultant was centrifuged and then dried overnight at 60 °C under vacuum. The AgNPs/MIL-101 was initially presented by our group.23 Briefly, 20 mg of MIL-101 was suspended in 9.5 mL of H2O, 0.5 mL of 40 mg ml−1 TA solution was injected into the mixture under stirring. Then, 0.5 mL of 0.2 M AgNO3 was gradually added to the TA/MIL-101 solution after the pH values was adjusted to 7.5. After stirring for 1 h, AgNPs/MIL-101 was purified by centrifugation and washed with H2O repeatedly. Finally, the obtained product was further dried in vacuum freezing drying oven overnight.2.4 Preparation of the AgNPs/MIL-101/GCE
Prior to usage, a glassy carbon electrode (GCE, 3 mm in diameter) was polished with slurry of alumina oxide powder (0.3 and 0.05 μm) on chamois leather, washed ultrasonically and then dried with purified nitrogen stream. 5.0 mg of AgNPs/MIL-101 nanohybrid was added to 2.5 mL of water, which was sonicated to form a dispersive suspension solution. 7 μL of AgNPs/MIL-101 suspension was cast on the surface of the clean GCE, and then the suspension was thoroughly dried in an oven at 60 °C and rinsed with distilled water for several times. The electrode was further dried at ambient temperature.3. Results and discussion
3.1 Characterizations of AgNPs/MIL-101 nanocomposite
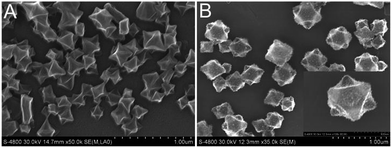
The detailed morphologies and microstructures of MIL-101 and AgNPs/MIL-101 were investigated by SEM (Fig. 1A and B) and XRD. Fig. 1A shows that the synthesized MIL-101 crystallite had a typical octahedral morphology. After modification, the surface of MIL-101 became rough as indicated in Fig. 1B. In X-ray diffraction patterns (Fig. S1†), four obvious characteristic peaks (200) (111) (220) (311) of silver demonstrated that AgNPs had been loaded onto the surface of MOF.243.2 Electrochemical characteristics of AgNPs/MIL-101/GCE
The loading of AgNPs on the surface of MIL-101 can be testified by CV. In Fig. 2A, there are no obvious redox peaks at GCE and MIL-101/GCE while one pair of evident redox peaks can be observed at AgNPs/MIL-101/GCE in the absence of tryptophan. Apparently, the observed redox peaks can be put down to the redox of Ag+/0 in nanocomposite, in which the electroactive AgNPs are oxidized to Ag+ at 0.24 V vs. SCE on the anodic scan, with transformation of Ag+ back to Ag at −0.56 V vs. SCE on the cathodic scan. The fact further attested that AgNPs have been anchored on MIL-101 successfully.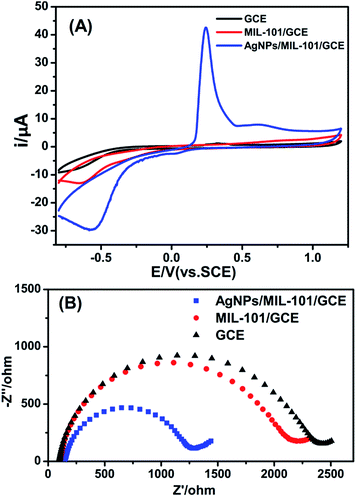 | ||
| Fig. 2 (A) Cyclic voltammograms of GCE, MIL-101/GCE and AgNPs/MIL-101/GCE in BR buffer (pH 2.4). (B) Electrochemical impedance spectra of GCE, MIL-101/GCE and AgNPs/MIL-101/GCE. | ||
The electrochemical impedance spectroscopy (EIS) gives insight into the properties of the interface between the electrode surface and the electrolyte. The charge transfer resistance (Rct) value for the Fe(CN)63−/4− redox probe was measured as the diameter of the semicircle in the Nyquist plots. Nyquist plots for AgNPs/MIL-101/GCE, MIL-101/GCE and GCE were presented in Fig. 2B.
The Rct of MIL-101/GCE is less than that of bare GCE. It is probably due to the fact that the metal ions Fe(III) and terephthalate groups which constitute the metal–organic framework can provide the channel for charges transfer.25 Then, an apparent decrease in Rct is observed in AgNPs/MIL-101/GCE, thanks to the excellent electrical conductivity of silver nanoparticles.18 These changes also revealed that AgNPs were well attached to the metal–organic framework.
3.3 Electrochemical responses of tryptophan on AgNPs/MIL-101/GCE
CVs of the AgNPs/MIL-101/GCE, MIL-101/GCE and bare GCE in BR buffer (pH 2.4) at the scan rate of 100 mV s−1 were shown in Fig. 3. It is obvious that no peak is observed in the absence of Trp for all electrodes (black lines). With the introduction of Trp, one stable oxidation peak occurred in every electrode (red lines). The observation indicated that the current responses were not from the electrode materials but Trp and Trp underwent an irreversible redox process at the electrodes. It was worth noting that the oxidation peak potentials for Trp at the bare GCE and MIL-101/GCE were 1010 mV and 999 mV respectively, while the potential at AgNPs/MIL-101/GCE shifted negatively to 989 mV. Accordingly, the oxidation peak current increased from 6.839 μA (GCE) to 7.788 μA (MIL-101/GCE), then up to 19.52 μA (AgNPs/MIL-101/GCE). The decrease in peak potential and increase in peak current prove that electrocatalytic activity towards Trp of AgNPs/MIL-101/GCE was highly improved.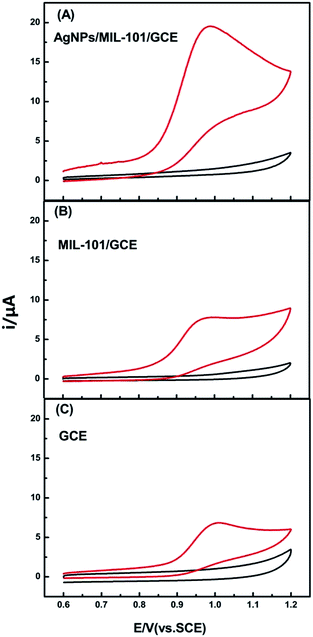 | ||
| Fig. 3 CVs of different electrodes in the absence (black line) and presence (red line) of 0.1 mM tryptophan in BR buffer solution (pH 2.4) with scan rate of 100 mV s−1. | ||
The reason for the enhanced electrochemical response at AgNPs/MIL-101/GCE could be attributed to the following three factors: (1) the MOFs ligands usually contain a conjugated π-electron system,13 while tryptophan molecules contain aromatic structure, thus there may be π–π stacking between MOF and tryptophan, resulting in an increase of the interaction on the surface of AgNPs/MIL-101/GCE and MIL-101/GCE versus GCE, (2) metallic silver nanoparticles own remarkable electrical conductivity, which could accelerate the electron transfer between the electrode and species in solution. (3) Noble metallic nanoparticles could produce high electromagnetic field,18,23,26 and the electromagnetic field from AgNPs would promote the accumulation of the tryptophan molecules at the surface of MIL-101, which possessed large surface area. Consequently, the amperometric response of tryptophan oxidation sharply increased compared with the MIL-101/GCE and bare electrode.
To further investigate the vital role of silver nanoparticles in our detection system, gold nanoparticles/metal–organic framework (AuNPs/MIL-101) was fabricated for comparison with AgNPs/MIL-101 toward tryptophan oxidation. The SEM image of AuNPs/MIL-101 was displayed in Fig. S2(A).† As shown in Fig. S2(B),† AgNPs/MIL-101/GCE demonstrated a relatively high current response compared with AuNPs/MIL-101/GCE in 0.1 mM Trp solution (BR buffer, pH 2.4) with scan rate of 100 mV s−1. The reasons for this phenomenon may be: (1) AgNPs exhibit stronger electromagnetic field intensity than other noble nanoparticles including AuNPs;26 stronger electromagnetic field may accumulate larger amount of tryptophan molecules at the surface of electrode and bring about faster electron transfer rate between the electrode and species in solution. (2) AgNPs own better electrical conductivity than AuNPs. Thus, AgNPs/MIL-101 could act as the optimal electrode modified materials to fabricate tryptophan sensor as opposed to other metallic nanoparticle and MIL-101 composite.
3.4 Effect of the modifier amount
To obtain the optimal modifier amount, different volumes of AgNPs/MIL-101 suspension with the same concentration (2 mg mL−1) were cast onto the surface of GCE. The relationship between the oxidation peak current of Trp and the amount of AgNPs/MIL-101 hybrid was shown in Fig. S3.† The oxidation peak current increased continuously with the amount increasing from 3 to 7 μL. A further increase caused a decrease in the oxidation peak current of tryptophan. Consequently, 7 μL was selected for the succeeding analytical experiments.3.5 Effect of pH value
The pH value of the electrolyte solution had an obvious influence on the oxidation of tryptophan at AgNPs/MIL-101/GCE. Fig. 4 reveals the peak current against pH over the range of 2.0–4.0. It was clear that a maximum in peak current could be observed at pH 2.4, and then decreased from pH 2.4 to pH 4.0. Considering the sensitivity of tryptophan determination, pH 2.4 was chosen for the following experiments. Moreover, Epa shifted negatively with increasing pH value, indicating that a proton was involved in the oxidation reaction. The linear relationship was established between the oxidation peak potential and the pH value of the solution with the linear regression equation as: Epa = −0.0426 pH + 1.088 (R2 = 0.9928).3.6 Effect of scan rate
To clarify the reaction mechanism, the influence of the scan rate on the peak current and peak potential under 0.1 mM Trp was discussed. Fig. 5A shows the CVs of 0.1 mM Trp between 0.6–1.2 V vs. SCE at the AgNPs/MIL-101/GCE when the scan rate varies from 20 to 100 mV s−1. It can be seen that the oxidation peak current of Trp increases linearly with the scan rate in the range of 20 to 100 mV s−1 (Fig. 5B), indicating that the oxidation of Trp at AgNPs/MIL-101/GCE is a typical adsorption-controlled process.18 A similar behaviour is observed at several other electrodes such as gold nanoparticles/MWNT ITO electrode27 and nickel oxide–CuO/graphene electrode.28 | ||
Fig. 5 (A) CVs of 0.1 mM tryptophan at AgNPs/MIL-101/GCE with different scan rates (20–100 mV s−1) in pH 2.4 BR buffer. (B) The plots for ipa vs. v. (C) The plots for Epa vs. ln![[thin space (1/6-em)]](https://www.rsc.org/images/entities/char_2009.gif) v. v. | ||
It was worth to noting that the peak potential (Epa) shifted positively with increasing scan rate (Fig. 5C). The resulting regression equation can be expressed as Epa = 0.0217![[thin space (1/6-em)]](https://www.rsc.org/images/entities/char_2009.gif) ln
ln![[thin space (1/6-em)]](https://www.rsc.org/images/entities/char_2009.gif) v + 0.8838 (R2 = 0.9981). As for an irreversible electrode process, Epa is given by the Laviron's equation:29
v + 0.8838 (R2 = 0.9981). As for an irreversible electrode process, Epa is given by the Laviron's equation:29
3.7 Analytical application
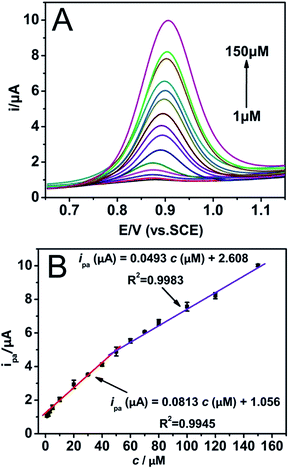
Differential pulse voltammetry (DPV) was carried out to detect tryptophan concentration since its better signal-to background characteristics than conventional CV method.32,33 Before DPV testing, the increasing accumulation time under open-circuit potential was discussed (Fig. S5†), on account of the accumulation for DPV could affect the amount of analytes on the electrode surface, which could sequentially impact the current response. As a result, 120 s was chosen in the following experiments as the optimal adsorption time. Under the selected conditions, the DPVs of various concentrations of Trp at AgNPs/MIL-101/GCE in BR (pH 2.4) are shown in Fig. 6. The inset of Fig. 6 shows the linear calibration curve between the catalytic current and the concentration of Trp in the ranges of 1 μM to 50 μM, and 50 μM to 150 μM, respectively. The linear regression equations can be expressed as ipa (μA) = 0.0813c (μM) + 1.056 (R2 = 0.9945) and ipa (μA) = 0.0493c (μM) + 2.608 (R2 = 0.9983). The detection limit is calculated to be 0.14 μM.Table 1 shows a comparison of AgNPs/MIL-101/GCE with other electrodes for Trp determination. It is obvious that the proposed modified electrode in this work exhibits a wider linear range and lower detection limit compared with some other electrodes reported before, indicating that the AgNPs/MIL-101/GCE possesses unique electrocatalytic characters for the detection of Trp.
Moreover, the possible interferences for Trp determination at the AgNPs/MIL-101/GCE have been investigated. Fig. 7 shows the amperometric response of 0.1 mM Trp and several interferents in a 50-fold concentration of tryptophan including serine, threonine, lysine, histidine, valine, arginine, proline and leucine in BR (pH 2.4). The DPVs certify that all the changes of the peak currents are less than 15% relative to that of tryptophan. Therefore, the proposed AgNPs/MIL-101/GCE can be used to determine Trp in the presence of most of the common interferents.
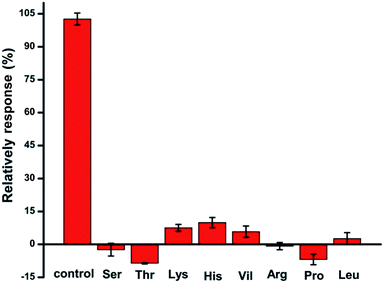 | ||
| Fig. 7 The electrochemical responses for 0.1 mM tryptophan and other amino acids (5 mM, with the concentration 50-fold of Trp) on the AgNPs/MIL-101/GCE. | ||
The AgNPs/MIL-101/GCE was used to determine Trp concentration in urine which acted as real samples. Urine samples were diluted 20-fold with BR buffer (pH 2.4). Using the standard addition method, the recoveries of Trp fell within 92.8–107.2% (Table 2), which lay in the acceptable range. Thus, the AgNPs/MIL-101/GCE can be successfully utilized for the determination of tryptophan in complex samples with adequate accuracy.
| Samples | Added (μM) | Found (μM) | Recovery (%) | RSD (%) |
|---|---|---|---|---|
| 1 | 50 | 47.52 | 95.1 | 4.4 |
| 100 | 107.2 | 107.2 | 1.4 | |
| 2 | 50 | 52.72 | 105.4 | 3.9 |
| 100 | 92.83 | 92.8 | 1.2 | |
| 3 | 50 | 48.73 | 97.5 | 2.9 |
| 100 | 103.73 | 103.7 | 4.3 |
3.8 Reproducibility and stability of the sensor
The reproducibility of the present electrode was examined using five sensors made independently to assay the same 0.1 mM tryptophan in the potential range of 0.6–1.2 V. The relative standard deviation was 2.6%, confirming that the modified electrode for Trp sensing was stable. Also, the long-term stability of the electrode was analyzed by storing it in a dry place for a week. The amperometric response of 0.1 mM Trp at AgNPs/MIL-101/GCE retained 96% of its initial activity. The result showed that the Trp sensor owns good stability.4. Conclusions
In summary, the AgNPs/MIL-101 hybrid was first utilized as an ideal electrode material for the detection of Trp. The obtained AgNPs/MIL-101/GCE exhibited high current response towards Trp oxidation with a wide linear range (1 μM to 50 μM and 50 μM to 150 μM, respectively) and low detection limit (0.14 μM). To the best of our knowledge, it is the first time that the surface modification of metal–organic framework has been utilized to act as electrode modified materials in electrochemical sensor fields. In addition to the superior conductive ability of silver nanoparticles, the excellent current response towards tryptophan oxidation may result from the strong electromagnetic field of AgNPs, which dramatically promote the accumulation of the tryptophan molecules at the surface of MIL-101. Besides, the proposed sensor displayed good selectivity and has been applied to detect Trp in urine with satisfactory results. Our research could lead to explorations of more applications of MOF materials in the electrochemical fields.Acknowledgements
The authors are grateful for the financial support by the National Natural Science Foundation of China (NSFC, No. 21175109).Notes and references
- J. R. Long and O. M. Yaghi, Chem. Soc. Rev., 2009, 38, 1213–1214 RSC.
- C. Casado-Coterillo, A. Fernández-Barquín, B. Zornoza, C. Tellez, J. Coronas and Á. Irabien, RSC Adv., 2015, 5, 102350–102361 RSC.
- F. Cui, Q. Deng and L. Sun, RSC Adv., 2015, 5, 98215–98221 RSC.
- W.-W. Zhou, B. Wei, F.-W. Wang, W.-Y. Fang, D.-F. Liu, Y.-J. Wei, M. Xu, X. Zhao and W. Zhao, RSC Adv., 2015, 5, 100956–100959 RSC.
- Y. Hu, J. Liao, D. Wang and G. Li, Anal. Chem., 2014, 86, 3955–3963 CrossRef CAS PubMed.
- N. Yang, H. Song, X. Wan, X. Fan, Y. Su and Y. Lv, Analyst, 2015, 140, 2656–2663 RSC.
- S. Eyer, N. P. Stadie, L. Emmenegger, A. Borgschulte and J. Mohn, Adsorption, 2014, 20, 657–666 CrossRef CAS.
- C.-D. Wu and W. Lin, Angew. Chem., Int. Ed., 2007, 46, 1075–1078 CrossRef CAS PubMed.
- R. Díaz, M. G. Orcajo, J. A. Botas, G. Calleja and J. Palma, Mater. Lett., 2012, 68, 126–128 CrossRef.
- Z.-Y. Gu and X.-P. Yan, Angew. Chem., Int. Ed., 2010, 49, 1477–1480 CrossRef CAS PubMed.
- N. Chang, Z.-Y. Gu and X.-P. Yan, J. Am. Chem. Soc., 2010, 132, 13645–13647 CrossRef CAS PubMed.
- Y. L. Liu, X. J. Zhao, X. X. Yang and Y. F. Li, Analyst, 2013, 138, 4526–4531 RSC.
- J. F. Guo, C. M. Li, X. L. Hu, C. Z. Huang and Y. F. Li, RSC Adv., 2014, 4, 9379 RSC.
- D. M. Fernandes, A. D. Barbosa, J. Pires, S. S. Balula, L. Cunha-Silva and C. Freire, ACS Appl. Mater. Interfaces, 2013, 5, 13382–13390 CAS.
- H. Hosseini, H. Ahmar, A. Dehghani, A. Bagheri, A. Tadjarodi and A. R. Fakhari, Biosens. Bioelectron., 2013, 42, 426–429 CrossRef CAS PubMed.
- M.-P. N. Bui, X.-H. Pham, K. N. Han, C. A. Li, Y. S. Kim and G. H. Seong, Sens. Actuators, B, 2010, 150, 436–441 CrossRef CAS.
- A. Kumaravel and M. Chandrasekaran, Sens. Actuators, B, 2012, 174, 380–388 CrossRef CAS.
- J. Li, D. Kuang, Y. Feng, F. Zhang, Z. Xu, M. Liu and D. Wang, Biosens. Bioelectron., 2013, 42, 198–206 CrossRef CAS PubMed.
- X. Xia, Z. Zheng, Y. Zhang, X. Zhao and C. Wang, Sens. Actuators, B, 2014, 192, 42–50 CrossRef CAS.
- H. N. Noristani, A. Verkhratsky and J. J. Rodríguez, Aging Cell, 2012, 11, 810–822 CrossRef CAS PubMed.
- M. R. Akhgar, M. Salari and H. Zamani, J. Solid State Electrochem., 2011, 15, 845–853 CrossRef CAS.
- K. M. L. Taylor-Pashow, J. D. Rocca, Z. Xie, S. Tran and W. Lin, J. Am. Chem. Soc., 2009, 131, 14261–14263 CrossRef CAS PubMed.
- Z. Jiang, P. F. Gao, L. Yang, C. Z. Huang and Y. F. Li, Anal. Chem., 2015, 87, 12177–12182 CrossRef CAS PubMed.
- P. Zhang, C. Shao, Z. Zhang, M. Zhang, J. Mu, Z. Guo and Y. Liua, Nanoscale, 2011, 3, 3357–3363 RSC.
- Y. Li, C. Huangfu, H. Du, W. Liu, Y. Li and J. Ye, J. Electroanal. Chem., 2013, 709, 65–69 CrossRef CAS.
- T. Yang, H. Yang, S. J. Zhen and C. Z. Huang, ACS Appl. Mater. Interfaces, 2015, 7, 1586–1594 CAS.
- R. N. Goyal, S. Bishnoi, H. Chasta, M. A. Aziz and M. Oyama, Talanta, 2011, 85, 2626–2631 CrossRef CAS PubMed.
- B. Liu, X. Ouyang, Y. Ding, L. Luo, D. Xu and Y. Ning, Talanta, 2016, 146, 114–121 CrossRef CAS PubMed.
- E. Laviron, J. Electroanal. Chem. Interfacial Electrochem., 1974, 52, 355–393 CrossRef CAS.
- G.-P. Jin and X.-Q. Lin, Electrochem. Commun., 2004, 6, 454–460 CrossRef CAS.
- C.-X. Xu, K.-J. Huang, Y. Fan, Z.-W. Wu, J. Li and T. Gan, Mater. Sci. Eng. C, 2012, 32, 969–974 CrossRef CAS.
- J. Hu, T. Wang, J. Kim, C. Shannon and C. J. Easley, J. Am. Chem. Soc., 2012, 134, 7066–7072 CrossRef CAS PubMed.
- J. Hu, Y. Yu, J. C. Brooks, L. A. Godwin, S. Somasundaram, F. Torabinejad, J. Kim, C. Shannon and C. J. Easley, J. Am. Chem. Soc., 2014, 136, 8467–8474 CrossRef CAS PubMed.
- Y. Fan, J.-H. Liu, H.-T. Lu and Q. Zhang, Microchim. Acta, 2011, 173, 241–247 CrossRef CAS.
- M. Kooshki, H. Abdollahi, S. Bozorgzadeh and B. Haghighi, Electrochim. Acta, 2011, 55, 8618–8624 CrossRef.
- K.-J. Huang, C.-X. Xu, W.-Z. Xie and W. Wang, Colloids Surf., B, 2009, 74, 167–171 CrossRef CAS PubMed.
Footnote |
| † Electronic supplementary information (ESI) available. See DOI: 10.1039/c5ra25251b |
| This journal is © The Royal Society of Chemistry 2016 |

