Fabrication of porous Fe2O3/PTFE nanofiber membranes and their application as a catalyst for dye degradation†
Weimin Kanga,
Fu Lia,
Yixia Zhaob,
Chunmei Qiaoa,
Jingge Jua and
Bowen Cheng*b
aSchool of Textile, Tianjin Polytechnic University, Tianjin, 300387, P. R. China
bState Key Laboratory of Separation Membranes and Membrane Processes, Tianjin, 300387, P. R. China. E-mail: bowen15@tjpu.edu.cn
First published on 24th March 2016
Abstract
Novel porous polytetrafluoroethylene (PTFE) nanofiber membranes containing Fe2O3 (Fe2O3/PTFE), used as a heterogeneous catalyst, were prepared via a three-step method by electrospinning, immersion and calcination. The morphology and structure of porous Fe2O3/PTFE were characterized by scanning electron microscopy (SEM), Fourier transform infrared spectroscopy (FTIR), X-ray photoelectron spectroscopy (XPS) and X-ray diffractometer (XRD). The effects of the thickness of the as-spun nanofiber membrane, the immersion time and impregnating solution concentration on the content of Fe2O3 which was the active component were discussed. The degradation of Acid Red with hydrogen peroxide catalyzed by the porous Fe2O3/PTFE under UV irradiation was investigated. UV-vis and ESR techniques provided an insight into the nature of the degradation products and the formed active species. The results showed that Fe2O3 was successfully supported on the surface of porous PTFE nanofibers. The porous Fe2O3/PTFE nanofiber membrane prepared under the optimized parameters possessed high photocatalytic activity without any dye adsorption and could be recycled by simple filtration.
1. Introduction
Advanced oxidation processes have generated a lot of interest due to their applications in environmental protection recently, in which toxic organic compounds were mineralized by hydroxyl radicals, ideally to CO2, water and other nontoxic small molecules.1 The catalysts directly used in photocatalysis are metallic compound nanoparticles, such as TiO2, ZnO, CuS, GaP and Fe2O3,2–5 which faces the problem of recovery from the liquid after use. Many supports, such as ceramic, activated carbon and zeolite, have been employed to improve the catalyst repeatability.6–8 However, these catalysts have their own limitations such as low surface area and low utilization which limit the application of these catalysts.Electrospinning technology has been used to fabricate various inorganic and organic nanofibers with high specific surface area and various different structures. Although the electrospun nanofibrous metallic compound mentioned above have been used as catalysts,9–12 they still have the limitation of low flexibility. Some organic nanofiber membranes such as polyacrylonitrile (PAN),13,14 polyvinylpyrrolidone (PVP),15–17 polyvinyl acetate (PVAc)18 and cellulose19 are regarded as attractive catalyst supports owing to their excellent characteristics including large surface area, high porosity, good flexibility and high permeability. Unfortunately, the supports may be destroyed by hydroxyl radicals which possess strong oxidizing property and are responsible for the degradation of organic pollutants.20 Thus the development of supports with good resistance to oxidation is a way to prepared high performance heterogeneous catalysis. Polytetrafluoroethylene (PTFE) fibers have been widely used as filters or catalyst supports due to their outstanding thermal, chemical stability, and mechanical properties even under very harsh conditions.21–23 Nevertheless, for the strong fluorocarbon bond, PTFE were seldom used directly as supports for the heterogeneous catalysts.
In this work, we present a new strategy for a high efficient heterogeneous Fenton-like catalyst with Fe2O3 as active species and porous PTFE nanofibers as catalyst supports. The porous Fe2O3/PTFE nanofiber membrane was prepared by electrospinning, followed by simple immersion and calcination. The morphology and chemical information were characterized, and the catalytic behavior was investigated with Acid Red as a model pollutant under different conditions. The influential factors of Fe2O3 content were discussed, as well as the effects of initial H2O2 concentration and pH values on the catalytic behavior. And the degradation process was traced by UV-vis spectrometer.
2. Experimental
2.1 Materials
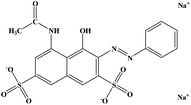
All agents were analytical grade and used without further purification. The PTFE emulsion (60 wt%) was purchased from Zhejiang Transfar Co. Ltd. Polyvinyl alcohol (PVA, MW = 84![[thin space (1/6-em)]](https://www.rsc.org/images/entities/char_2009.gif) 000) was supplied by Sinopec Sichuan vinylon works. Boric acid (BA), ferric chloride (FeCl3), hydrogen peroxide (H2O2), methanol and Acid Red were purchased from Tianjin Kermel Chemical Reagent Co. Ltd. The structure of Acid Red is shown in Scheme 1. Deionized water was used through the whole experiment.
000) was supplied by Sinopec Sichuan vinylon works. Boric acid (BA), ferric chloride (FeCl3), hydrogen peroxide (H2O2), methanol and Acid Red were purchased from Tianjin Kermel Chemical Reagent Co. Ltd. The structure of Acid Red is shown in Scheme 1. Deionized water was used through the whole experiment.
2.2 Preparation of catalyst
Considering that PTFE is hardly dissolved in any solvent, PVA was chosen as assistant spinning due to its water solubility, low cost, easy spinning property and low decomposition temperature. BA used as gel adjusting agent could improve the dispersivity of PTFE in PVA aqueous and was in favor of the electrospinning process. 45 wt% PTFE/PVA/BA spinning solution was prepared by dissolving PTFE emulsion, PVA and BA in deionized water with a weight ratio of 7![[thin space (1/6-em)]](https://www.rsc.org/images/entities/char_2009.gif) :
:![[thin space (1/6-em)]](https://www.rsc.org/images/entities/char_2009.gif) 1
1![[thin space (1/6-em)]](https://www.rsc.org/images/entities/char_2009.gif) :
:![[thin space (1/6-em)]](https://www.rsc.org/images/entities/char_2009.gif) 0.0025 and then was electrospun using the following conditions: the voltage was 30 kV, the work distance was 15 cm, and the flow rate was 2 mL h−1. For the spinning needle swing back and forth far away from the collector (Fig. S1†), the thickness of membrane could be controlled by adjusting electrospinning time simply and was measured with a thickness gauge (Shanghai Chuanlu measure instruments company). The as-spun nanofiber membranes were immersed into 0.2 g mL−1 FeCl3–absolute ethyl alcohol solution for a specified time and subsequently calcined at 390 °C (Fig. S2†) for 10 min. The absolute ethyl alcohol was used as solvent to keep the nanofibrous morphology before calcination. For the content of Fe2O3 was a critical factor to the catalysis performance, the effects of immersion time, impregnating solution concentration and the membrane thickness on the content of Fe2O3 were discussed. The specific surface areas of as-spun and Fe2O3/PTFE nanofiber membranes were determined as 4.50 and 21.92 m2 g−1, respectively (Fig. S3†).
0.0025 and then was electrospun using the following conditions: the voltage was 30 kV, the work distance was 15 cm, and the flow rate was 2 mL h−1. For the spinning needle swing back and forth far away from the collector (Fig. S1†), the thickness of membrane could be controlled by adjusting electrospinning time simply and was measured with a thickness gauge (Shanghai Chuanlu measure instruments company). The as-spun nanofiber membranes were immersed into 0.2 g mL−1 FeCl3–absolute ethyl alcohol solution for a specified time and subsequently calcined at 390 °C (Fig. S2†) for 10 min. The absolute ethyl alcohol was used as solvent to keep the nanofibrous morphology before calcination. For the content of Fe2O3 was a critical factor to the catalysis performance, the effects of immersion time, impregnating solution concentration and the membrane thickness on the content of Fe2O3 were discussed. The specific surface areas of as-spun and Fe2O3/PTFE nanofiber membranes were determined as 4.50 and 21.92 m2 g−1, respectively (Fig. S3†).
2.3 Characterization
The morphology of nanofiber membranes was observed using a S-4800N scanning electron microscope (SEM, Japan Hitachi). The chemical investigation was measured by TENSOR 37 Fourier transform infrared spectroscopy (FT-IR, Germany Bruker) between 500 and 4000 cm−1. The composition was studied by K-alpha X-ray photoelectron spectroscopy (XPS, England ThermoFisher) which has a monochromator AlKα (1486.6 eV) anode source. The crystal phase of the membrane was characterized with D/MAX-2500 X-ray diffractometer (XRD, Japan Rigaku). The Fe2O3 content was calculated by the following eqn (1) based on mass conservation.| W = [(m1 − m0)/m1] × 100% | (1) |
2.4 Photocatalytic degradation experiments
All experiments were conducted in a photoreactor which consists mainly of chamber, irradiation source and water bath. The UV-light irradiation was provided by a 75 W UV lamp. The distance between the light source and the test solution was kept at 30 cm. The porous Fe2O3/PTFE nanofiber membranes cut into 1 × 1 cm2 squares were immersed into 100 mL test solutions containing Acid Red and H2O2. The initial concentration of Acid Red was 0.2 mmol L−1 and the dosage of catalyst was 4 g L−1 in addition to special instructions. The solution was exposed to the irradiation in the photoreactor with continuous magnetic stirring. At different irradiation time intervals, 1–2 mL of the test solution was taken and rapidly measured at the λmax (508 nm) of Acid Red using a UV-2401 Shimadzu spectrophotometer. The decoloration percentage was expressed as eqn (2).| D% = (1 − C/C0) × 100% | (2) |
The reactive oxidation species were trapping with DMPO and determined by a Bruker ESR 300E spectrometer equipped with and irradiation source of Quanta-Ray ND:YAG laser system. The tests were carried out as follows: 0.1 mmol DMPO and 1 mg catalyst was suspended in deionized water/methanol. Then the solution above was injected into the capillary tube and was irradiated for 10 minutes under UV light. The resulting solution was used to be analyzed.
3. Results and discussion
3.1 Characterization of samples
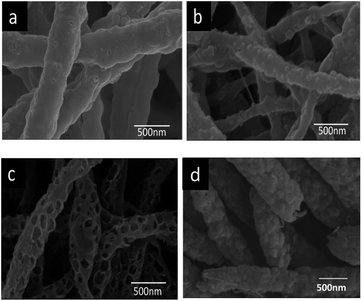
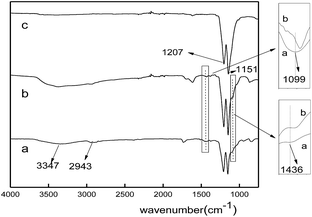
The morphologies of nanofiber membranes were characterized by SEM and the SEM images were shown in Fig. 1. As shown in Fig. 1(a), the as-spun nanofibers had a rough surface, and granular materials appeared on the fibers surface after the immersion in FeCl3–absolute ethyl alcohol solution because of the adsorptive property of nanofiber membranes and the coordination between PVA and Fe3+ (Fig. 1(b)).24 After calcination, porous structure was formed. This could be due to the gas release, which is the decomposition product of FeCl3, as well as a few of FeCl3 particles falling off the fibers during calcination. For comparison the PTFE/PVA nanofiber membrane were calcined. The pure PTFE nanofibers showed much rougher surface than PTFE/PVA nanofibers but nonporous structure. It can be explained as that during the calcination of PTFE/PVA, PVA decomposed and the molten PTFE molecules were consolidated to form a complete nanofiber network. The porous structure could fix the iron oxide on the fibers surface for effective photocatalysis and reuse.The FT-IR spectra of the nanofiber membranes before and after calcination were shown in Fig. 2. All the spectra showed peaks at 1207 cm−1 (C–F) and 1152 cm−1 (C–C), which corresponded to the characteristic peaks of PTFE. For the spectrum of PTFE/PVA, the absorption peaks at 3347 cm−1 (O–H), 2943 cm−1 (C–H), 1436 cm−1 (CH2) and 1099 cm−1 (C–O) were assigned to PVA (curve a). Both the adsorption peaks at 1099 cm−1 and 1436 cm−1 in the spectrum of FeCl3/PTFE/PVA shifted to low wavenumbers because of the coordination between Fe3+ and O atom in PVA (curve b), which was coincident with the literature.25 After calcination PVA was almost removed and Fe3+ was oxidized to iron oxide by the oxygen in air. Then there only existed the characteristic peaks of PTFE.
Fig. 3(a) showed the XPS survey spectra of the above three nanofiber membranes to further study the species change during the preparation. It can be seen that there were five mainly characteristic peaks of C, F, O, Fe, and Cl in the whole region. For the high-resolution spectra of Fe2p (Fig. 3(b)), both the spectra of FeCl3/PTFE/PVA and Fe2O3/PTFE contained two peaks at binding energy position of 711.3 eV and 724.6 eV which are corresponding to the characteristic peaks of Fe2p3/2 and Fe2p1/2 respectively. These demonstrated the existence of Fe3+. And there were no peaks in the spectrum of PTFE/PVA nanofiber membrane. As shown in Fig. 3(c) on the curve-fitting results of Cl2p in FeCl3/PTFE/PVA nanofiber membrane, the peaks at 199.0 eV and 200.5 eV corresponded to the Cl2p1/2 and Cl2p3/2 in Cl−. The Cl2p peak intensity decreased greatly after calcination because of the FeCl3 decomposition.
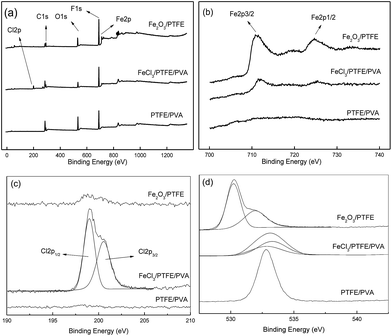 | ||
| Fig. 3 XPS spectra of fiber membranes: (a) full spectrum, (b) Fe2p scan, (c) Cl2p scan and (d) O1s scan. | ||
The O1s high-resolution spectra were shown in Fig. 3(d). For the as-spun nanofiber membrane, the binding energy of O1s was at 528 eV which belonged to the O element in PVA. After immersion the O1s spectrum consisted of two O1s peaks. The peak at 532.8 eV and 533.3 eV were assigned to the O elements coordinating without and with Fe3+ respectively. For the porous Fe2O3/PTFE nanofiber the O1s spectrum consisted of two O1s peaks. High intensity peak at 530.2 eV was assigned to oxide, and low intensity peak at 532 eV formed from hydroxyl.26 These results proved that FeCl3 adsorbed and coordinated on the nanofiber had transformed into Fe2O3 during the calcination of FeCl3/PTFE/PVA membrane, consistent with the results of FTIR.
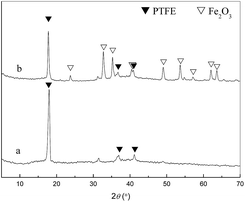
The XRD spectra of the membrane were given in Fig. 4. The characteristic peaks of PTFE at 17.76 (strong), 31.80 (weak) and 37.15° (weak) which were attributed to (1 0 0), (1 1 0) and (1 0 7) diffraction planes were less intensive after calcination. The appeared peaks at 2θ = 23.79°, 32.74°, 35.24°, 40.95°, 49.02°, 53.66°, 57.16°, 62.02° and 63.67° in the spectra of Fe2O3/PTFE, corresponding to the (0 1 2), (1 0 4), (1 1 0), (1 1 3), (0 2 4), (1 1 6), (0 1 8), (2 1 4) and (3 0 0) diffraction planes of α-Fe2O3 indicated that the iron ions had switched to α-Fe2O3 after calcination.27
3.2 Fe2O3 content
The content of Fe2O3 was an important factor for the catalysis efficiency, and the effects of some factors on the contents of Fe2O3 were discussed, such as the thickness of the as-spun PTFE/PVA nanofiber membrane, the immersion time and impregnating solution concentration.Three thickness membranes were chosen to prepare the porous Fe2O3/PTFE nanofiber membranes and the Fe2O3 contents were listed in Table 1. It can be seen that the Fe2O3 content decreased with as-spun membranes thicknesses. It was due to that the increase of the membrane thickness increased the resistance of the FeCl3 into the internal membrane, resulting less absorbed FeCl3 which means less source of iron. However, the membrane was easily broken during the magnetic stirring when the thickness was too low. On the other hand, the broken membrane made the recycling difficult. Then the thickness of membranes was kept at 45 μm considering the balance between the Fe2O3 content and the strength of membrane.
| Thickness/μm | 45 | 125 | 190 |
| Fe2O3 content/% | 13.44 | 11.63 | 4.88 |
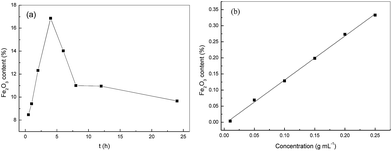
During immersion metal salts which were the active components were adsorbed onto the supporter and permeated into the inner surface of the supporter in the form of salt solution. After post treatment which was calcination in the present work the catalysts were synthesized. The immersion time was the control step during immersion process. From the data that in Fig. 5(a) it was clearly seen that the Fe2O3 content increased significantly with prolonging immersion time and reached the maximum at 4 h. With further increasing immersion time, the Fe2O3 content decreased straightly because of the PVA dissolution in absolute ethyl alcohol. The PVA was the assistant spinning solution, and its dissolution led to bad morphology of PTFE nanofiber, even hardly keeping the fibrous form. Therefore, 4 h was chosen as the optical immersion time.
The concentration of the impregnating solution had impact on the metal salt adsorption which may further affected the catalytic performance and other properties such as the content of active components and load state. Fig. 5(b) showed the changes of Fe2O3 content with the concentration of FeCl3 solution. It was obvious the Fe2O3 content increased linearly with a correlation coefficient of 0.9986. It should be stated that the too high FeCl3 concentration resulted in closely packed Fe2O3 particles after calcination which may blocked some pores. The decreased porosity and specific surface area maybe hinder the collision of H2O2 and catalyst during the photocatalysis, resulting in low catalysis efficiency. On the other hand, too high Fe2O3 content may lead to low strength. Hence, the FeCl3 concentration was kept at 0.2 g mL−1 to balance the catalytic property, material strength, cost and environmental conservation.
3.3 Catalytic behaviour
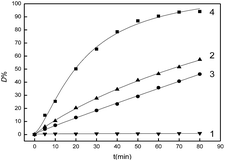
To study the catalytic behavior of the porous Fe2O3/PTFE nanofiber membranes as a heterogeneous Fenton-like catalyst, the Acid Red degradation with H2O2 catalyzed by the porous Fe2O3/PTFE nanofiber membranes was carried out under various conditions.It can be seen from curve 1 in Fig. 6, the D% value was almost unchanged when there was only Fe2O3/PTFE nanofiber membranes in the dye solution during the study period, which indicated that there was little dye degradation occurring due to the fast electro–hole recombination rate of Fe2O3 in the absence of H2O2. In the second control experiment, 20 mmol L−1 H2O2 was added into the dye solution. Dye degradation was obvious because of the oxidation of hydroxyl radicals which were product of H2O2 decomposition under UV light. It should be stated that the D% was no more than 60% within the study period (Fig. 6, curve 2). In the third control experiment, 20 mmol L−1 H2O2 and 4 g L−1 porous Fe2O3/PTFE nanofiber membranes were added into the dye solution and the reaction was conducted in the dark. Compared with the first control experiment, it could be found that about 40% of Acid Red was degraded ((Fig. 6, curve 3)). The decrease of D% could be attributed to the absence of UV light. In the fourth control experiment, it was clearly found that the D% values increased significantly with prolonging the reaction time when H2O2, porous Fe2O3/PTFE nanofiber membranes and UV light were introduced. And the D% value was close to 99% within 80 min (Fig. 6, curve 4). These results suggested porous Fe2O3/PTFE nanofiber membranes exhibited high photocatalytic activity.
To reveal the reaction mechanism, spin-tripping ESR was used to obtain information on active radicals involved (Fig. 7). When Fe2O3/PTFE was used as the catalyst, the characteristic peaks of DMPO–˙OH adducts clearly appeared and increased with the prolongation of reaction time. This result confirmed that ˙OH radicals have been formed in the presence of Fe2O3/PTFE during the reaction. Moreover, a possible involvement of ˙OOH radicals in the system was also investigated in methanol solution, because of the unstability of ˙OOH radicals in water. The observation of the characteristic peaks of DMPO–˙OOH adducts indicated that ˙OOH radicals formed during the degradation. The possible process is expressed by eqn (3)–(5).
| Fe2O3 + H2O2 → ˙OOH + H+ | (3) |
| ˙OOH + H2O2 → H2O + ˙OH + O2 | (4) |
| ˙OH + H2O2 → H2O + ˙OOH | (5) |
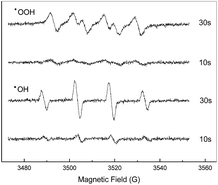 | ||
| Fig. 7 DMPO spin-trapping ESR spectra recorded in aqueous (for DMPO–˙OH) and methanol solution (for DMPO–˙OOH) in the degradation of Acid Red in the presence of H2O2 and Fe2O3/PTFE. | ||
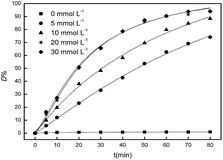
Hydroxyl radical, which was the product of H2O2 decomposition, was responsible for the catalytic degradation. The effect of the initial concentration of H2O2 on the catalysis to the degradation of Acid Red was conducted by varying the initial H2O2 concentration from 0 to 30 mmol L−1. 0.4 g porous Fe2O3/PTFE was immersed into test solutions with different H2O2 concentrations and the D% values was surveyed. It can be observed from Fig. 8 that the D% values of Acid Red increased with the initial concentration of H2O2 from 0 to 20 mmol L−1, indicating that the increase initial concentration of H2O2 favored the degradation of Acid Red. This could be due to the large amount of hydroxyl radical from the products of H2O2 decomposition. However, the enhancement of D% values was level off when the initial H2O2 concentration exceeded 20 mmol L−1. That was mainly caused by the scavenging effect of excessive H2O2 to hydroxyl radicals,28 which can be expressed as the eqn (6) and (7). It should be stated that the D% values were almost unchanged with the absence of H2O2, suggesting there was no dye adsorption on the porous Fe2O3/PFTE. The non-viscosity of PTFE decelerate the dyes removal, however, it may avoid pores being blocked by the intermediate product during the degradation.
| H2O2 + ˙OH → ˙OOH + H2O | (6) |
| ˙OOH + ˙OH → H2O + O2 | (7) |
The effect of initial pH values on the catalysis to the degradation of Acid Red was investigated and the results were shown in Fig. 9. It was clearly observed that the dye degradation occurred over a wide range of pH values from 3 to 9, and D% value reached the maximum value of 94.03% at pH 6 within 80 min. On the other hand, the Fe2O3/PTFE exhibited a higher catalytic activity at acidic medium than at alkaline medium. This can be attributed to that the hydroxyl radicals were easily captured by H+ in acidic or neutral environment. Whilst H2O2 decomposed fast in the alkaline medium hindering the formation of hydroxyl radical which is responsible for the degradation of dye.29
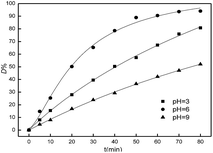 | ||
| Fig. 9 Effect of the pH on D% values ([H2O2] = 20 mmol L−1, [Fe2O3/PTFE] = 4 g L−1, and [Acid Red] = 0.2 mmol L−1). | ||
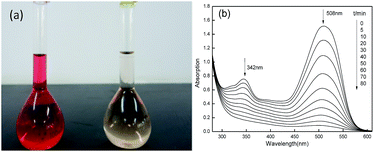
The changes of the UV-vis spectra of Acid Red during the degradation were traced and given in Fig. 10. In the UV-vis spectra, Acid Red showed two maximum absorption peaks which were at 508 nm and 342 nm before degradation and the color of dye solution was bright red. With prolonging time the peaks at maximum adsorption weakened gradually and even disappeared finally. At the same time dye solution became light-yellow color at 80 min. The adsorption peak at 508 nm was corresponding to the N![[double bond, length as m-dash]](https://www.rsc.org/images/entities/char_e001.gif) N conjugated chromophore group and the adsorption peak at 342 nm were corresponding to the naphthalene nucleus. The decrease trends of the two adsorption peaks indicated the cleavage of conjugated structure and the destruction of naphthalene nucleus, suggesting the powerful oxidation ability of Fe2O3/PTFE nanofiber membrane/H2O2/UV light. It should be stated that the destruction of naphthalene nucleus were almost finished at 50 min, faster than the cleavage of conjugated structure. These results further proved that the porous Fe2O3/PTFE nanofiber membrane was an efficient photocatalyst for azo dye.
N conjugated chromophore group and the adsorption peak at 342 nm were corresponding to the naphthalene nucleus. The decrease trends of the two adsorption peaks indicated the cleavage of conjugated structure and the destruction of naphthalene nucleus, suggesting the powerful oxidation ability of Fe2O3/PTFE nanofiber membrane/H2O2/UV light. It should be stated that the destruction of naphthalene nucleus were almost finished at 50 min, faster than the cleavage of conjugated structure. These results further proved that the porous Fe2O3/PTFE nanofiber membrane was an efficient photocatalyst for azo dye.
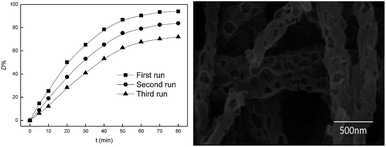
To investigate the stability of Fe2O3/PTFE, the used catalysts were thoroughly washed with distilled water after each run, and Acid Red and H2O2 were added before the next run. The catalysts were reused up to three times and the degradation results and the SEM image of Fe2O3/PTFE after three runs were shown in Fig. 11. Fig. 11 showed that the catalytic activity of Fe2O3/PTFE lost significantly after each cycle. The reason may be the intermediate blocked the pores and prevented the H2O2 from the active sites.30 Even though the appearance of Fe2O3/PTFE had no change, some nanofiber broken after recycling (Fig. 11) due to the magnetic stirring.
4. Conclusion
In summary, PTFE/PVA composite nanofiber membranes were prepared by electrospinning, and then porous Fe2O3/PTFE nanofiber membranes were obtained successfully through immersion and calcination. The porous Fe2O3/PTFE exhibited high photocatalytic activity for the degradation of dye Acid Red under UV light irradiation. Under optimal conditions, the degradation efficiency of Acid Red was above 99% with UV irradiation and H2O2 within 80 min and the porous Fe2O3/PTFE nanofiber membranes can be used over a wide range of pH values. After three recycling the catalytic efficiency maintained the 70% of the first run. These facts suggest that the porous Fe2O3/PTFE nanofiber membranes possess the potential to be an ideal heterogeneous photocatalyst.Acknowledgements
This work was supported by National Natural Science Foundation of China (51102178) and Tianjin Science & Technology Fund Planning Project (No. 14TXGCCX00014, 14ZXCXGX00776) and supported by the Program for Changjiang Scholars and Innovative Research Team in University (PCSIRT) of Ministry of Education of China (Grant no. IRT13084).References
- E. Casbeer, V. K. Sharma and X. Z. Li, Sep. Purif. Technol., 2012, 87, 1–14 CrossRef CAS.
- M. Katoh, H. Aihara, T. Horikawa and T. Tomida, J. Colloid Interface Sci., 2006, 298, 805–809 CrossRef CAS PubMed.
- G. D. Nie, Z. C. Li, X. F. Lu, J. Y. Lei, C. C. Zhang and C. Wang, Appl. Surf. Sci., 2013, 284, 595–600 CrossRef CAS.
- G. H. Wang, F. Wu, X. Zhang, M. D. Luo and N. S. Deng, J. Photochem. Photobiol., A, 2006, 179, 49–56 CrossRef CAS.
- M. A. Behnajady, N. Modirshahla and R. Hamzavi, J. Hazard. Mater., 2006, 133, 226–232 CrossRef CAS PubMed.
- F. Sunada and A. Heller, Environ. Sci. Technol., 1998, 32, 282–286 CrossRef CAS.
- A. K. Subramani, K. Byrappa, S. Ananda, K. M. L. Rai, C. Ranganathaiah and M. Yoshimura, Bull. Mater. Sci., 2007, 30, 37–41 CrossRef CAS.
- I. Fatimah, E. Sugiharto, K. Wijaya, I. Tahir and K. Kamalia, Indones. J. Chem., 2010, 6, 38–42 Search PubMed.
- J. Y. Park, J. H. Lee, D. Y. Choi, C. H. Hwang and J. W. Lee, Mater. Lett., 2012, 88, 156–159 CrossRef CAS.
- S. J. Doh, C. Kim, S. G. Lee, S. J. Lee and H. Kim, J. Hazard. Mater., 2008, 154, 118–127 CrossRef CAS PubMed.
- W. Li, S. Zhao, B. Qi, Y. Du, X. H. Wang and M. X. Huo, Appl. Catal., B, 2009, 92, 333–340 CrossRef CAS.
- R. Sahay, J. Sundaramurthy, P. S. Kumar, V. Thavasi, S. G. Mhaisalkar and S. Ramakrishna, J. Solid State Chem., 2012, 186, 261–267 CrossRef CAS.
- S. I. Ji, I. K. Min and Y. S. Lee, Mater. Lett., 2008, 62, 3652–3655 CrossRef.
- X. T. Zhao, Y. C. Dong, B. W. Cheng and W. M. Kang, Int. J. Photoenergy, 2013, 563–564 Search PubMed.
- X. N. Liu, Q. F. Lu and J. H. Liu, J. Alloys Compd., 2016, 662, 598–606 CrossRef CAS.
- X. N. Liu, Q. F. Lu, C. F. Zhu and S. W. Liu, RSC Adv., 2015, 5, 4077 RSC.
- X. N. Liu, Q. F. Lu, M. Z. Wei, C. Q. Wang and S. W. Liu, Chem.–Asian J., 2015, 10, 1710–1716 CrossRef CAS PubMed.
- A. R. Unnithan, N. A. M. Barakat, R. Nirmala, S. S. Al-Deyab and H. Y. Kim, Ceram. Int., 2012, 38, 5175–5180 CrossRef CAS.
- S. L. Chen, X. J. Huang and Z. K. Xu, Cellulose, 2012, 19, 1351–1359 CrossRef CAS.
- S. Parra, I. Guasaquillo, O. Enea, E. Mielczarski, J. Mielczarki, P. Albers, L. Kiwi-Minsker and J. Kiwi, J. Phys. Chem. B, 2003, 107, 7026–7035 CrossRef CAS.
- M. C. Zhang, E. T. Kang, K. G. Neoh and K. L. Tan, Langmuir, 2000, 16, 9666–9672 CrossRef CAS.
- S. Y. Wu, E. T. Kang, K. G. Neoh, H. S. Han and K. L. Tan, Macromolecules, 1998, 32, 186–193 CrossRef.
- Z. Z. Ding, Y. C. Dong and B. Li, Int. J. Photoenergy, 2012, 2012, 119–135 CrossRef.
- Z. C. Wu, Y. D. Zhang, P. G. Chen, K. Zhou and T. X. Tao, Chin. J. Appl. Chem., 2008, 25, 669–672 CAS.
- H. Zhang, J. F. Wei, H. T. Wang, L. J. Mu and F. L. Yan, Adv. Mater. Res., 2010, 129–131, 430–434 CrossRef CAS.
- M. Omran, T. Fabritius, A. M. Elmahdy, N. A. Abdel-Khalek, M. El-Aref and A. E.-H. Elmanawi, Appl. Surf. Sci., 2015, 345, 127–140 CrossRef CAS.
- C. Wang and Z. X. Huang, Mater. Lett., 2016, 164, 194–197 CrossRef CAS.
- M. Muruganandham and M. Swaminathan, Dyes Pigm., 2004, 62, 269–275 CrossRef CAS.
- Y. C. Dong, L. C. He, C. H. Li, B. H. Zhang and H. X. Zhu, J. Sichuan Univ., Eng. Sci. Ed., 2005, 37, 49–53 CAS.
- L. Wang, Y. Y. Yao, Z. H. Zhang, L. J. Sun, W. Y. Lu, W. X. Chen and H. X. Chen, Chem. Eng. J, 2014, 251, 348–354 CrossRef CAS.
Footnote |
| † Electronic supplementary information (ESI) available. See DOI: 10.1039/c5ra27879a |
| This journal is © The Royal Society of Chemistry 2016 |

