Design and fabrication of carbonized rGO/CMOF-5 hybrids for supercapacitor applications†
Ping Wenab,
Zhangpeng Li*a,
Peiwei Gongc,
Jinfeng Sunc,
Jinqing Wang*a and
Shengrong Yanga
aState Key Laboratory of Solid Lubrication, Lanzhou Institute of Chemical Physics, Chinese Academy of Sciences, Lanzhou, 730000, P. R. China. E-mail: zhangpengli@licp.cas.cn; jqwang@licp.cas.cn; Fax: +86 931 8277088; Tel: +86 931 4968076
bDepartment of Chemistry and Chemical Engineering, Baoji University of Arts and Sciences, Baoji, Shaanxi 721013, P. R. China
cUniversity of Chinese Academy of Sciences, Beijing 100080, P. R. China
First published on 22nd January 2016
Abstract
A reduced graphene oxide/carbonized metal–organic framework (rGO/CMOF-5) hybrid with an rGO inner layer and an outer cover of CMOF-5 was successfully fabricated by combining a simple solvothermal reaction with an annealing treatment. The resulting rGO/CMOF-5 hybrid had a high specific surface area (2040 m2 g−1) and a reasonable porous structure and showed improved electrochemical performance when used as a novel supercapacitor electrode material. Electrochemical tests showed that the rGO/CMOF-5 hybrid achieved an impressive specific capacitance of 312 F g−1 at a current density of 0.5 A g−1 in an alkaline electrolyte and an outstanding cycle stability (retaining 89% capacitance after 5000 cycles) and favorable rate capability with 59% retention after a 40-fold increase. A symmetrical supercapacitor based on the rGO/CMOF-5 hybrid delivered a high energy density of 17.2 W h kg−1 at a power density of 250 W kg−1 and retained 81% of its initial capacitance at a current density of 2 A g−1 after 5000 charge–discharge cycles. These results indicate that this hybrid could be used in electrochemical energy storage and gave new insights into the design and utilization of aged carbon materials with remarkable performances.
1. Introduction
Investigations of carbon materials derived from calcining grains, sugars, polymers, plants and metal–organic framework (MOF) precursors for use in supercapacitors have attracted considerable interest as a result of their ready availability, easy operation and good results.1–6 Among the various precursors, MOFs, despite the additional fabrication stage required, are considered to be the most promising precursors from which to construct nanoporous carbon with novel structures and properties as a result of their diverse structures and functions that can be tailored to particular applications.7–9 Zn-based MOFs (MOF-5), Al-based porous coordination polymers and zeolitic imidazolate framework-8 precursors have been demonstrated to yield highly nanoporous carbon, showing excellent performance in, for example, gas adsorption, supercapacitors, sensing and catalysis.10–13 The carbon materials derived from MOFs not only retain the nanoporous and topological structures of the precursors, but also have high porous volumes and specific surface areas, which favor access by electrolyte ions and their transport to generate superior specific capacitance properties.14–16 Liu et al.17 used the pyrolysis of MOF-5 to prepare nanoporous carbon with a Brunauer–Emmet–Teller (BET) surface area of 2872 m2 g−1 and a pore volume of 2.06 cm3 g−1, which delivered a specific capacitance of 204 F g−1 at a sweep rate of 5 mV s−1. Chaikittisilp et al.15 prepared N-doped nanoporous carbon through the calcination of zeolitic imidazolate framework-8. The carbon had a surface area of 1110 m2 g−1 and a pore volume of 0.62 cm3 g−1; the specific capacitance was 214 F g−1 at a scan rate of 5 mV s−1. Aiyappa et al.18 investigated several kinds of porous carbon prepared by the thermolysis of various Zn-based MOF precursors, obtaining a maximum surface area of 1378 m2 g−1 with a specific capacitance of 170 F g−1 at a current density of 1 A g−1. Despite these advantages, the poor electrical conductivity and collapse of pores during the charge–discharge cycle decreased the charge transfer and undermined the specific capacitance and durability. Thus efforts are still being made to improve the performance of MOF-derived carbons to attain their potential applications.Graphene, a two-dimensional carbon with a high surface area, excellent electrical conductivity, intriguing mechanical properties and superior chemical stability, is one of the most promising active materials for electrochemical energy storage applications such as lithium ion batteries, supercapacitors, solar cells and fuel cells.19–23 However, the agglomeration or re-stacking of graphene sheets during processing severely reduces the surface area accessible to the electrolyte, leading to inferior capacitive properties.24 To address this issue, composites or hybrids based on a graphene matrix have been fabricated using porous carbon nanospheres, carbon nanotubes and metal oxide nanoparticles as guest molecules.25–28 The results indicated that the incorporation of guest materials effectively suppressed the agglomeration of the graphene or rGO sheets and also improved the electrical and mechanical properties of the guest materials.
We synthesized a graphene oxide/MOF-5 composite (GO/MOF-5) by a solvothermal reaction and then annealed it to obtain an all-carbon hybrid of reduced graphene oxide/carbonized MOF-5 (rGO/CMOF-5) for use in supercapacitor electrode materials. All-carbon nanostructures integrating rGO with CMOF-5 have rarely been reported. In this study, GO was used as struts to build up the MOF-5 structure. The abundant and various oxygen-containing groups on either side and/or the edge of the GO sheets offered sites to anchor Zn2+ as an integral component of the MOF-5 framework and resulted in bifunctional properties in the third dimension.29 After annealing, the rGO layers embedded inside the hybrid structure served as an excellent mini-current collector and long-distance charge transporter to boost the electrochemical performance of CMOF-5 based on the high electrical conductivity and electron transport properties.
2. Experimental
2.1 Fabrication of rGO/CMOF-5 hybrid
The GO was fabricated according to the modified Hummers' method.30 Scheme 1 shows the strategy used to fabricate the rGO/CMOF-5 hybrid. In a typical procedure, 12 mg of GO were ultrasonically dispersed in 60 mL of DMF and then 520 mg of Zn(NO3)2·6H2O and 100 mg of 1,4-dicarboxybenzene (C8H6O4), used as the metal salt and the organic linker, respectively, were added to the dispersion. The mixture was sonicated for 30 min to ensure the dissolution of the salts and then transferred into a 70 mL Teflon-lined stainless-steel autoclave and stored at 120 °C for 24 h. After cooling naturally, the black precipitate was collected, rinsed with ethanol and deionized water and freeze-dried. The as-obtained composite was then placed into a quartz boat and heated to 1000 °C at a heating rate of 5 °C min−1 under an Ar flow and stored for 3 h. After cooling down to room temperature, the black powder was collected and labeled as rGO/CMOF-5. For comparison, individually annealed CMOF-5 and rGO were also fabricated using the same procedure.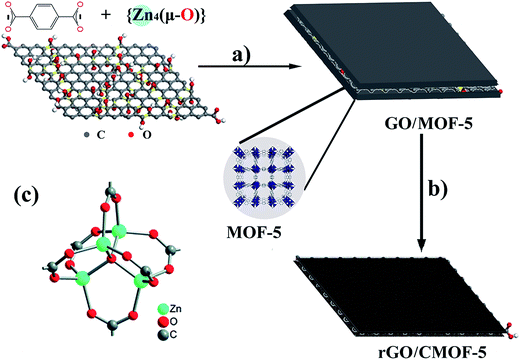 | ||
| Scheme 1 Preparation of rGO/CMOF-5 composite. (a) Solvothermal treatment in DMF medium at 120 °C for 24 h; (b) annealing at 1000 °C for 3 h; and (c) secondary building units of pure MOF-5. | ||
2.2 Characterization
The morphologies of the samples were characterized by transmission electron microscopy (TEM; FEI Tecnai G2 F20) at 200 kV and field-emission scanning electron microscopy (FESEM; JEOL JSM-6701F, Japan) at an acceleration voltage of 5 kV. The crystallographic structure of the sample was analyzed by X-ray diffraction (XRD; Rigaku D/Max-2400 diffractometer using Cu Kα radiation and a graphite monochromator, λ = 1.54056 Å) over the 2θ range 5–80°. Raman spectrometry was carried out using a Renishaw Raman microscope with the 633 nm line of an Ar ion laser as the excitation source. Nitrogen adsorption–desorption measurements were conducted using a Micromeritics ASAP 2020 apparatus. Specific surface areas were determined by BET analysis.2.3 Electrochemical measurements
All the electrochemical characterizations were performed in a standard three-electrode system controlled by a CHI 660C electrochemical workstation. The working electrodes were fabricated by mixing the as-prepared rGO/CMOF-5 composite (4 mg), acetylene black and polytetrafluoroethylene (PTFE, 1 wt%) at a mass ratio of 85![[thin space (1/6-em)]](https://www.rsc.org/images/entities/char_2009.gif) :
:![[thin space (1/6-em)]](https://www.rsc.org/images/entities/char_2009.gif) 10
10![[thin space (1/6-em)]](https://www.rsc.org/images/entities/char_2009.gif) :
:![[thin space (1/6-em)]](https://www.rsc.org/images/entities/char_2009.gif) 5. The mixture was ground to form a slurry, followed by coating onto stainless steel, and was then dried under vacuum at 60 °C for 24 h, after which it was compressed at 10 MPa. A Pt foil and a saturated Ag/AgCl electrode were used as the counter and reference electrodes, respectively. A 6 M aqueous solution of KOH was used as the electrolyte. Cyclic voltammograms were recorded in the range 0 to −1 V at various scan rates. Galvanostatic charge/discharge (GC) was carried out at various current densities in the same voltage range. The specific capacitance derived from the GC curves was calculated based on the equation:
5. The mixture was ground to form a slurry, followed by coating onto stainless steel, and was then dried under vacuum at 60 °C for 24 h, after which it was compressed at 10 MPa. A Pt foil and a saturated Ag/AgCl electrode were used as the counter and reference electrodes, respectively. A 6 M aqueous solution of KOH was used as the electrolyte. Cyclic voltammograms were recorded in the range 0 to −1 V at various scan rates. Galvanostatic charge/discharge (GC) was carried out at various current densities in the same voltage range. The specific capacitance derived from the GC curves was calculated based on the equation:| Cg = (IΔt)/(mΔV) |
3. Results and discussion
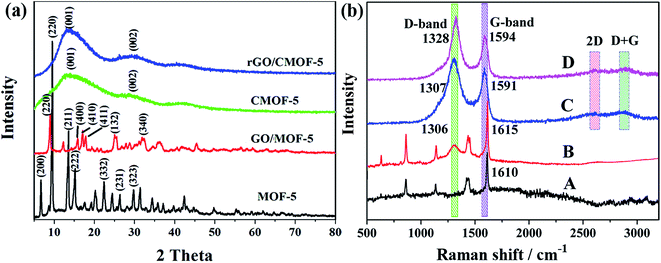
XRD analyses were performed to investigate the crystal phase of the samples. Fig. 1a shows that the XRD pattern for MOF-5 is consistent with that reported previously.31 A slight left shift of the major peaks was observed in the GO/MOF-5 composite, implying that the bond lengths were longer than in MOF-5; however, there was no destruction of the MOF-5 framework on the introduction of GO.32 The important diffraction peaks at 6.7, 9.6 and 13.6° were indexed to the (200), (220) and (211) planes of MOF-5, respectively.33 Similar peak profiles were observed for CMOF-5 and the rGO/CMOF-5 hybrid and these were different from the peaks of the precursors. The diffraction peak at 13° was ascribed to the (001) phase of graphite carbon, corresponding to the interlayer space of the CMOF-5 lamellar flakes, and the peaks at about 26 and 43° were indexed to the (002) and (100) diffractions of typical graphite carbon.34 No diffraction peak corresponding to ZnO and/or Zn impurities was observed, supporting the all-carbon character of the samples.Raman spectra were recorded to investigate the nature of the carbon in the samples. Fig. 1b shows a typical aryl carbon skeleton vibration peak at 1610 cm−1 for MOF-5,35 whereas a distinct D band featuring the disordered carbon of GO was observed at 1306 cm−1 in GO/MOF-5; the G band overlapped with the aryl carbon skeleton vibration peak of MOF-5. As expected, both the D and G bands were clearly seen for CMOF-5 and the rGO/CMOF-5 hybrid, along with minor 2D and D + G peaks, further suggesting that the hybrid had the features of carbon. The intensity ratio of the D and G band (ID/IG) was established to quantify the defects in the carbon of CMOF-5 and the rGO/CMOF-5 hybrid.36 The ID/IG of CMOF-5 and the rGO/CMOF-5 hybrid were 2.1 and 1.9, respectively, indicating that the latter had a lower density of defects than the former due to the introduction of rGO with an ID/IG of 1.4 (Fig. S1†).
SEM and TEM were used to further analyze the microstructure of the samples. Fig. S2 and S3† show that the GO had a 2D sheet-like structure with transparent and flexible features, whereas the MOF-5 consisted of irregular lamellar flakes. Fig. 2a shows an SEM image of the GO/MOF-5 hybrid; it is obvious that the hybrid was composed of a large quantity of flakes with the flexible features of GO. The visible surfaces appear glossy with very few aggregated particles, indicating that the MOF-5 was compact and uniform on the surface of the GO sheets. The TEM image in Fig. 2c further reveals the integration of GO with MOF-5. The SEM image (Fig. 2b) clearly shows the wrinkled and smoothed rGO layer after annealing and the heterogeneous lamellar CMOF-5 layer. These can also be seen in the TEM image (Fig. 2d), where the rGO layer is distinctly visible along the edge of rGO/CMOF-5 hybrid as a result of the shrinkage of the CMOF-5 skeleton during annealing; CMOF-5 was distributed on both sides of the rGO. The higher magnification TEM image (Fig. S4†) shows the visible nanopores in the CMOF-5 skeleton, which efficiently improved electrolyte transport into the spacing between nanoparticles. The selected-area electron diffraction patterns (inset, Fig. 2d) show the typical characteristics of an amorphous phase, with faint broad rings at low degrees of light, suggesting that CMOF-5 is dominant in the hybrid.
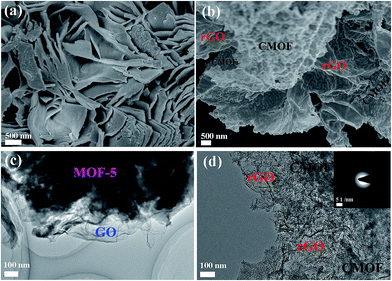 | ||
| Fig. 2 SEM images of (a) GO/MOF-5 and (b) rGO/CMOF-5. TEM images of (c) GO/MOF-5 and (d) rGO/CMOF-5. The inset in (d) is the corresponding SAED image. | ||
The composition and average amount of each element (carbon, oxygen, and zinc) of the as-prepared MOF-5, GO/MOF-5 and rGO/CMOF-5 samples were determined by energy-dispersive X-ray spectrometry (Fig. S5†). Fig. S5a† indicates that pure MOF-5 consists of carbon, oxygen and zinc in addition to copper derived from the micro-grid. After processing, the percentage of zinc in the composite increased as a result of some zinc ions coordinating with oxygen on the surface of the GO, resulting in no perfect secondary building units of MOF-5 on the surface (Fig. S5b†). Only carbon is observed in Fig. S5c,† in addition to a little oxygen, without any evidence of zinc. This is because the ZnO generated from zinc ions along with the formation of the carbonaceous materials can be reduced to Zn metal with a low boiling point (ZnO + C → Zn + CO↑). This is then evaporated at temperatures >907 °C, resulting in the formation of porous carbon with a high surface area.37 The insets in Fig. S5a–5c† show the corresponding weight percentages of carbon, oxygen, zinc and copper. Fig. S5d† shows histograms for carbon, oxygen and zinc.
The BET specific surface area and pore structure of rGO/CMOF-5 hybrid were studied by nitrogen adsorption–desorption analysis. Fig. 3a shows type IV nitrogen adsorption–desorption isotherm curves with H3-type hysteresis loops at relative pressures of 0.4–1.0, implying that the system consisted of approximately uniform layers; the BET specific surface area was 2040 m2 g−1. The pore size distribution curve (Fig. 3b) calculated from the adsorption isotherm using the Barrett–Joyner–Halenda method shows mesoporous features in the hybrid with a narrow pore diameter distribution of 3.6 nm stemming from the CMOF-5 structure.17 A broad region was thought to be constructed from the overlap of the hybrid sheets and the lamellar flakes of CMOF-5. The nitrogen adsorption–desorption isotherm curves and pore diameter distribution of CMOF-5 are shown in Fig. S6.†
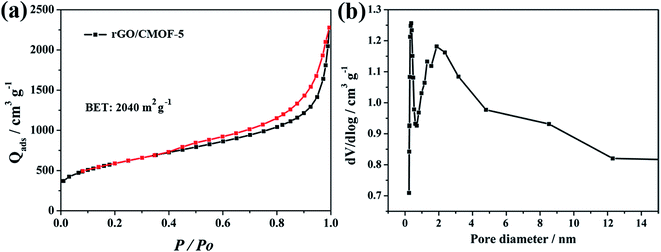 | ||
| Fig. 3 (a) Nitrogen adsorption–desorption isotherm of rGO/CMOF-5 at 77.3 K; (b) pore size distribution curve calculated from the adsorption isotherm. | ||
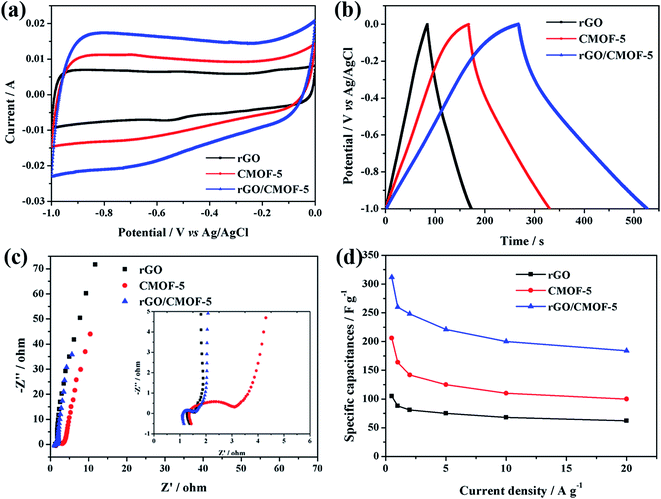
The electrochemical properties of rGO, CMOF-5 and rGO/CMOF-5 were evaluated by cyclic voltammetry (CV) and GC measurements to determine their suitability as electrode materials for supercapacitors. Fig. 4a shows typical CV curves of diverse electrode materials at a scan rate of 40 mV s−1. In contrast with the nearly rectangular shape of rGO, CMOF-5 and rGO/CMOF-5 showed trapezoid-shaped CV curves, indicating the existence of a small amount of pseudocapacitance originating from the residual oxygen groups.38 It can also be seen that the enclosed area of the CV curve from the rGO/CMOF-5 electrode has the largest area, indicating an improved electrochemical performance. The specific capacitance of the rGO/CMOF-5, CMOF-5 and rGO samples calculated from the CV curves were 265, 158 and 92 F g−1, respectively, at a scan rate of 40 mV s−1. The GC curves of the electrode materials were recorded at a current density of 1 A g−1 (Fig. 4b). The symmetrical configuration with a slight curvature was in agreement with the observations from the CV curves and showed a dominant electrical double-layer capacitive behavior. To further understand the capacitive behavior of these electrode materials, EIS was carried out at the open circuit potential in the frequency range 100 kHz to 10 mHz. Fig. 4c shows that all the Nyquist plots consist of the following three parts: the intersection on the x-axis related to the internal resistance of the electrode (Rs); a semicircle in the high-frequency region corresponding to the charge transfer resistance (Rct); and a linear section in the low-frequency region representing typical capacitor-like behavior. The axis intercept of the rGO/CMOF-5 hybrid indicates its good conductivity. The semicircle for CMOF-5 in the high-frequency region indicates that it has a much higher resistance to charge propagation at the interface between the electrode and electrolyte, reflecting the poor conductivity of CMOF-5. The nearly vertical line in the low-frequency region indicates the ideal capacitor behavior of the rGO/CMOF-5 hybrid. These results indicate that the rGO/CMOF-5 electrode with faster ion diffusion and lower charge transfer resistance may improve the capacitance. Fig. 4d summarizes the specific capacitances of all samples at current densities ranging from 0.5 to 20 A g−1 based on the discharge curves. The specific capacitance of 312 F g−1 for the rGO/CMOF-5 hybrid was delivered at a current density of 0.5 A g−1, which is far superior to CMOF-5 with a capacitance of 206 F g−1 and rGO with a capacitance of 105 F g−1, and is even superior to the previously reported capacitances listed in Table 1.
| Sample | Current density (mA g−1) | Sweep rate (mV s−1) | Surface area (m2 g−1) | Electrolyte | Capacitance (F g−1) | Ref. |
|---|---|---|---|---|---|---|
| NPC | 5 | 2872 | 1.0 M H2SO4 | 204 | 17 | |
| NPC-1000 | 50 | 2524 | 1.0 M H2SO4 | 149 | 39 | |
| HPC | 100 | 1391 | 6.0 M KOH | 166 | 40 | |
| Z-800 | 50 | 720 | 0.5 M H2SO4 | 130 | 15 | |
| C-1000 | 5 | 3405 | 1.0 M H2SO4 | 161 | 41 | |
| C–S-700 | 2 | 817 | 6.0 M KOH | 182 | 42 | |
| rGO/CMOF-5 | 500 | 2040 | 6.0 M KOH | 312 | This work |
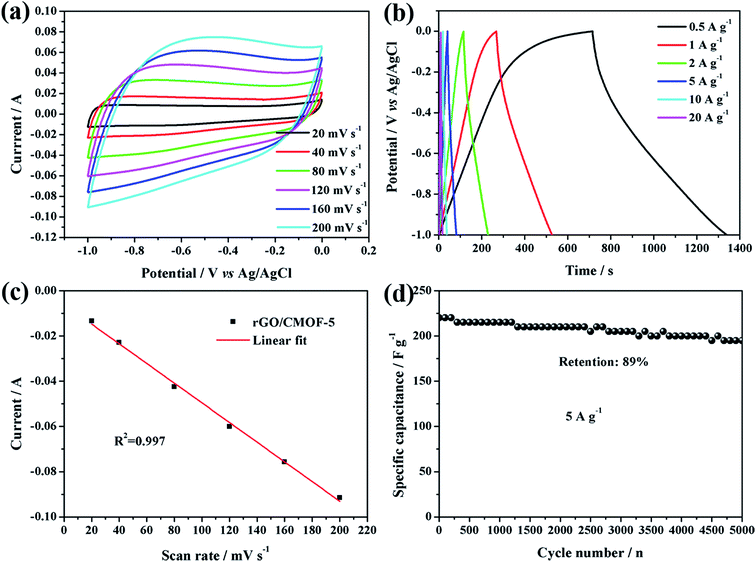
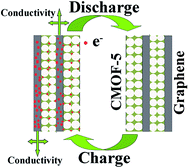
To better evaluate the electrochemical performance of the rGO/CMOF-5 hybrid, CV was carried out at different scan rates and GC measurements were recorded at different current densities. Fig. 5a shows that the as-recorded CV curves had a trapezoid shape from 20 to 200 mV s−1, indicating the existence of a small amount of pseudocapacitance. The GC profiles had a slight hunchback at a current density of 0.5 A g−1, implying a contribution from pseudocapacitance due to residual oxygen at lower current densities (Fig. 5b).36 Fig. 5c shows that there was a linear relationship between the scan rate and discharge current (Id), indicating that charge storage was dominated by the adsorption–desorption process for the electrical charge.43 The cycling stability, one of the most important characteristics of supercapacitors, was also tested at a current density of 5 A g−1 over 5000 cycles. Fig. 5d shows that the specific capacitance decreased gradually with increasing numbers of cycles and that the capacitance retention was 89% of the initial capacitance after 5000 cycles. Based on the results for the electrochemical behavior of the rGO/CMOF-5 hybrid, the mechanism for the remarkable improvement in the electrochemical performance is shown in Fig. 6. The intercalation of the graphene layer serves as a mini-collector to shorten the electron transport route and improve the conductivity of CMOF-5, which was confirmed by the decreasing equivalent series resistance (Fig. 4c). The well-defined nanoporous structure of CMOF-5 promoted access for the electrolyte and the exposure of active sites to the electrolyte. The integration of CMOF-5 onto the graphene layer suppressed the excessive self-aggregation of the hybrid, leading to an increase in the specific surface area of graphene, which allows the wetting of more ions, contributing to the superior capacitance.
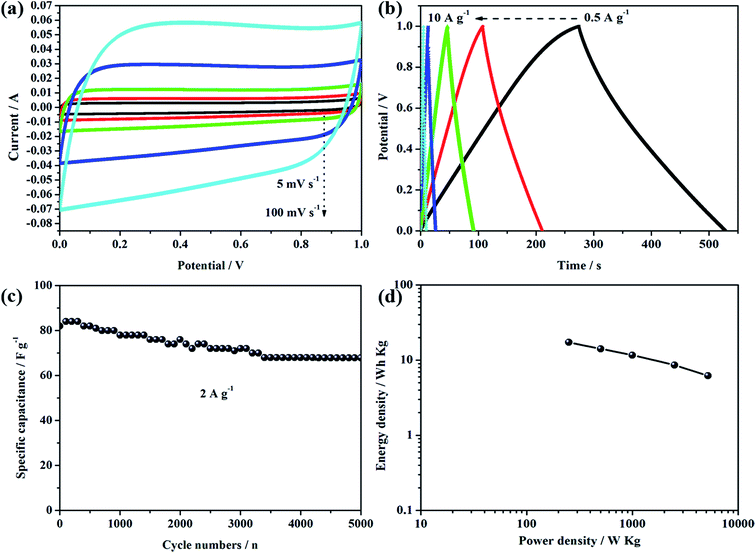
To further explore the capacitive performance of the rGO/CMOF-5 hybrid in practical applications, a symmetrical supercapacitor was successfully assembled with identical rGO/CMOF-5 hybrids as the positive and the negative electrodes and one piece of cellulose paper as the separator in a 6 M KOH electrolyte, denoted as rGO/CMOF-5//rGO/CMOF-5. Fig. 7a shows the CV curves of the symmetrical supercapacitor at different scan rates from 5 to 100 mV s−1. The quasi-rectangular CV geometry indicates an electrical double-layer capacitive performance and good rate capability. Fig. 7b shows the GC curves of the symmetrical supercapacitor at different current densities from 0.5 to 10 A g−1; the nearly symmetrical curves suggest that the results are consistent with the observations of the CV curves. A cycling test was recorded to estimate the durability of the device at a current density of 2 A g−1; Fig. 7c shows that the specific capacitance of the symmetrical supercapacitor decreased gradually at <3000 cycles, then maintained a steady level. After >5000 cycles, 81% retention was maintained, indicating the good durability of the device. The energy density and power density were also calculated (Fig. 7d). An energy density of 17.2 W h kg−1 was delivered at a power density of 250 W kg−1. Although the power density increased to 5.2 kW kg−1, the energy density was 7.1 W h kg−1.
4. Conclusions
We have reported a facile, effective and rational strategy to fabricate an rGO/CMOF-5 hybrid as a novel electrode material for application in supercapacitors. The electrochemical tests gave clear evidence of the ability of rGO to improve the electrochemical performance of the rGO/CMOF-5 hybrid. A high specific capacitance of 312 F g−1 and a capacitance retention of 89% after 5000 cycles were obtained. The excellent supercapacitor performance was ascribed to the synergistic effects of rGO with good conductivity and the nanoporous skeleton of CMOF-5. A symmetrical supercapacitor was assembled and its energy storage capability tested. An energy density of 17.2 W h kg−1 was delivered at a power density of 250 W kg−1 and the device had an excellent cycling stability of 81% capacitance retention after 5000 cycles at 2 A g−1. This work not only provides valuable guidance on how to further boost the electrochemical performance of carbonized MOFs materials, but has also provided a potential candidate for wide applications in fields of gas adsorption, catalysis and energy devices.Acknowledgements
We thank the National Natural Science Foundation of China (Grant No. 51502306) for financial support.References
- X. L. Wu, T. Wen, H. L. Guo, S. Yang, X. K. Wang and A. W. Xu, ACS Nano, 2013, 7, 3589 CrossRef CAS PubMed.
- J. Joseph, A. Paravannoor, S. V. Nair, Z. J. Han, K. Ostrikov and A. Balakrishnan, J. Mater. Chem. A, 2015, 3, 14105 CAS.
- P. F. Zhang, Y. T. Gong, Z. Z. Wei, J. Wang, Z. Y. Zhang, H. R. Li, S. Dai and Y. Wang, ACS Appl. Mater. Interfaces, 2014, 6, 12515 CAS.
- M. J. Zhi, F. Yang, F. Meng, M. Q. Li, A. Manivannan and N. Q. Wu, ACS Sustainable Chem. Eng., 2014, 2, 1592 CrossRef CAS.
- R. R. Salunkhe, J. Tang, Y. Kamachi, T. Nakato, J. H. Kim and Y. Yamauchi, ACS Nano, 2015, 9, 6288 CrossRef CAS PubMed.
- R. R. Salunkhe, Y. Kamachi, N. L. Torad, S. M. Hwang, J. H. Kim and Y. Yamauchi, J. Mater. Chem. A, 2014, 2, 19848 CAS.
- H. Furukawa, K. E. Cordova, M. O'Keeffe and O. M. Yaghi, Science, 2013, 341, 974 CrossRef CAS PubMed.
- A. Morozan and F. Jaouen, Energy Environ. Sci., 2012, 5, 9269 CAS.
- L. Lux, K. Williams and S. Q. Ma, CrystEngComm, 2015, 17, 10 RSC.
- K. Sumida, D. L. Rogow, J. A. Mason, T. M. McDonald, E. D. Bloch, Z. R. Herm, T. H. Bae and J. R. Long, Chem. Rev., 2012, 112, 724 CrossRef CAS PubMed.
- Y. K. Hwang, D. Y. Hong, J. S. Chang, S. H. Jhung, Y. K. Seo, J. Kim, A. Vimont, M. Daturi, C. Serre and G. Férey, Angew. Chem., Int. Ed., 2008, 47, 4144 CrossRef CAS PubMed.
- A. Morozan and F. Jaouen, Energy Environ. Sci., 2012, 5, 9269 CAS.
- N. B. Shustova, A. F. Cozzolino, S. Reineke, M. Baldo and M. Dincă, J. Am. Chem. Soc., 2013, 135, 13326 CrossRef CAS PubMed.
- X. D. Xu, R. G. Cao, S. Jeong and J. Cho, Nano Lett., 2012, 12, 4988 CrossRef CAS PubMed.
- W. Chaikittisilp, M. Hu, H. Wang, H. S. Huang, T. Fujita, Y. Yamauchi and K. Ariga, Chem. Commun., 2012, 48, 7259 RSC.
- W. Chaikittisilp, K. Ariga and Y. Yamauchi, J. Mater. Chem. A, 2013, 1, 14 CAS.
- B. Liu, H. Shioyama, T. Akita and Q. Xu, J. Am. Chem. Soc., 2008, 130, 5390 CrossRef CAS PubMed.
- H. B. Aiyappa, P. Pachfule, R. Banerjee and S. Kurungot, Cryst. Growth Des., 2013, 13, 4195 CAS.
- X. F. Zhou, F. Wang, Y. M. Zhu and Z. P. Liu, J. Mater. Chem., 2011, 21, 3353 RSC.
- A. T. Valota, I. A. Kinloch, K. S. Novoselov, C. Casiraghi, A. Eckmann, E. W. Hill and R. A. W. Dryfe, ACS Nano, 2011, 5, 8809 CrossRef CAS PubMed.
- H. L. Wang, L. F. Cui, Y. Yang, H. S. Casalongue, J. T. Robinson, Y. Y. Liang, Y. Cui and H. J. Dai, J. Am. Chem. Soc., 2010, 132, 13978 CrossRef CAS PubMed.
- X. Li, L. L. Fan, Z. Li, K. L. Wang, M. L. Zhong, J. Q. Wei, D. H. Wu and H. W. Zhu, Adv. Energy Mater., 2012, 2, 425 CrossRef CAS.
- S. J. Guo and S. J. Dong, J. Mater. Chem., 2011, 21, 18503 RSC.
- Z. B. Lei, Z. H. Liu, H. J. Wang, X. X. Sun, L. Lu and X. S. Zhao, J. Mater. Chem. A, 2013, 1, 2313 CAS.
- C. X. Guo and C. M. Li, Energy Environ. Sci., 2011, 4, 4504 CAS.
- B. You, L. L. Wang, L. Yao and J. Yang, Chem. Commun., 2013, 49, 5016 RSC.
- W. H. Cai, T. Lai, W. L. Dai and J. S. Ye, J. Power Sources, 2014, 255, 170 CrossRef CAS.
- M. L. Li, G. Y. Sun, P. P. Yin, C. P. Ruan and K. L. Ai, ACS Appl. Mater. Interfaces, 2013, 5, 11462 CAS.
- T. Szabo, E. Tombacz, E. Illes and I. Dekany, Carbon, 2006, 44, 537 CrossRef CAS.
- W. S. Hummers and R. E. Offeman, J. Am. Chem. Soc., 1985, 80, 1339 CrossRef.
- S. S. Kaye, A. Dailly, O. M. Yaghi and J. R. Long, J. Am. Chem. Soc., 2007, 129, 14176 CrossRef CAS PubMed.
- Y. Zhu, D. K. James and J. M. Tour, Adv. Mater., 2012, 24, 4924 CrossRef CAS PubMed.
- M. Jahan, Q. L. Bao, J. X. Yang and K. P. Loh, J. Am. Chem. Soc., 2010, 132, 14487 CrossRef CAS PubMed.
- D. S. Zhang, X. R. Wen, L. Y. Shi, T. T. Yan and J. P. Zhang, Nanoscale, 2012, 4, 5440 RSC.
- M. Kandiah, M. H. Nilsen, S. Usseglio, S. Jakobsen, U. Olsbye, F. Bonino and K. P. Lillerud, Chem. Mater., 2010, 22, 6632 CrossRef CAS.
- A. M. Abdelkader, C. Vallés, A. J. Cooper, I. A. Kinloch and R. A. W. Dryfe, ACS Nano, 2014, 8, 11225 CrossRef CAS PubMed.
- A. Banerjee, K. K. Upadhyay, D. Puthusseri, V. Aravindan, S. Madhavi and S. Ogale, Nanoscale, 2014, 6, 4387 RSC.
- D. Y. Zhang, L. W. Zheng, Y. Ma, L. Y. Lei, Q. L. Li, Y. Li, H. M. Luo and Y. Hao, ACS Appl. Mater. Interfaces, 2014, 6, 2657 CAS.
- B. Liu, H. Shioyama, H. Jiang, X. Zhang and Q. Xu, Carbon, 2010, 48, 456 CrossRef CAS.
- J. Hu, H. Wang, Q. Gao and H. Guo, Carbon, 2010, 48, 3599 CrossRef CAS.
- H. L. Jiang, B. Liu, Y. Q. Lan, K. Kuratani, T. Akita, H. Shioyama, F. Zong and Q. Xu, J. Am. Chem. Soc., 2011, 133, 11854 CrossRef CAS PubMed.
- P. Su, L. Jiang, J. Zhao, J. Yan, C. Li and Q. Yang, Chem. Commun., 2012, 48, 8769 RSC.
- Y. Yoon, K. Lee, S. Kwon, S. Seo, H. Yoo, S. Kim, Y. Shin, Y. Park, D. Kim, J. Y. Choi and H. Lee, ACS Nano, 2014, 8, 4580 CrossRef CAS PubMed.
Footnote |
| † Electronic supplementary information (ESI) available. See DOI: 10.1039/c5ra27893g |
| This journal is © The Royal Society of Chemistry 2016 |

