Construction of a 2D/2D g-C3N4/rGO hybrid heterojunction catalyst with outstanding charge separation ability and nitrogen photofixation performance via a surface protonation process
Shaozheng Huab,
Weidong Zhanga,
Jin Baia,
Guang Lua,
Lei Zhanga and
Guang Wu*b
aCollege of Chemistry, Chemical Engineering and Environmental Engineering, Liaoning Shihua University, Fushun 113001, China
bSchool of Chemistry and Materials Sciences, Heilongjiang University, Harbin 150080, China. E-mail: guangw001@163.com
First published on 1st March 2016
Abstract
In this work, we report a 2D/2D hybrid heterojunction photocatalyst (PCN/rGO) with effective interfacial contact by incorporating reduced graphene oxide (rGO) and protonated g-C3N4 (PCN) synthesized via a novel electrostatic self-assembly strategy, followed by an ethylene glycol reduction process. The GCN/rGO obtained by incorporating reduced graphene oxide (rGO) and g-C3N4 without protonation (GCN) has also been prepared for comparison. PCN/rGO(0.2), with the mass ratio rGO/PCN of 0.2, exhibits the highest nitrogen photofixation performance under visible light. The NH4+ generation rate for PCN/rGO(0.2) is 42.4, 8.3 and 3.7 times higher than that of GCN, PCN and GCN/rGO(0.2). This is ascribed to the addition of rGO with PCN in a controlled ratio as well as sufficient interfacial contact by the electrostatic self-assembly process between rGO and PCN across the PCN/rGO heterojunction, for efficient charge transfer to suppress the recombination of electron–hole pairs, as evidenced by the zeta potential, XPS and PL studies. In addition, compared with GCN/rGO(0.2), the stronger interaction caused by the electrostatic attractive forces exists between PCN and rGO, leading to a better catalytic stability of PCN/rGO(0.2). This work opens up an effective way to prepare the heterojunction catalyst by incorporating two components with different surface charges.
Introduction
Nitrogen is a necessary element for the growth of plants and animals. Nitrogen fixation is the second most important chemical process in nature next to photosynthesis. All living organisms rely on natural nitrogen fixation by some soil-dwelling bacteria or artificial fixation by the Haber–Bosch process, in which hydrogen gas reacts with nitrogen gas to yield ammonia in the presence of catalysts under high pressure and temperature. Not only energy consumption but also the raw material cost is high for this process. Therefore, artificial dinitrogen fixation under milder conditions is great significant, since the reduction in the input energy during the fixation process and no use of hydrogen gas may be preferred from the viewpoints of cost and environmental protection.In recent years, the photocatalytic nitrogen fixation technology has become the best alternative to traditional industrial nitrogen fixation techniques for its green cleaning, mild conditions, low power consumption, and low cost etc. In 1977, Schrauzer et al.1 first reported that N2 can be reduced to NH3 over Fe doped TiO2 under UV light. The reaction is as follow:
| 2N2 + 6H2O → 4NH3 + 3O2 |
Since then, many Ti-based metal oxides and composite catalyst were reported.2 However, because of the poor visible light absorption caused by the wide band gap energy, the dinitrogen fixation ability of the Ti-based metal oxides and composite catalyst is still low under visible light.
Two-dimensional (2D) graphitic carbon nitride (g-C3N4), the most stable allotrope of covalent carbon nitride,3 have been widely used as a new metal-free visible light photocatalyst for organic pollutant degradation,4 water reduction and oxidation,5 CO2 capture6 and organic synthesis.7 The tunable condensation degree and distinctive heptazine ring structure make g-C3N4 possess good physicochemical stability, fascinating electronic structure and medium band gap (2.7 eV). However, the rapid photogenerated electron–hole pair recombination and low electrical conductivity lead to its low activity in practical applications.
Continuous efforts have been made by the researchers to improve this situation. In addition to doping selected heteroatoms into the framework (such as P, B, S, O, halogen and Fe),8–13 which could slightly modify the molecular orbital shape and position, promoting the photocatalytic performance, pristine g-C3N4 can be also engineered by charge-transfer complexation to form a nanocomposite with an electron-rich system that results in rearranging electron density within the catalyst. Graphene, an analogue of graphite, is the excellent electron collectors and transporters. It is composed of 2D sp2-conjugated carbon atoms packed in a honeycomb lattice. Because of the unique electronic, mechanical and chemical properties, graphene have been used to boost performance of various energy conversion and storage devices such as fuel cells, supercapacitors, photovoltaic devices and Li-ion batteries.14,15 Therefore, it is easily predictable that, the identical sp2-bonded π structure and carbon network are exhibited by graphene and g-C3N4, which endow them the compatible materials to develop nanostructures. In general, there are two methods to prepare graphene/g-C3N4 heterojunction photocatalyst, in situ immobilization by calcination16–20 and sonochemical approach.21–23 Xiang et al.16 and Li et al.17 fabricated graphene/g-C3N4 by heating cyanamide or melamine in the dispersion of graphite oxide followed by thermal calcination at 550 °C for 4 h. This approach can fix the g-C3N4 onto the graphene support in situ. However, because of the sublimation of melamine or cyanamide, the g-C3N4 concentration in the heterojunction photocatalyst is difficult to control. Besides, the calcination process causes the aggregation of graphene, leading to the decreased surface area and re-graphitization. Dai et al.21 and Liao et al.22 prepared GO/g-C3N4 with efficient photocatalytic capability by sonochemical approach. The π–π stacking interactions is formed between graphene and g-C3N4. This method can accurately control the content of each component. Furthermore, the conditions for this sonochemical approach is mild, which can not change the properties of graphene and g-C3N4. However, it is known that the surface charge of g-C3N4 is negative because of the uncondensed aminogroups.24 For graphene, the surface charge is also negative in most cases because of the presence of many oxygen-containing functional groups such as carboxyl and hydroxyl groups (–COO− and –O−) on the surface. The same charge property weakens the π–π stacking interactions of formed nanocomposite, which causes the poor catalytic stability.23 Therefore, an intimate interfacial contact between graphene and g-C3N4 synthesized under mild condition is of significantly important to make sure the effective charge separation in the heterojunction.
In recent years, protonation has been of particular interest for modifying g-C3N4. Acid modification provides a way to adjust the electronic band gap and ionic conductivity of g-C3N4.25 Besides that, the surface charges of g-C3N4 can be changed from negative to positive by protonation. Therefore, it is prospective that the electrostatic self-assembly process between positive g-C3N4 and negative graphene can enhance the interaction which is beneficial to the fast charge separation. Siedl et al. prepared TiO2–SnO2 heteroaggregation via the similar electrostatic self-assembly strategy.26 Here, by incorporating reduced graphene oxide (rGO) and protonated g-C3N4 (PCN) synthesized via a electrostatic self-assembly strategy followed by ethylene glycol-reduction process, we report a 2D/2D PCN/rGO hybrid heterojunction photocatalyst with outstanding dinitrogen fixation ability under visible light. This electrostatic self-assembly technique can strengthen the interaction between two components, and also increase the contact area for effective charge transportation across the hetero-interface.
Experimental
Preparation and characterization
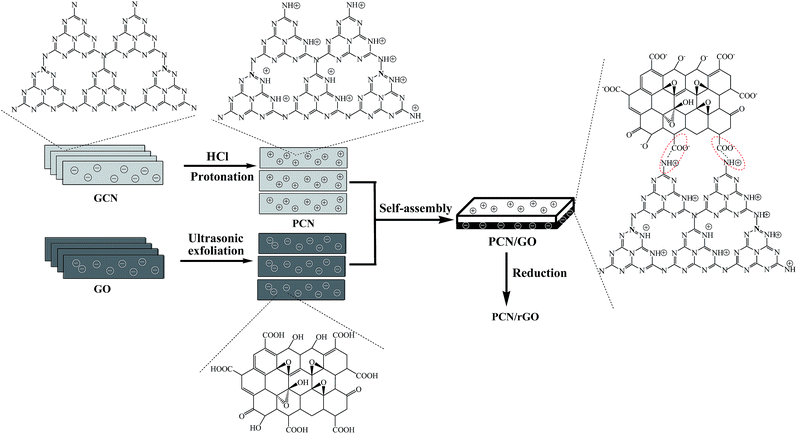 | ||
| Fig. 1 Schematic diagram of the synthesis process of PCN/rGO hybrid heterojunction catalyst via a electrostatic self-assembly strategy followed by ethylene glycol-reduction process. | ||
XRD patterns of the prepared samples were recorded on a Rigaku D/max-2400 instrument using Cu-Kα radiation (λ = 1.54 Å). The scan rate, step size, voltage and current was 0.05° min−1, 0.01°, 40 kV and 30 mA, respectively. UV-vis spectroscopy measurement was carried out on a JASCO V-550 model UV-vis spectrophotometer, using BaSO4 as the reflectance sample. Fourier transform infrared spectra (FT-IR) were obtained on a Nicolet 20DXB FT-IR spectrometer. The zeta potential was measured at room temperature on a Zetasizer Nano S90 Malvern Instrument. The pH was adjusted by dropwise addition of dilute HCl or NaOH solution. XPS measurements were conducted on a Thermo Escalab 250 XPS system with Al Kα radiation as the exciting source. The binding energies were calibrated by referencing the C 1s peak (284.6 eV) to reduce the sample charge effect. Nitrogen adsorption was measured at −196 °C on a Micromeritics 2010 analyzer. All the samples were degassed at 393 K before the measurement. BET surface area (SBET) was calculated according to the adsorption isotherm. Photoluminescence (PL) spectra were measured at room temperature with a fluorospectrophotometer (FP-6300) using a Xe lamp as excitation source. Working electrodes were prepared as follows: 0.3 g of sample was ground with 0.7 g of ethanol to make slurry, then coated on an indium–tin oxide glass by the doctor blade method. Photocurrents were measured by electrochemical analyzer (CHI 618C Instruments) equipped with a rectangular shaped quartz reactor (20 × 40 × 50 mm) using a standard three electrode system which the prepared sample film was used as the working electrodes, a Pt flake as the counter electrode, and Ag/AgCl as the reference electrode. A 500 W Xe-lamp was used to irradiate the working electrode from the back side. The light intensity on the working electrode was 120 mW cm−2. In addition, a mechanical shutter was used to minimize light exposure of the sample. A 1.0 M Na2SO4 solution was used as the electrolyte. The applied potential was 0.00 V vs. Ag/AgCl. All measurements were performed at room temperature (298 K).
Photocatalytic reaction
Evaluation of nitrogen photofixation property is refered to previous literature.2 The nitrogen photofixation experiments were carried out in a double-walled quartz reactor in air. 0.2 g of photocatalyst was added into 500 mL solution of 1 mmol L−1 EDTA-2Na as hole scavenger. The suspension was dispersed in an ultrasound generator for 10 min. In the photoreaction under visible light irradiation, the suspension was exposed to a 250 W high-pressure sodium lamp with main emission in the range of 400–800 nm, and air was bubbled at 130 mL min−1 through the solution. The UV light portion of sodium lamp was filtered by 0.5 M NaNO2 solution. All runs were conducted at ambient pressure and 30 °C. At given time intervals, 5 mL suspension was taken and immediately centrifuged to separate the liquid samples from the solid catalyst. The concentration of ammonia was measured using Nessler's reagent spectrophotometry method (JB7478-87) by a UV-2450 spectrophotometer (Shimadzu, Japan).2eResults and discussion
Generally, a catalyst with high specific surface area (SBET) and big pore volume is significant to the enhancement of catalytic performance. Because of the agglomeration, GCN shows a very low SBET and pore volume (Table 1). After protonation process, the SBET and pore volume of PCN obviously increases to 32.9 m2 g−1 and 0.18 cm3 g−1 which is consistent with previous results.27 For GO, the SBET and pore volume is 142 m2 g−1 and 0.39 cm3 g−1. The PCN/rGO hybrid heterojunction catalysts show a increased SBET (40–60 m2 g−1) and pore volume (0.19–0.26 cm3 g−1) with increasing the rGO content. The nitrogen photofixation performance over as-prepared catalysts are also shown in Table 1. It is no doubt that GCN shows a low nitrogen photofixation ability. The NH4+ generation rate of PCN increases to 1.114 mg L−1 h−1 gcat−1, which is ∼5 times as high as that of GCN (0.219 mg L−1 h−1 gcat−1). Neat GO shows no nitrogen photofixation ability. However, for PCN/rGO hybrid heterojunction catalysts, the photocatalytic performances improve sharply. The NH4+ generation rate of PCN/rGO(0.05), PCN/rGO(0.1), PCN/rGO(0.15) and PCN/rGO(0.2) are 2.880, 4.479, 6.180 and 9.276 mg L−1 h−1 gcat−1 respectively. The photocatalytic activity increases with increasing the SBET and pore volume, probably due to that the large SBET and pore volume can promote the ability of adsorption, desorption and diffusion of reactants and products. PCN/rGO(0.2) exhibits the highest NH4+ generation rate, which is 42.4 and 8.3 times higher than that of GCN and PCN. The optimal rGO/PCN mass ratio is 20%. This is probably due to that, with this rGO/PCN mass ratio, rGO and g-C3N4 have the approximate SBET. They can contact with each other as much as possible, leading to the formation of the maximum area of the heterojunction. When the rGO/PCN mass ratio is beyond this value, such as PCN/rGO(0.3), the NH4+ generation rate decreases obviously (4.389 mg L−1 h−1 gcat−1). This is probably due to that the excess carbon materials will shield the visible light, leading to the decreased photocatalytic activity. It is noted that the NH4+ generation rates of GCN/rGO(0.2) with SBET and pore volume of 19.5 m2 g−1 and 0.12 cm3 g−1 and CCN/rGO(0.2) with SBET and pore volume of 21.5 m2 g−1 and 0.13 cm3 g−1 are 2.541 and 3.48 mg L−1 h−1 gcat−1, much lower than that of PCN/rGO(0.2). Is the differences in SBET and pore volume among them the crucial factor which causes this huge difference in nitrogen photofixation performance? In order to identify this point of view, UCN/rGO(0.2) is prepared using urea as raw material to increase the SBET of obtained g-C3N4.28 Table 1 shows that the SBET and pore volume of UCN/rGO(0.2) are very close to that of PCN/rGO(0.2). However, the NH4+ generation rate of UCN/rGO(0.2) is only 4.689 mg L−1 h−1 gcat−1, much lower than that of PCN/rGO(0.2). It is deduced that besides the SBET and pore volume, there must be other reason which causes this improved nitrogen photofixation performance of PCN/rGO(0.2). CCN/rGO(0.2) shows the higher nitrogen photofixation ability than GCN/rGO(0.2) although they have the comparable SBET and pore volume, which confirms this point of view.| Catalyst | SBET (m2 g−1) | Pore volume (cm3 g−1) | RNH4+ (mg L−1 h−1 gcat−1) |
|---|---|---|---|
| GCN | 9.8 | 0.05 | 0.219 |
| PCN | 32.9 | 0.18 | 1.114 |
| GO | 142 | 0.39 | 0 |
| PCN/rGO(0.05) | 40.5 | 0.19 | 2.880 |
| PCN/rGO(0.1) | 43.2 | 0.20 | 4.479 |
| PCN/rGO(0.15) | 46.8 | 0.22 | 6.180 |
| PCN/rGO(0.2) | 55.9 | 0.23 | 9.276 |
| GCN/rGO(0.2) | 19.5 | 0.12 | 2.541 |
| CCN/rGO(0.2) | 21.5 | 0.13 | 3.48 |
| UCN/rGO(0.2) | 52.2 | 0.22 | 4.689 |
| PCN/rGO(0.3) | 60.6 | 0.26 | 4.389 |
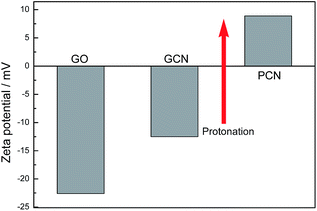
As mentioned, the surface charge properties of GO and g-C3N4 determine whether the PCN/rGO hybrid heterojunction catalyst can be assembled effectively. Fig. 2 shows the zeta potential of GO, GCN and PCN in deionized water. Obviously, GO demonstrates a negatively charged surface (−22.5 mV), which is attributed to the presence of plenty of oxygen-containing groups (such as –COO− and –O−). For g-C3N4, the zeta potential value shifts from −12.3 mV for GCN to +8.9 mV for PCN, indicating the g-C3N4 surface changes from negatively charged to positively charged after protonation process. Therefore, it is clear that the self-assembly between the positively charged PCN and the negatively charged GO can be carried out by the electrostatic and π–π stacking interactions simultaneously to construct the PCN/rGO hybrid heterojunction catalyst.
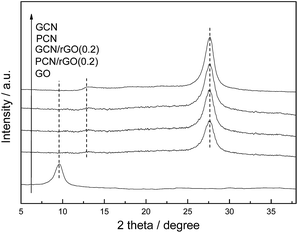
Fig. 3 shows the XRD patterns of the as-prepared GCN, PCN, GO, PCN/rGO(0.2) and GCN/rGO(0.2). The GO sample exhibits an intensive peak at 9.5°, which corresponds to the (001) diffraction peak of interlayer spacing. This diffraction peak can not be observed in PCN/rGO(0.2) and GCN/rGO(0.2) attributed to the exfoliation of regular stacking of GO and reduction of GO to rGO with fewer oxygen-containing groups.21 It is noted that no diffraction peak for rGO is observed in PCN/rGO(0.2) and GCN/rGO(0.2), probably due to its low diffraction intensity and content. In addition, two typical diffraction peaks of g-C3N4 are still present in the PCN after acid pretreatment process, hinting that the crystal structures of g-C3N4 are well-maintained. The peak at 13.1° corresponds to in-plane structural packing motif of tri-s-triazine units, which is indexed as (100) peak. The distance is calculated as d = 0.671 nm. The peak at 27.50° corresponds to interlayer stacking of aromatic segments with distance of 0.324 nm, which is indexed as (002) peak. The XRD peak positions of PCN/rGO(0.2) and GCN/rGO(0.2) do not change compared with those of PCN and GCN, indicating that being conjugated with rGO does not influence the lattice structure of g-C3N4.
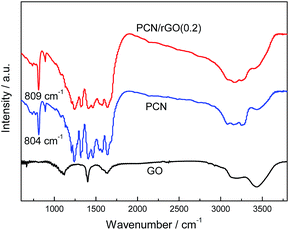
Fig. 4 shows the FT-IR spectra of GO, PCN and PCN/rGO(0.2). The broad peak at 3000–3700 cm−1 in the spectrum of GO corresponds to the stretching mode of –OH and the physically adsorbed H2O. The peaks around 1628 cm−1 are attributed to the C![[double bond, length as m-dash]](https://www.rsc.org/images/entities/char_e001.gif) O stretching mode of COOH groups. The peak at 1402 and 1108 cm−1 are ascribed to C–O and C–O–C functional groups, respectively. For PCN, a series of peaks in the range from 1200 to 1600 cm−1 are attributed to the typical stretching modes of CN heterocycles, while the sharp peak located at 804 cm−1 is assigned to the bending vibration of heptazine rings, which indicating the synthesized g-C3N4 is composed of heptazine units. The broad absorption band around 3200 cm−1 is originated from the stretching vibration of N–H bond, associated with uncondensed aminogroups. In the case of PCN/rGO(0.2), only the characteristic peaks of PCN appear in the spectrum because of the low quantity of GO in the composites. This is consistent with the previous reports.22 Note that, the peak at 804 cm−1 in the PCN exhibits a slight shift to ca. 809 cm−1 in the PCN/rGO(0.2). This suggested that an interaction between rGO and PCN is formed by an electrostatic self-assembly approach.
O stretching mode of COOH groups. The peak at 1402 and 1108 cm−1 are ascribed to C–O and C–O–C functional groups, respectively. For PCN, a series of peaks in the range from 1200 to 1600 cm−1 are attributed to the typical stretching modes of CN heterocycles, while the sharp peak located at 804 cm−1 is assigned to the bending vibration of heptazine rings, which indicating the synthesized g-C3N4 is composed of heptazine units. The broad absorption band around 3200 cm−1 is originated from the stretching vibration of N–H bond, associated with uncondensed aminogroups. In the case of PCN/rGO(0.2), only the characteristic peaks of PCN appear in the spectrum because of the low quantity of GO in the composites. This is consistent with the previous reports.22 Note that, the peak at 804 cm−1 in the PCN exhibits a slight shift to ca. 809 cm−1 in the PCN/rGO(0.2). This suggested that an interaction between rGO and PCN is formed by an electrostatic self-assembly approach.
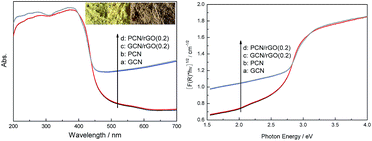
The optical absorption of as-prepared g-C3N4 based catalysts is measured using UV-vis spectra. The band gaps are estimated from the tangent lines in the plots of the square root of the Kubelka–Munk functions against the photon energy.29 As presented in Fig. 5a, GCN shows typical semiconductor absorption, originating from charge transfer response of g-C3N4 from the VB populated by N 2p orbitals to the CB formed by C 2p orbitals.5 The main absorption edge of GCN occurs at ca. 467 nm, corresponding to the band gap energy of 2.65 eV. Noticeably, there is no obvious deviation in the optical absorption between PCN and GCN, hinting that the optical properties are well-preserved, despite protons are introduced into PCN during protonation process evidenced by zeta potential analysis. With the introduction of rGO, PCN/rGO(0.2) and GCN/rGO(0.2) nanocomposites exhibit similar absorption edges relative to that of GCN. Similar results are found in other graphene-based nanocomposites photocatalysts widely reported by researchers.21,30,31 The layered rGO in the hybrid nanostructures serves as a conducting substrate for the immobilization of PCN via a electrostatic self-assembly strategy for the efficient 2D/2D interfacial contact. The band gap energies of the as-fabricated PCN/rGO(0.2) and GCN/rGO(0.2) samples are estimated to be ca. 2.65 eV (Fig. 5b). This inferred that the intrinsic band gap of the g-C3N4/rGO photocatalysts is originated from the electron transitions from the valence band (VB) to the conduction band (CB) of g-C3N4. It is noted that the g-C3N4/rGO samples show broad background absorption and enhanced light absorption in the region of 450–700 nm. This is reasonable because of the existence of rGO in the hybrid nanocomposites, which is in agreement with the colour change from GCN and PCN in light yellow to GCN/rGO(0.2) and PCN/rGO(0.2) in gray (inset of Fig. 5a).
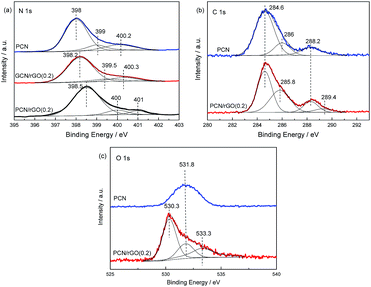
XPS measurements are conducted to determine the chemical status of elements in as-prepared catalysts (Fig. 6). For N 1s region (Fig. 6a), the curve for PCN is decomposed into three peaks located at ca. 398, 399 and 400.2 eV by employing a Gaussian curve fitting approach. They are assigned to the sp2 hybridized aromatic nitrogen atoms bonded to carbon atoms (C–N![[double bond, length as m-dash]](https://www.rsc.org/images/entities/char_e001.gif) C), tertiary nitrogen N–(C)3 groups linking structural motif or amino groups carrying hydrogen ((C)2–N–H) in connection with structural defects and incomplete condensation, and nitrogen atoms bonded three carbon atoms in the aromatic cycles.32 For PCN/rGO(0.2) and GCN/rGO(0.2), similar three contributions are observed in Fig. 6a. However, compared with PCN, the obvious shifts to higher binding energies are observed for PCN/rGO(0.2) and GCN/rGO(0.2). We investigated the properties of Bi2O2CO3/g-C3N4 nanocomposites in our previous work.33 It is found that the binding energy difference, ΔE, between individual Bi2O2CO3 and composite in the region of Bi 4f could reflect the strength of interaction between g-C3N4 and Bi2O2CO3. In this work, ΔE, between neat g-C3N4 and composite in the region of N 1s for PCN/rGO(0.2) is much larger than that of GCN/rGO(0.2), indicating that the interaction between g-C3N4 and rGO in PCN/rGO(0.2) is probably stronger than that in GCN/rGO(0.2). This is due to the electrostatic interaction is formed between these two components, leading to a stronger binding force in PCN/rGO(0.2). In C 1s region (Fig. 6b), three contributions for PCN located at 284.6, 286 and 288.2 eV are attributed to the C–C bond which originated from sp2 C atoms bonded to N in an aromatic ring (N–C
C), tertiary nitrogen N–(C)3 groups linking structural motif or amino groups carrying hydrogen ((C)2–N–H) in connection with structural defects and incomplete condensation, and nitrogen atoms bonded three carbon atoms in the aromatic cycles.32 For PCN/rGO(0.2) and GCN/rGO(0.2), similar three contributions are observed in Fig. 6a. However, compared with PCN, the obvious shifts to higher binding energies are observed for PCN/rGO(0.2) and GCN/rGO(0.2). We investigated the properties of Bi2O2CO3/g-C3N4 nanocomposites in our previous work.33 It is found that the binding energy difference, ΔE, between individual Bi2O2CO3 and composite in the region of Bi 4f could reflect the strength of interaction between g-C3N4 and Bi2O2CO3. In this work, ΔE, between neat g-C3N4 and composite in the region of N 1s for PCN/rGO(0.2) is much larger than that of GCN/rGO(0.2), indicating that the interaction between g-C3N4 and rGO in PCN/rGO(0.2) is probably stronger than that in GCN/rGO(0.2). This is due to the electrostatic interaction is formed between these two components, leading to a stronger binding force in PCN/rGO(0.2). In C 1s region (Fig. 6b), three contributions for PCN located at 284.6, 286 and 288.2 eV are attributed to the C–C bond which originated from sp2 C atoms bonded to N in an aromatic ring (N–C![[double bond, length as m-dash]](https://www.rsc.org/images/entities/char_e001.gif) N), C
N), C![[double bond, length as m-dash]](https://www.rsc.org/images/entities/char_e001.gif) N or C
N or C![[triple bond, length as m-dash]](https://www.rsc.org/images/entities/char_e002.gif) N which could be ascribed to defect-containing sp2 hybridized carbon atoms present in graphitic domains, and pure graphitic sites in a CN matrix.34,35 For PCN/rGO(0.2), all these peaks are kept as well as a new peak at 289.4 eV is observed. Besides that, it is noted that the peak area of PCN/rGO(0.2) around 285.8 eV is much larger than that of PCN. This is probably due to the existence of C–OH in PCN/rGO(0.2).36 The peak located at 289.4 eV is due to the existence of HO–C
N which could be ascribed to defect-containing sp2 hybridized carbon atoms present in graphitic domains, and pure graphitic sites in a CN matrix.34,35 For PCN/rGO(0.2), all these peaks are kept as well as a new peak at 289.4 eV is observed. Besides that, it is noted that the peak area of PCN/rGO(0.2) around 285.8 eV is much larger than that of PCN. This is probably due to the existence of C–OH in PCN/rGO(0.2).36 The peak located at 289.4 eV is due to the existence of HO–C![[double bond, length as m-dash]](https://www.rsc.org/images/entities/char_e001.gif) O bonds resulting from the rGO after undergoing the reduction of GO.37 In O 1s region (Fig. 6c), the binding energy for PCN is located at 531.8 eV, which is accredited to the adsorbed H2O or CO2. This is a common phenomenon reported in previous literature.38 In the case of PCN/rGO(0.2), besides the adsorbed H2O or CO2 located at 531.8 eV, other two peaks are observed at 530.3 and 533.3 eV. They are attributed to the HO–C
O bonds resulting from the rGO after undergoing the reduction of GO.37 In O 1s region (Fig. 6c), the binding energy for PCN is located at 531.8 eV, which is accredited to the adsorbed H2O or CO2. This is a common phenomenon reported in previous literature.38 In the case of PCN/rGO(0.2), besides the adsorbed H2O or CO2 located at 531.8 eV, other two peaks are observed at 530.3 and 533.3 eV. They are attributed to the HO–C![[double bond, length as m-dash]](https://www.rsc.org/images/entities/char_e001.gif) O and C–OH bonds, respectively.39 This is consistent with the results obtained from the C 1s region.
O and C–OH bonds, respectively.39 This is consistent with the results obtained from the C 1s region.
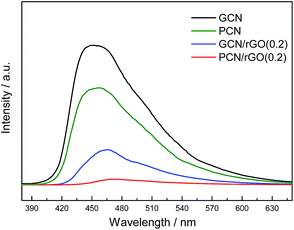
PL is a highly sensitive technique used to provide information on charge separation/recombination of photoinduced charged carriers.40 In general, the lower PL intensity, the higher separation rates of photogenerated e−/h+ pairs. Fig. 7 shows the PL spectra of GCN, PCN, PCN/rGO(0.2) and GCN/rGO(0.2). The PL intensity is found to follow the sequence: GCN > PCN > GCN/rGO(0.2) > PCN/rGO(0.2). This order in the degree of PL quenching is in accordance with the photocatalytic results of as-prepared catalysts. Protonation and rGO modification are helpful to inhibit the recombination of photo-induced electron–hole pairs and effectively improve their separation efficiency. This is consistent with previous result.41–43 Furthermore, PCN/rGO(0.2) exhibits a considerable PL quenching relative to that of the other catalysts. This is ascribed to the sufficient interfacial interaction in the PCN/rGO(0.2) via electrostatic attractive forces, which confirmed well with the aforementioned zeta potential, XPS and photocatalytic results.
The outstanding carrier separation ability of PCN/rGO hybrid heterojunction catalyst is confirmed by the photocurrent responses measurement (I–t curve, Fig. 8). Without doubt, the photocurrent value of PCN is very low, due to the high electrons–holes recombination rate. For PCN/rGO hybrid heterojunction catalysts, the photocurrent values of GCN/rGO(0.2) and PCN/rGO(0.2) are ∼2.2 and 4.5 times as high as that of PCN. Compared with GCN/rGO(0.2), because of the more intimate interaction existing on the PCN/rGO(0.2) interface after protonation process, photogenerated electrons and holes are separated more efficiently, leading to the much decreased photoinduced carrier recombination, corresponding to its higher photocurrent.44,45 Therefore, it is deduced that a stronger interfacial coupling between rGO and PCN with surface charge modification is formed for PCN/rGO(0.2) to increase the face-to-face contact area for effective charge transfer across the 2D/2D layered heterojunction to inhibit the recombination rate of electron–hole pairs.
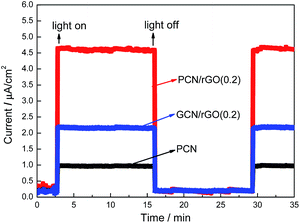 | ||
| Fig. 8 The photocurrent responses of PCN, PCN/rGO(0.2) and GCN/rGO(0.2) in 1.0 M Na2SO4 solution under visible light. | ||
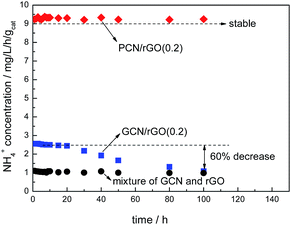
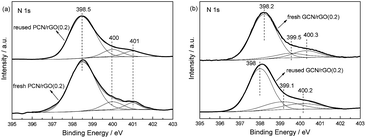
Fig. 9 shows photocatalytic stabilities of PCN/rGO(0.2) and GCN/rGO(0.2). No obvious decrease in nitrogen photofixation ability is observed for PCN/rGO(0.2) after 100 h, hinting its good stability. However, for GCN/rGO(0.2), the activity decreases obviously. After 100 h, the nitrogen photofixation ability of GCN/rGO(0.2) decreases to only 1.087 mg L−1 h−1 gcat−1. We mix the GCN and rGO with the same mass ratio as GCN/rGO(0.2) mechanically, and test the nitrogen photofixation ability. It is found that the activity of mechanical mixture is 0.981 mg L−1 h−1 gcat−1, similar to that of GCN/rGO(0.2) after 100 h reaction. This hints the structure of GCN/rGO(0.2) after long reaction time is similar like that of mechanical mixture sample. Besides, no obvious difference in XPS peak intensity and position is observed for fresh and reused PCN/rGO(0.2) in the region of N 1s (Fig. 10). However, compared with fresh GCN/rGO(0.2), it is noted that the binding energy of reused GCN/rGO(0.2) shifts obviously to lower value. The peak position of reused GCN/rGO(0.2) in N 1s region is almost the same as that of neat g-C3N4 shown in Fig. 6. This is probably attributed to the different interaction strength between g-C3N4 and rGO. The stronger interaction caused by the electrostatic attractive forces exists between PCN and rGO, leading to a better structural stability of PCN/rGO(0.2). In the case of GCN/rGO(0.2), although the π–π stacking interactions is formed between GCN and rGO, the poor interaction between them causes the structural damage after reuse.
Fig. 11a shows the photocatalytic RhB degradation performance over as-prepared catalysts under visible light irradiation. Similar to the nitrogen photofixation ability, GO shows no activity. GCN and PCN display low activities. The rate constant is 0.0025 and 0.0056 min−1 for GCN and PCN, respectively. For PCN/rGO hybrid heterojunction catalysts, the photocatalytic performances improve sharply. PCN/rGO(0.2) exhibits the highest rate constant (0.0757 min−1) which is 30 and 13.5 times higher than those of GCN and PCN. This confirms the outstanding charge separation ability and photocatalytic performance of as-prepared 2D/2D g-C3N4/rGO hybrid heterojunction catalyst. Fig. 11b shows the photocatalytic stability of RhB degradation performance over PCN/rGO(0.2). No obvious decrease is observed after three cycles, confirming its good stability.
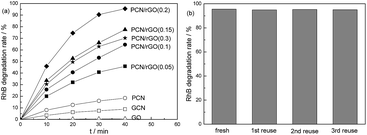 | ||
| Fig. 11 Photocatalytic RhB degradation performance over as-prepared catalysts (a) and photocatalytic stability of PCN/rGO(0.2) (b). | ||
Conclusions
A 2D/2D hybrid heterojunction photocatalyst PCN/rGO with effective interfacial contact by incorporating reduced graphene oxide (rGO) and protonated g-C3N4 (PCN) was synthesized via a novel electrostatic self-assembly strategy followed by ethylene glycol reduction process. PCN/rGO(0.2) with the mass ratio rGO/PCN of 0.2 exhibits the highest nitrogen photofixation performance under visible light. NH4+ generation rate for PCN/rGO(0.2) is 42.4, 8.3 and 3.7 times higher than that of GCN, PCN and GCN/rGO(0.2). This is ascribed to the addition of rGO with PCN in a controlled ratio as well as sufficient interfacial contact by electrostatic self-assembly process between rGO and PCN across the PCN/rGO heterojunction for efficient charge transfer to suppress the recombination of electron–hole pairs. Besides, compared with GCN/rGO(0.2), the stronger interaction caused by the electrostatic attractive forces exists between PCN and rGO, leading to a better catalytic stability of PCN/rGO(0.2). PCN/rGO(0.2) also exhibits the outstanding photocatalytic RhB degradation ability. This work opens up an effective way to prepare the heterojunction catalyst by incorporating two components with different surface charge.Acknowledgements
This work was supported by Science & Technology Research Foundation of Heilongjiang Province Education Bureau of China (No.12541626), Postdoctoral Fund of Heilongjiang province of China (No. LBH-Z14208), Education Department of Liaoning Province (No. L2014145), Environmental Science and Engineering Innovation Team of Liaoning Shihua University ([2014]-11), and Students' Innovation Fund Project of China.Notes and references
- G. N. Schrauzer and T. D. Guth, J. Am. Chem. Soc., 1977, 99, 7189 CrossRef CAS.
- (a) K. T. Ranjit, T. K. Varadarajan and B. Viswanathan, J. Photochem. Photobiol., A, 1996, 96, 181 CrossRef CAS; (b) O. Rusina, O. Linnik, A. Eremenko and H. Kisch, Chem.–Eur. J., 2003, 9, 561 CrossRef CAS PubMed; (c) K. Hoshino, Chem.–Eur. J., 2001, 7, 2727 CrossRef CAS PubMed; (d) K. Hoshino, M. Inui, T. Kitamura and H. Kokado, Angew. Chem., Int. Ed., 2000, 39, 2509 CrossRef CAS; (e) W. R. Zhao, J. Zhang, X. Zhu, M. Zhang, J. Tang, M. Tan and Y. Wang, Appl. Catal., B, 2014, 144, 468 CrossRef CAS.
- Z. W. Zhao, Y. J. Sun and F. Dong, Nanoscale, 2015, 7, 15 RSC.
- S. Z. Hu, F. Y. Li, Z. P. Fan, F. Wang, Y. F. Zhao and Z. B. Lv, Dalton Trans., 2015, 44, 1084 RSC.
- X. C. Wang, K. Maeda, A. Thomas, K. Takanabe, G. Xin, J. M. Carlsson, K. Domen and M. Antonietti, Nat. Mater., 2009, 8, 76 CrossRef CAS PubMed.
- Q. F. Deng, L. Liu, X. Z. Lin, G. H. Du, Y. P. Liu and Z. Y. Yuan, Chem. Eng. J., 2012, 203, 63 CrossRef CAS.
- M. B. Ansari, H. L. Jin, M. N. Parvin and S. E. Park, Catal. Today, 2012, 185, 211 CrossRef CAS.
- X. F. Chen, J. S. Zhang, X. Z. Fu, M. Antonietti and X. C. Wang, J. Am. Chem. Soc., 2009, 131, 11658 CrossRef CAS PubMed.
- S. C. Yan, Z. S. Li and Z. G. Zou, Langmuir, 2010, 26, 3894 CrossRef CAS PubMed.
- G. Liu, P. Niu, C. H. Sun, S. C. Smith, Z. G. Chen, G. Q. Lu and H. M. Cheng, J. Am. Chem. Soc., 2010, 132, 11642 CrossRef CAS PubMed.
- Y. J. Zhang, T. Mori, J. H. Ye and M. Antonietti, J. Am. Chem. Soc., 2010, 132, 6294 CrossRef CAS PubMed.
- G. G. Zhang, M. W. Zhang, X. X. Ye, X. Q. Qiu, S. Lin and X. C. Wang, Adv. Mater., 2014, 26, 805 CrossRef CAS PubMed.
- J. H. Li, B. Shen, Z. H. Hong, B. Z. Lin, B. F. Gao and Y. L. Chen, Chem. Commun., 2012, 48, 12017 RSC.
- D. Geng, Y. Chen, Y. Chen, Y. Li, R. Li, X. Sun, S. Ye and S. Knights, Energy Environ. Sci., 2011, 4, 760 CAS.
- Y. Sun, Q. Wu and G. Shi, Energy Environ. Sci., 2011, 4, 1113 CAS.
- Q. J. Xiang, J. G. Yu and M. Jaroniec, J. Phys. Chem. C, 2011, 115, 7355 CAS.
- Y. Li, H. Zhang, P. Liu, D. Wang, Y. Li and H. Zhao, Small, 2013, 9, 3336 CAS.
- X. H. Li, J. S. Chen, X. C. Wang, J. H. Sun and M. Antonietti, J. Am. Chem. Soc., 2011, 133, 8074 CrossRef CAS PubMed.
- Y. J. Zhang, T. Mori, L. Niu and J. H. Ye, Energy Environ. Sci., 2011, 4, 4517 CAS.
- Y. Li, H. Zhang, P. Liu, D. Wang, Y. Li and H. Zhao, Small, 2013, 9, 3336 CAS.
- K. Dai, L. H. Lu, Q. Liu, G. P. Zhu, X. Q. Wei, J. Bai, L. L. Xuan and H. Wang, Dalton Trans., 2014, 43, 6295 RSC.
- G. Z. Liao, S. Chen, X. Quan, H. T. Yu and H. M. Zhao, J. Mater. Chem., 2012, 22, 2721 RSC.
- R. C. Pawar, V. Khare and C. S. Lee, Dalton Trans., 2014, 43, 12514 RSC.
- L. M. Sun, Y. Qi, C. J. Jia, Z. Jin and W. L. Fan, Nanoscale, 2014, 6, 2649 RSC.
- Y. J. Zhang, A. Thomas, M. Antonietti and X. C. Wang, J. Am. Chem. Soc., 2009, 131, 50 CrossRef CAS PubMed.
- N. Siedl, S. O. Baumann, M. J. Elser and O. Diwald, J. Phys. Chem. C, 2012, 116, 22967 CAS.
- L. G. Zhang, D. Liu, J. Guan, X. F. Chen, X. C. Guo, F. H. Zhao, T. G. Hou and X. D. Mu, Mater. Res. Bull., 2014, 59, 84 CrossRef CAS.
- F. Dong, L. W. Wu, Y. J. Sun, M. Fu, Z. B. Wu and S. C. Lee, J. Mater. Chem., 2011, 21, 15171 RSC.
- Y. I. Kim, S. J. Atherton, E. S. Brigham and T. E. Mallouk, J. Phys. Chem., 1993, 97(45), 11802 CrossRef CAS.
- Q. Li, H. Meng, J. Yu, W. Xiao, Y. Zheng and J. Wang, Chem.–Eur. J., 2014, 20, 1176 CrossRef CAS PubMed.
- J. Zhang, J. Yu, M. Jaroniec and J. R. Gong, Nano Lett., 2012, 12, 4584 CrossRef CAS PubMed.
- Y. W. Zhang, J. H. Liu, G. Wu and W. Chen, Nanoscale, 2012, 4, 5300 RSC.
- Q. Zhang, H. Y. Wang, S. Z. Hu, G. Lu, J. Bai, X. X. Kang, D. Liu and J. Z. Gui, RSC Adv., 2015, 5, 42736 RSC.
- L. Ge and C. Han, Appl. Catal., B, 2012, 117–118, 268 CrossRef CAS.
- W. Lei, D. Portehault, R. Dimova and M. Antoniettit, J. Am. Chem. Soc., 2011, 133, 7121 CrossRef CAS PubMed.
- F. C. Wang, J. M. Zhao, M. H. Zhu, J. Z. Yu, Y. S. Hu and H. Z. Liu, J. Mater. Chem. A, 2015, 3, 1666 CAS.
- Q. Xiang, J. Yu and M. Jaroniec, J. Am. Chem. Soc., 2012, 134, 6575 CrossRef CAS PubMed.
- J. Mao, T. Peng, X. Zhang, K. Li, L. Ye and L. Zan, Catal. Sci. Technol., 2013, 3, 1253 CAS.
- L. Wang, Y. Li, Z. Han, L. Chen, B. Qian, X. Jiang, J. Pinto and G. Yang, J. Mater. Chem. A, 2013, 1, 8385 CAS.
- H. Nakajima, T. Mori, Q. Shen and T. Toyoda, Chem. Phys. Lett., 2005, 409, 81 CrossRef CAS.
- L. G. Zhang, X. F. Chen, J. Guan, Y. J. Jiang, T. G. Hou and X. D. Mu, Mater. Res. Bull., 2013, 48, 3485 CrossRef CAS.
- L. G. Zhang, D. Liu, J. Guan, X. F. Chen, X. C. Guo, F. H. Zhao, T. G. Hou and X. D. Mu, Mater. Res. Bull., 2014, 59, 84 CrossRef CAS.
- G. Z. Liao, S. Chen, X. Quan, H. T. Yu and H. M. Zhao, J. Mater. Chem., 2012, 22, 2721 RSC.
- Z. R. Hesabi, N. K. Allam, K. Dahmen, H. Garmestani and M. A. El-Sayed, ACS Appl. Mater. Interfaces, 2011, 3, 952 CAS.
- Y. Liu, Y. X. Yu and W. D. Zhang, J. Phys. Chem. C, 2013, 117, 12949 CAS.
| This journal is © The Royal Society of Chemistry 2016 |

