Formation of square prism-shaped poly(o-phenylenediamine) fibers triggered by high ionic strength†
Kunpeng Jiang,
Shenghua Ma,
Ying Zhang and
Xiaojun Han*
State Key Laboratory of Urban Water Resource and Environment, School of Chemical Engineering and Technology, Harbin Institute of Technology, 92 West Da-Zhi Street, Harbin 150001, P. R. China. E-mail: hanxiaojun@hit.edu.cn
First published on 16th February 2016
Abstract
A simple bottom-up method to fabricate novel square prism-shaped poly(o-phenylenediamine) (PoPD) hierarchical fibers is presented. PoPD oligomers obtained by H2O2 oxidizing o-phenylenediamine (oPD) monomers were triggered to aggregate into fibers by high salt solution. The fibers were fully characterized by SEM, FTIR, XRD, UV-vis spectra, and thermogravimetric techniques. Their stability when treated with high temperature in water, acidic solution and ethanol solution was investigated, which showed three different disassembly patterns due to disruption of non-covalent interactions inside the fibers. It was very interesting that PoPD fibers exhibited a strong fluorescence property (emission at 527 nm) after alkali treatment.
Introduction
Since the discovery of conducting polymers (CPs), polyaniline (PANI) and PANI derivatives have attracted wide scientific interest because their characteristic conducting properties have promising applications in optical and electronic nanodevices.1–5 One-dimensional (1D) structures, such as wires, rods, fibers and tubes, attract many scientists’ interest due to their unique electrical and thermal properties.6–8 However, sometimes 1D materials are subject to extreme synthetic conditions such as high temperature. Numerous papers have proven that the balance among weak non-covalent interactions is an important factor for aromatic organic molecules to self-assemble into 1D and spherical structures.9–11 The non-covalent interactions include π–π stacking, hydrogen bonding, hydrophobic forces, electrostatic interaction, nonspecific van der Waals forces, and dipole–dipole interactions, which enable the artificial building blocks to self-assemble into suprastructures and meanwhile maintain the stability and integrity of these suprastructures.12,13 Nevertheless, owing to their complicated cooperative interactions, the fabrication of well-defined nano/micro-structures with high tunability is still a challenging task.Poly(o-phenylenediamine) (PoPD) is a typical CP, containing a 2,3-diaminophenazine or quinoxaline repeating unit and exhibiting high thermostability. In order to construct rationally uniform PoPD structures, selective and directional non-covalent interactions should be carefully exploited during precipitation. It has been reported that the chemical oxidation method was an effective way to fabricate PoPD nano/micro-structures in aqueous solution, which utilized high redox potential reagents such as FeCl3,14–16 AgNO3,17–19 HAuCl4![[thin space (1/6-em)]](https://www.rsc.org/images/entities/char_2009.gif) 20,21 and (NH4)2S2O8.22 Alternatively, the reprecipitation approach was used to fabricate PoPD nanostructures. Dong et al. found that the interaction among oPD molecules became predominant when they were transferred from N-methyl pyrrolidone to water, which made oPD molecules aggregate.23 These methods are usually limited to one-recipe–one-structure, lacking flexibility and precision in morphology control. Recently we have developed ionic strength tuning and the microfluidic method to prepare one-recipe–various-structure PoPD nano/micro-structures.24,25 Although many aspects of the preparation conditions have been considered, the resulting product is usually spherical or flat fibers and some thermodynamic unstable structures, such as square prism-shaped fibers, have rarely been obtained so far.26–35
20,21 and (NH4)2S2O8.22 Alternatively, the reprecipitation approach was used to fabricate PoPD nanostructures. Dong et al. found that the interaction among oPD molecules became predominant when they were transferred from N-methyl pyrrolidone to water, which made oPD molecules aggregate.23 These methods are usually limited to one-recipe–one-structure, lacking flexibility and precision in morphology control. Recently we have developed ionic strength tuning and the microfluidic method to prepare one-recipe–various-structure PoPD nano/micro-structures.24,25 Although many aspects of the preparation conditions have been considered, the resulting product is usually spherical or flat fibers and some thermodynamic unstable structures, such as square prism-shaped fibers, have rarely been obtained so far.26–35
Herein, we succeeded in constructing rationally an assembly of square prism-shaped PoPD fibers with a side length of ∼4.2 μm. To the best of our knowledge, this is the first work to obtain square prism-shaped PoPD microfibers that are spontaneously formed in the water phase in a hierarchical organization from the molecular level to the micrometer scale. Non-fluorescent fibers were found to emit strong fluorescence after treating with a basic solution. The square prism-shaped PoPD hierarchical organization can be disassembled in different modes in a controlled manner.
Experimental
Materials
Sodium chloride, o-phenylenediamine (oPD), sodium hydroxide, sulfuric acid, hydrochloric acid, dihydrogen peroxide, potassium bromide and alcohol were all purchased from Sigma-Aldrich and used as received without further purification. Millipore Milli-Q water with a resistivity of 18.2 MΩ cm was used for solution preparation in all experiments.Preparation of PoPD micro structures and acidic/basic/alcohol treatments
The synthesis of PoPD fibers and their post treatment were carried out as below.Characterizations
The morphology of the PoPD microstructures were characterized with a scanning electron microscope (Quanta 200 FEG, Netherlands) at an accelerating voltage of 20 kV. The sample was prepared by casting purified products onto a piece of silicon wafer. Powder X-ray diffraction (XRD) was measured in the reflection mode (Cu K radiation) on a diffractometer (D/Max-RB, Japan). UV-vis spectra were recorded using a Cary 60 UV-vis spectrophotometer (Agilent, America). Fourier transform infrared (FTIR) spectroscopy measurements were conducted with a Thermo Scientific Nicolet iS10 FT-IR Spectrometer. Thermogravimetric (TG) analysis of the as-synthesized sample 1 was carried out using a Bruker TG-DTA 2000SA at a heating rate of 3 K per minute in the air. Fluorescence measurements were performed on a fluorescence spectrophotometer (Fluoro Max-4, America). Fluorescence microscopy images were obtained using a Nikon Eclipse 80i fluorescence microscope.Results and discussion
Preparation and characterizations of PoPD fibers
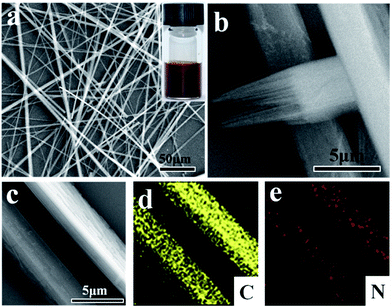
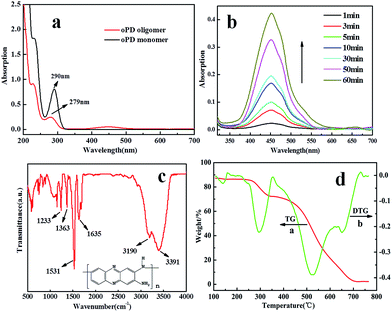
Optimized π–π stacking favors 1D growth to form crystals. SEM measurement of the self-assembly of PoPD oligomers in aqueous solution reveals well-defined fiberlike microstructures as shown in Fig. 1a. The microstructure is a uniform 1D fiber structure. The fibers can reach up to a few millimeters in length determined by using a bright field microscope (Fig. S1†). All fibers are straight without evident axial-bending, indicating their strong rigidity. The high-magnification SEM image (Fig. 1b) shows the terminal morphology of a typical fiber. Surprisingly, the fiberlike microstructures are square prism-shaped with ∼4.2 μm for each side and the broken end of a single fiber reveals a hierarchical organization from the nano level to the micrometer scale. To further confirm the compositions of the fibers, EDX was performed (Fig. 1d and e). The fiber is a carbonitride, with C and N elements evenly distributed in the whole PoPD fibers. Large scale products (Fig. S2†) were obtained with the same structure.Fig. 2a and b show the self-assembly course of oPD monitored using a UV-vis spectrophotometer. The strong absorption band at 451 nm and its shoulder at 485 nm are assigned to π–π transitions associated with the phenazine ring conjugated to the two lone pairs of electrons on the nitrogen atoms in the –NH2 groups. The freshly prepared oPD solution lacking the peaks at 451 nm and 485 nm further confirms this statement. The π–π transitions also lead to the characteristic absorption peak of the benzene ring blue shifted from 290 nm to 279 nm (Fig. 2a).9 Right after the injection of H2O2, the absorption bands of the π–π transitions increased gradually with time, indicating that the self-assembly course happened. Meanwhile, a large amount of brown precipitate was observed by the naked eye.
Fig. 2c shows the FTIR spectrum of PoPD fibers. The peak located at 1635 cm−1 can be assigned to C![[double bond, length as m-dash]](https://www.rsc.org/images/entities/char_e001.gif) N stretching vibrations in the phenazine ring. The existence of C–N stretching in the benzenoid and quinoid imine units is confirmed by two peaks at 1233 cm−1 and 1363 cm−1, respectively. The peak at 1531 cm−1 is associated with the C
N stretching vibrations in the phenazine ring. The existence of C–N stretching in the benzenoid and quinoid imine units is confirmed by two peaks at 1233 cm−1 and 1363 cm−1, respectively. The peak at 1531 cm−1 is associated with the C![[double bond, length as m-dash]](https://www.rsc.org/images/entities/char_e001.gif) C stretching vibrations in the phenazine ring. The peak at 3391 cm−1 is ascribed to the N–H stretching vibrations of the NH group. The peak at 3190 cm−1 corresponds to N–H stretching vibrations of the NH2 group. All these peaks indicate that the PoPD fibers are comprised of phenazine-like PoPD oligomers.
C stretching vibrations in the phenazine ring. The peak at 3391 cm−1 is ascribed to the N–H stretching vibrations of the NH group. The peak at 3190 cm−1 corresponds to N–H stretching vibrations of the NH2 group. All these peaks indicate that the PoPD fibers are comprised of phenazine-like PoPD oligomers.
Thermogravimetry analysis was performed up to 800 °C to gain information on the stability of the fibers (Fig. 2d). There are two weight-loss features on the TG curve, which are clearly shown by the two negative DTG peaks at 292 °C and 522 °C. The weight loss at lower temperatures (250–344 °C) is probably due to the loss of the –NH2 groups in the phenazine skeleton of the fibers, while the weight loss at higher temperatures (356–708 °C) is due to the oxidation of the carbon element into CO2.
Additional insight into the crystalline nature of the PoPD fibers was carried out by using the X-ray diffraction technique. The XRD pattern of sample 1 exhibits a series of sharp peaks in the region of 10–35° (Fig. S3†), indicating the long range ordering property of the PoPD fibers. The existence of two peaks 28.7° and 23.9° corresponding to d values of 0.31 and 0.37 nm indicates that π–π interaction might be one of the driving forces for the square prism-shaped fibers.23
Because mechanical disturbance could influence the intrinsic assembly process, the synthetic process in this work was investigated under static conditions. The self-assembly course involves complicated intermolecular interactions including π–π stacking, hydrophobic forces and other forces. In the self-assembly process, NaCl plays an important role. When the ionic strength of the solvent is increased, the residual electrostatic repulsion is screened, and the π–π interaction, which has directionality, forces the oPD oligomers to stack into a columnar structure.36,37
Deformation of the square prism-shaped PoPD fibers
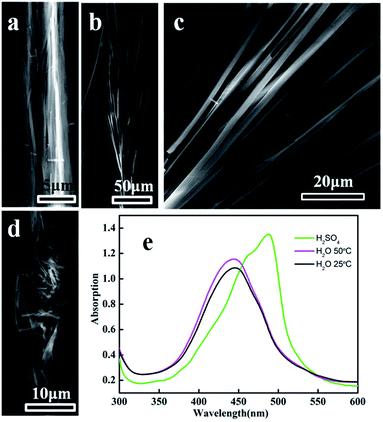
The deformation of square prism-shaped fibers was investigated to understand the assembly mechanism (Fig. 3 and 4). We assume that three forces, i.e., π–π interactions, van der Waals force and hydrophobic force play important roles in maintaining the square-prism shaped structure of the fibers. At high temperature, the van der Waals forces perpendicular to the fiber axis were weakened, making the fiber disassemble into thinner fibers, as shown in Fig. 3a and 4b. In this case, the π–π interactions were not influenced, because there is no peak position shift compared with that at 25 °C (Fig. 3e). The peak position shift in UV-vis spectra is believed to correspond to the change of π–π interactions. When treated with H2SO4 solution, the strongly protonated phenazine units caused both weakened π–π interactions and van der Waals forces, and consequently bent, thinner belts, as shown in Fig. 3d and 4c.14 Upon treating with a small amount of ethanol, lots of bifurcate structures appeared at the end of the PoPD fibers, as shown in Fig. 3b and c, which is caused by weakening of the hydrophobic force by replacing water with ethanol (Fig. 4d). A large amount of ethanol can dissolve PoPD fibers completely.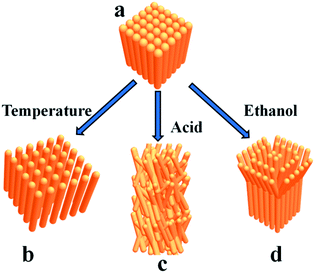 | ||
| Fig. 4 Schematic illustration of the proposed disassembly modes of the square prism-shaped PoPD fibers (a) after treating with temperature (b), acid (c) and ethanol (d), respectively. | ||
The photoluminescence property of PoPD fibers
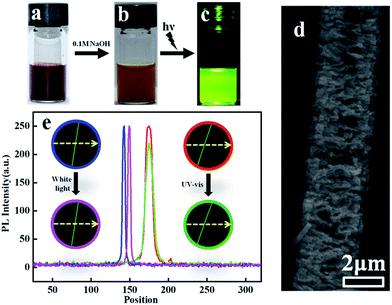
Interestingly, the deprotonation of amine groups in phenazine units in high pH solution can significantly enhance the fluorescence intensity of the PoPD fibers. The color of the PoPD fibers changes from deep brown (Fig. 5a) to light brown (Fig. 5b) after treating with alkali solution. Fig. 5c presents the photograph of an alkali treated sample under UV light. The green emission can be observed by the naked eye. The morphology of the alkali treated PoPD fiber is shown in Fig. 5d. The surface of the fiber becomes very rough, which probably explains its photoluminescence (PL) property. The photoluminescence (PL) measurements of light brown precipitates using λex = 418 nm show strong emissions at 527 nm (Fig. S4†). The quantum yield of the light brown precipitate was calculated to be 62.5%. The PL stability of this fiber was also investigated. The average PL intensity of the PoPD fibers remained the same after exposing them under strong white light for 1 h.The average PL intensity of the PoPD fibers decreased by about 7.6% after bleaching under strong UV light for 1 h. Fig. 5e shows the images and intensity of a typical fluorescence fiber before and after treating with white light and UV light. The intensities of the fiber before (blue curve) and after (pink curve) strong white light bleaching for 1 hour keep almost the same, while the intensity of the fiber (green curve) decreased a bit after UV light bleaching for 1 hour (red curve).
Conclusions
We have designed a bottom-up method using oPD oligomers as building blocks to fabricate well-defined square prism-shaped PoPD hierarchical organization. It was found that high ionic strength triggered the fiber formation. PoPD fibers showed different cleavage patterns with different treatments and three disassembly patterns have been established to understand the operation mode of the complicated cooperative non-covalent interactions in a reversed way. The proposed method in this paper also indicates ionic strength of solution may be an important parameter to be considered for controlling the morphology of micro/nano structures.Acknowledgements
This work was supported by the National Natural Science Foundation of China (Grant No. 21273059, 21003032, 21511130060, 21528501), the State Key Laboratory of Urban Water Resource and Environment (Harbin Institute of Technology) (Grant No. 2014DX09), and the Harbin Science and Technology Research Council (Grant No. 2014RFXXJ063).Notes and references
- G. Wu, K. L. More, C. M. Johnston and P. Zelenay, Science, 2011, 332, 443–447 CrossRef CAS PubMed.
- N. A. Kumar, H.-J. Choi, Y. R. Shin, D. W. Chang, L. Dai and J.-B. Baek, ACS Nano, 2012, 6, 1715–1723 CrossRef CAS PubMed.
- K. Wang, Q. Meng, Y. Zhang, Z. Wei and M. Miao, Adv. Mater., 2013, 25, 1494–1498 CrossRef CAS PubMed.
- J. K. Koh, J. Kim, B. Kim, J. H. Kim and E. Kim, Adv. Mater., 2011, 23, 1641–1646 CrossRef CAS PubMed.
- O. Bubnova, M. Berggren and X. Crispin, J. Am. Chem. Soc., 2012, 134, 16456–16459 CrossRef CAS PubMed.
- Y. Wang, S. Ma, Y. Su and X. Han, Chem.–Eur. J., 2015, 21, 6084–6089 CrossRef CAS PubMed.
- W. U. Huynh, J. J. Dittmer and A. P. Alivisatos, Science, 2002, 295, 2425–2427 CrossRef CAS PubMed.
- H. Bi, D. Fu, L. Wang and X. Han, ACS Nano, 2014, 8, 3961–3969 CrossRef CAS PubMed.
- X. Yan, J. Li and H. Möhwald, Adv. Mater., 2011, 23, 2796–2801 CrossRef CAS PubMed.
- K. Balakrishnan, A. Datar, R. Oitker, H. Chen, J. Zuo and L. Zang, J. Am. Chem. Soc., 2005, 127, 10496–10497 CrossRef CAS PubMed.
- T.-Q. Nguyen, R. Martel, P. Avouris, M. L. Bushey, L. Brus and C. Nuckolls, J. Am. Chem. Soc., 2004, 126, 5234–5242 CrossRef CAS PubMed.
- T. Kawase and H. Kurata, Chem. Rev., 2006, 106, 5250–5273 CrossRef CAS PubMed.
- C. Janiak, J. Chem. Soc., Dalton Trans., 2000, 3885–3896 RSC.
- D. He, Y. Wu and B.-Q. Xu, Eur. Polym. J., 2007, 43, 3703–3709 CrossRef CAS.
- X. Sun and M. Hagner, Langmuir, 2007, 23, 10441–10444 CrossRef CAS PubMed.
- S. Guo, S. Dong and E. Wang, Chem. Mater., 2007, 19, 4621–4623 CrossRef CAS.
- X. Sun, S. Dong and E. Wang, Macromol. Rapid Commun., 2005, 26, 1504–1508 CrossRef CAS.
- X. Sun, S. Dong and E. Wang, J. Colloid Interface Sci., 2005, 290, 130–133 CrossRef CAS PubMed.
- J. Tian, S. Liu and X. Sun, Langmuir, 2010, 26, 15112–15116 CrossRef CAS PubMed.
- X. Sun, S. Dong and E. Wang, Chem. Commun., 2004, 1182–1183 RSC.
- X. Sun, S. Dong and E. Wang, Angew. Chem., Int. Ed., 2004, 116, 6520–6523 CrossRef.
- L. Zhang, L. Chai, H. Wang and Z. Yang, Mater. Lett., 2010, 64, 1193–1196 CrossRef CAS.
- H. Jiang, X. Sun, M. Huang, Y. Wang, D. Li and S. Dong, Langmuir, 2006, 22, 3358–3361 CrossRef CAS PubMed.
- K. Jiang, S. Ma, H. Bi, D. Chen and X. Han, J. Mater. Chem. A, 2014, 2, 19208–19213 CAS.
- L. Wang, S. Ma, B. Yang, W. Cao and X. Han, Chem. Eng. J., 2015, 268, 102–108 CrossRef CAS.
- S.-W. Yang and F. Liao, Nano, 2011, 6, 597–601 CrossRef CAS.
- S. Yang and F. Liao, Synth. Met., 2012, 162, 1343–1347 CrossRef CAS.
- S. Yang, S. Huang, D. Liu and F. Liao, Synth. Met., 2012, 162, 2228–2235 CrossRef CAS.
- S. Yang, D. Liu, F. Liao, T. Guo, Z. Wu and T. Zhang, Synth. Met., 2012, 162, 2329–2336 CrossRef CAS.
- T. Zhang, S. Yang, J. Sun, X. Li, L. He, S. Yan, X. Kang, C. Hu and F. Liao, Synth. Met., 2013, 181, 86–91 CrossRef CAS.
- F. Liao, S. Yang, X. Li, L. Yang, Z. Xie, C. Hu, S. Yan, T. Ren and Z. Liu, Synth. Met., 2014, 189, 126–134 CrossRef CAS.
- F. Liao, S. Yang, X. Li, S. Yan, C. Hu, L. He, X. Kang, X. Song and T. Ren, Synth. Met., 2014, 190, 79–85 CrossRef CAS.
- X. Song, S. Yang, L. He, S. Yan and F. Liao, RSC Adv., 2014, 4, 49000–49005 RSC.
- S. Yan, S. Yang, L. He, C. Ye, X. Song and F. Liao, Synth. Met., 2014, 198, 142–149 CrossRef CAS.
- F. Liao, X. Song, S. Yang, C. Hu, L. He, S. Yan and G. Ding, J. Mater. Chem. A, 2015, 3, 7568–7574 CAS.
- G. V. Jensen, R. Lund, J. Gummel, T. Narayanan and J. S. Pedersen, Angew. Chem., Int. Ed., 2014, 126, 11708–11712 CrossRef.
- S. Srivastava, D. Nykypanchuk, M. Fukuto, J. D. Halverson, A. V. Tkachenko, K. G. Yager and O. Gang, J. Am. Chem. Soc., 2014, 136, 8323–8332 CrossRef CAS PubMed.
Footnote |
| † Electronic supplementary information (ESI) available: Optical microscopy image, large scale experimental and XRD spectra of sample 1. Fluorescence spectra of sample 1 before and after treating with basic solution. See DOI: 10.1039/c6ra00204h |
| This journal is © The Royal Society of Chemistry 2016 |

