Enhanced electroactive β-phase nucleation and dielectric properties of PVdF-HFP thin films influenced by montmorillonite and Ni(OH)2 nanoparticle modified montmorillonite
Swagata Roya,
Pradip Thakurab,
Nur Amin Hoquea,
Biswajoy Bagchi†
a and
Sukhen Das‡
*a
aDepartment of Physics, Jadavpur University, Kolkata- 700032, India. E-mail: sdasphysics@gmail.com; Tel: +91 9433091337
bDepartment of Physics, Netaji Nagar College for Women, Kolkata-700092, India
First published on 16th February 2016
Abstract
The present work lays emphasis on the synthesis of electroactive and high dielectric poly(vinylidenefluoride-co-hexafluoropropylene) (PVdF-HFP) composite films incorporated with montmorillonite (MMT) and Ni(OH)2 nanoparticle (NP) modified MMT using a facile and low cost solution casting technique. Formation of Ni(OH)2 NPs, different polymorphs and morphology of the composite samples have been investigated using UV-visible spectroscopy, X-ray diffraction, Fourier transform infrared spectroscopy, differential scanning calorimetry and field emission scanning electron microscopy. A remarkable improvement in β-phase nucleation (∼85.22% for 1 mass% MMT doped at and 82.10% for 7.5 mass% NiMMT doped polymer composites films) and promising dielectric values are the standpoints of the work. Strong ion–dipole interaction between the negatively charged surfaces of MMT and –CH2 dipoles of the polymer chains in the MMT loaded PVdF-HFP samples and formation of hydrogen bonds between the –OH group of Ni(OH)2 NPs and F atom of the polymer chains in the Ni(OH)2 NP-MMT/PVdF-HFP system play a dynamic role in enhancing the electroactive β-phase nucleation and the dielectric properties of the samples. A large accumulation of charges at the interfaces of the dopant and polymer matrix via Maxwell–Wagner–Sillars interfacial polarization effect occurred due to the disparity in the conductivity of the dopants and the polymer matrix is liable for the significant enrichment of dielectric properties of the composite films. Excellent thermal stability in dielectric properties has also been observed in these composite samples over a wide temperature spectrum. These electroactive and high dielectric polymer composite thin films may be potential candidates for application in piezoelectric nanogenerators, energy storage devices, thin film transistors and capacitive sensors etc.
1. Introduction
The modern era has recognized dielectric spectroscopy as a crucial tool in the exploration of the dielectric relaxation process in different polymeric compounds when treated with an electric field. Notable reformation of physical, chemical, electrical and piezoelectric properties of dielectric polymers such as poly(vinylidene fluoride) (PVdF) and its copolymers are the noteworthy consequences of this process.1PVdF is one of the rarest, flexible, high molecular weight, complex electroactive hydrofluorocarbon polymers that has well-established piezoelectric, pyroelectric and dielectric properties. Added improvement of the piezoelectricity and mechanical behavior properties can be acknowledged when other monomer units like hexafluoropropylene (HFP) are attached to the main PVdF chain. Henceforth, PVdF copolymers like poly(vinylidenefluoride-co-hexafluoropropylene) (PVdF-HFP) turn out to be unique prospects with similar crystalline structures to that of PVdF but enriched flexibility and chemical resistance. Owing to properties like nontoxicity, high stability, shape and size tailor ability and recycling aptitude, these copolymers are gaining impetus in widespread energy harvesting technologies.2
Piezoelectric and capacitive sensors, thin film transistors, batteries, chemical warfare protection, electroacoustic transducers, electrochemical convertors, infrared detectors, actuators, ferroelectric memory devices and artificial muscles are a few expanses of utilization of the polymer.
Five distinguished polymorphs α, β, γ, δ and ε describe PVdF-HFP. The non-polar α-polymorph, characterized by a TGTG′ conformation of polymeric chains and obtained directly from the melt at moderate or high supercoolings or polymerization, is the most common and dominant phase amongst the five phases. However, the β-polymorph, having an all trans (TTTT) zigzag conformation, can be thought to be superior among the phases owing to its largest polarization per unit cell (8 × 10⁻³⁰ C m) in comparison to the other two polar phases i.e. γ-phase and δ-phase having a T3GT3G′ and TGTG′ conformation, respectively.3,4 Hence, cultivation of β-phase nucleation in PVdF-HFP has received great interest in recent times for its superior performance in piezoelectric, pyroelectric, ferroelectric and dielectric extents.
Various studies have been undertaken to enhance the β-phase activity with the incorporation of nano modifiers. Priya and Jog were the pioneers who worked on the development of the polar phase in PVdF in the presence of organically modified bentonite clay Cloisite®6A and Cloisite®20A and results confirmed an increase in the melting temperature and crystallization rate of the clay polymer composites.5–7 A complete β-phase transformation of PVdF on the addition of Cloisite®30B was attained by Shah et al.9 Thakur et al.8 also concluded an enhancement of β-phase and dielectric properties of PVdF on addition of clays like Kaol and Hal.
Cost-effectivity, good compatibility, good cationic exchange and absorbance capacity of MMT make this clay an attractive material as a dopant.10,11 Repetitive octahedrons of alumina stuck in between two tetrahedral silica sheets defines the structure of MMT. Intercalation of MMT flakes in the polymer matrix favors the advancement in the mechanical strength, thermal stability and the dielectric constant which arises from the assimilation of two materials with complementary dielectric properties.12
Zhang et al. studied the use of MMT and PVdF and crystallinity was enhanced in their study.13 The crystallization behavior of PVdF/MMT composites were also investigated by Yu et al.14 Similar studies were also carried out by Dillon et al. using nanoclays (Cloisite®15A and Cloisite®25A) and PVdF.15
Kelarakis et al. were the first to study the structural and dielectric properties of a series of organo-MMT/PVdF-HFP composites.16 Very few studies have been done by researchers on the phase inversion mechanism and dielectric properties of PVdF-HFP/MMT composites. Most studies revolve around their applications in membranes, separators for the lithium-ion batteries17–20 solid state dye sensitized solar cells12 and fuel cells.21
Numerous works regarding organically modified MMT doped polymer have been reported.5–7 However, there are a very few studies on inorganically modified MMT polymer composites. Ni(OH)2 NPs can be synthesized in a simplistic and cost effective way. Also, they are environmentally benign, have a high theoretical specific capacitance and remarkable redox behavior which makes them a potential material of interest.22
The present work deals with a comparative study on the increase of the electroactive β-phase nucleation, its transformation mechanism and dielectric properties of a PVdF-HFP thin film due to incorporation of negatively charged MMT layers and Ni(OH)2 NP modified MMT in various percentages (1–10 mass%) in the polymer matrix via a simplistic solution casting method. Furthermore, a detailed dielectric study is also carried out over a temperature range from 30 °C to 140 °C. Promotion of electroactive β-phase nucleation and enrichment of the dielectric properties of the composite samples have been suitably discussed in terms of strong electrostatic interaction and large accumulation of charges between the interfaces of the dopants and polymer chains.
2. Experimental
2.1. Materials
Poly(vinylidene fluoride-co-hexafluoropropylene) pellets (Aldrich, Germany, Mw: 455![[thin space (1/6-em)]](https://www.rsc.org/images/entities/char_2009.gif) 000 GPC; Mn: 110
000 GPC; Mn: 110![[thin space (1/6-em)]](https://www.rsc.org/images/entities/char_2009.gif) 000), montmorillonite clay (MMT) (<1 μm) (NanoCorUSA), dimethyl sulfoxide (DMSO) (Merck India), and nickel acetate tetrahydrate extra pure [(CH3·COO)2Ni·4H2O] (LOBA Chemie) are the precursors used in the composite polymer film synthesis.
000), montmorillonite clay (MMT) (<1 μm) (NanoCorUSA), dimethyl sulfoxide (DMSO) (Merck India), and nickel acetate tetrahydrate extra pure [(CH3·COO)2Ni·4H2O] (LOBA Chemie) are the precursors used in the composite polymer film synthesis.
2.2. Synthesis of Ni2+ ion adsorbed MMT (NiMMT)
Briefly, 200 mg of MMT and 400 mg of nickel acetate was added to 20 ml of deionized water in a beaker and the mixture was stirred overnight. Then the Ni2+ ion adsorbed MMT composite was collected by centrifugation (16![[thin space (1/6-em)]](https://www.rsc.org/images/entities/char_2009.gif) 000 rpm for 15 min) and was dried in a hot-air oven at 80 °C for further synthesis.
000 rpm for 15 min) and was dried in a hot-air oven at 80 °C for further synthesis.
2.3. Synthesis of MMT and Ni(OH)2 NP modified MMT (NiMMT) doped PVdF-HFP thin films
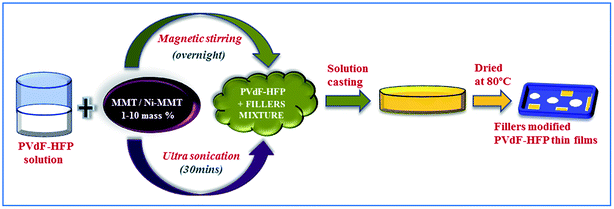
4% PVdF-HFP solution was prepared at 60 °C by dissolving 0.2 g of PVdF-HFP in 5 ml DMSO and formerly synthesized purified clay (MMT and NiMMT) was added to the PVdF-HFP solution in definite amounts (1–10 mass%, Table 1). The mixture was then stirred overnight using a magnetic stirrer followed by 30 min ultra-sonication for complete homogeneous mixing.| Sample name | Amount of PVdF-HFP (g) | Percentage of clay minerals (mass%) | Amount of clay minerals (g) | Name of the material doped |
|---|---|---|---|---|
| PVdF-HFP | 0.2 | 0 | 0 | |
| PMT 1% | 0.2 | 1.0 | 0.002 | Montmorillonite (MMT) |
| PMT 2.5% | 0.2 | 2.5 | 0.005 | |
| PMT 5% | 0.2 | 5.0 | 0.010 | |
| PMT 7.5% | 0.2 | 7.5 | 0.015 | |
| PMT 10% | 0.2 | 10.0 | 0.020 | |
| PNiMT 1% | 0.2 | 1.0 | 0.002 | Ni(OH)2 Modified Montmorillonite (NiMMT) |
| PNiMT 2.5% | 0.2 | 2.5 | 0.005 | |
| PNiMT 5% | 0.2 | 5.0 | 0.010 | |
| PNiMT 7.5% | 0.2 | 7.5 | 0.015 | |
| PNiMT 10% | 0.2 | 10.0 | 0.020 |
A clean Petri dish was taken in which the mixture was poured to cast the film (50–60 μm) and placed at 80 °C in a dust free hot-air oven for 12 h for complete evaporation of the solvent. Pure PVdF-HFP films were also prepared without adding the dopants under similar conditions as a control in this study. The synthesized MMT and Ni(OH)2 modified MMT PVdF-HFP films were then stored in a vacuum desiccator for further characterizations (Fig. 1).
2.4. Material characterization
Each sample was scanned 50 times while collecting the FTIR data. The fraction of β-phase, F(β) of the composite thin films was calculated using the Lambert–Beer law which is given as:
 | (1) |
The DSC curves as obtained helped in the evaluation of the enthalpies (ΔHm) of fusion of the pure and composite films. The degree of crystallinity (Xc) of the same was assessed from the equation given below:
| Xc = ΔHm/ΔH100% | (2) |
| ε = Cd/ε0A | (3) |
σac = 2πfε0ε![[thin space (1/6-em)]](https://www.rsc.org/images/entities/char_2009.gif) tan tan![[thin space (1/6-em)]](https://www.rsc.org/images/entities/char_2009.gif) δ δ
| (4) |
![[thin space (1/6-em)]](https://www.rsc.org/images/entities/char_2009.gif) δ are the capacitance, thickness, area and tangent loss of the samples respectively, f is the applied frequency in Hz and ε0 is permittivity of free space with value 8.854 × 10⁻¹² F m−1.
δ are the capacitance, thickness, area and tangent loss of the samples respectively, f is the applied frequency in Hz and ε0 is permittivity of free space with value 8.854 × 10⁻¹² F m−1.3. Results and discussions
3.1. UV-vis absorption properties
The optical absorbance spectra of the pure polymer film and MMT or NiMMT doped PVdF-HFP composite films, examined under the ultraviolet-visible electromagnetic spectrum are exhibited in Fig. 2. No characteristic absorption peak is detected for the pure PVdF-HFP film in the UV-vis spectrum.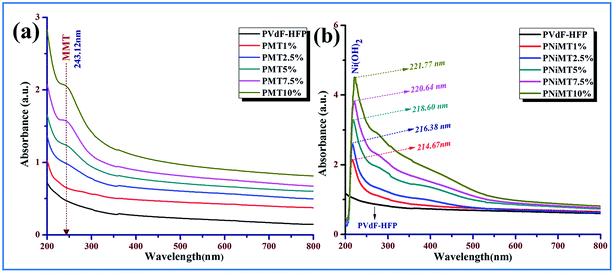 | ||
| Fig. 2 UV-visible absorption spectra of pure PVDF-HFP and composite films; (a) MMT doped PVdF-HFP films and (b) Ni(OH)2 NP modified MMT doped PVdF-HFP films. | ||
A small and weak absorption peak is observed at 243 nm in Fig. 2(a) due to the metal cation charge transfer transition which increases in intensity with the increment of the doping concentrations of MMT in the polymer films signifying the homogeneous embedment of the clay in the PVdF-HFP matrix.23
In the NiMMT doped PVdF-HFP films (Fig. 2(b)), an absorption peak is noticed at 214.67 nm (∼5.80 eV) which established the formation of Ni(OH)2 NPs in the polymer matrix.24 Electronic transfer of Ni2+ in the oxygen octahedral sites from the ground state 3T1g (P) to the 3T1g (F) state results in the appearance of the characteristic absorption peak of the Ni(OH)2 NPs. A slight shift of this characteristic peak is noticed with an increase in the concentrations of NiMMT in the PVdF-HFP. The peak shift is clearly denoted in Fig. 2(b) which may be due to the strong electrostatic interactions of Ni(OH)2 NPs with the PVdF-HFP chains or because of the slight variation in size and morphology of the Ni(OH)2 NPs formed in the polymer matrix, upsetting the electronic transition in the conduction or valence bands and resulting in the prominent interaction of the Ni(OH)2 NPs in MMT clay with the polymer. The characteristic absorption peak of the Ni(OH)2 NPs strengthens gradually with the increase in doping concentration which suggests the complete formation of Ni(OH)2 NPs on the surface of MMT in the PVdF-HFP matrix.
3.2. X-ray diffraction analysis
XRD patterns of pure MMT, Ni2+ ion adsorbed MMT, pure PVdF-HFP and MMT/NiMMT doped PVdF-HFP composite films with various weight percentages of MMT and NiMMT (1–10 mass%) are displayed in Fig. 3.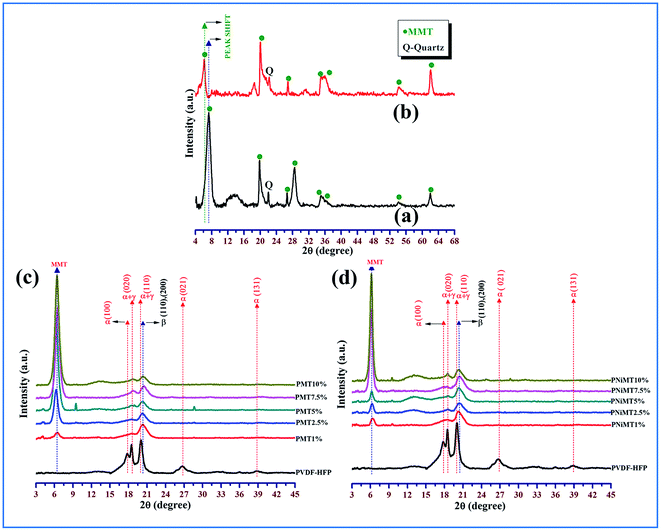 | ||
| Fig. 3 X-ray diffractograms of (a) MMT, (b) Ni2+ ion adsorbed MMT, (c) MMT doped PVdF-HFP composite films and (d) NiMMT doped PVdF-HFP composite films. | ||
Characteristic reflections of the crystalline phases of the pure PVdF-HFP membrane appear in the XRD spectrum at 2θ = 17.9° (020), 26.8° (021) and 38.8° (131) which relates to the bigger spherulites of the non-polar α-phase crystals while 2θ = 18.5° (100) and 20.1° (110) corresponds to the smaller spherulites of the γ-phase crystal which are found to co-exist with the α-phases.12,25,26
The characteristic peak at 2θ = 20.3° corresponds to the superposition of the (110) and (200) β-phase diffraction in the spectrum.27,28
The diffraction peak at 2θ = 7.2° in the XRD spectrum reveals the presence of MMT29 whereas in the Ni2+ adsorbed MMT powder, the clay peak is shifted to 2θ = 6.2° as shown in Fig. 3(a) and (b). On the other hand, the spectra of MMT or NiMMT doped PVdF-HFP composite films reflects the shift of this characteristic clay peak towards the left side of the spectrum resulting in a diffused peak around 2θ = 6.44° for all the composite films. The observed results demonstrate the strong intercalation of the clay particles in the polymer PVdF-HFP matrix. This type of structure is formed due to the interaction between the clay layers and PVdF-HFP or because of shear induced interaction. This reflection goes intense with the increase in the doping concentration of MMT and NiMMT in the PVdF-HFP matrix (Fig. 3(c) and (d)).30,31
It is quite vibrantly reflected from the spectra of the composite films that peaks corresponding to the γ-phase and α-phase crystals (2θ = 17.9°, 18.5°, 20.1°, 26.8°, 38.8°) disappeared with the doping of MMT and NiMMT content in the PVdF-HFP matrix and only one distinct characteristic peak at 2θ = 20.3° ((110), (200)) appeared which confirmed the nucleation of the electroactive β-phase nucleation in the synthesized composite films.25 The nucleation of the β-phase is substantial in the 1 mass% doping concentration of MMT in the case of MMT–PVdF-HFP composite films (Fig. 3(c) and (d)). Surprisingly two weaker XRD peaks have been observed at 9° and 29° in the 5% MMT doped PVdF composite (Fig. 3(c)). This may be due to the presence of some unknown phases in the composite at that particular concentration. On the other hand, the intensity of the β-phase increased gradually in the NiMMT–PVdF-HFP composite films and was found to be maximum for 7.5 mass% doping of NiMMT clay. The variation of the nucleating action of the two dopants may be attributed to the disparity of morphology and surface charges of the MMT/NiMMT of the doped films. The catalytic activity of MMT excels over NiMMT in β-phase crystallization in the PVdF-HFP matrix which is due to the significant stabilizing effect of negatively charged flat surfaces of MMT layers via ion–dipole interaction (between negatively charged flat surfaces of clay and –CH2 dipoles of polymer chains) than positively charged Ni(OH)2 NPs modified MMT.
3.3. Fourier transform infrared spectroscopy
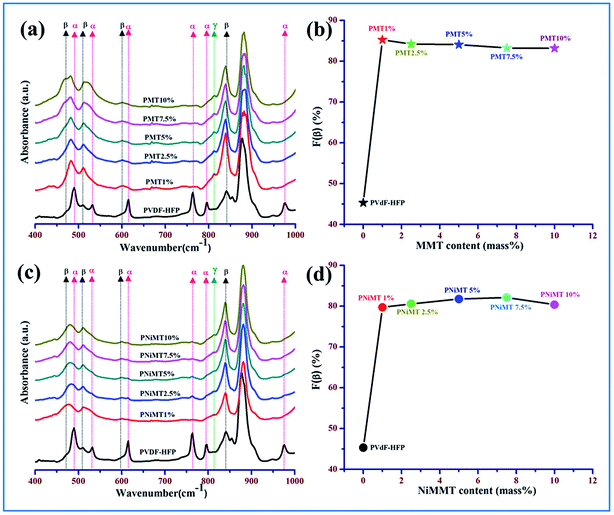
Investigation has been executed to define the various crystalline polymorphs present in unmodified PVdF-HFP, MMT and NiMMT modified PVdF-HFP composite thin films using one of the techniques recognized as Fourier transform infrared (FTIR) spectroscopy and hereafter to determine the α, β and γ phases of PVdF-HFP as shown in Fig. 4.In the untreated PVdF-HFP films, the absorbance bands are detected at 490 cm−1 (–CF2 wagging), 530 cm−1 (–CF2 bending), 615 cm−1 (skeletal bending), 764 cm−1 (–CF2 bending), 795 cm−1 (–CH2 rocking) and 975 cm−1 (twisting) in the IR spectra which are related to the presence of the non-polar α-phase in PVdF-HFP. Small absorbance peaks of the β-phase are also found at 509 cm−1 (–CF2 stretching) and 840 cm−1 (–CH2 rocking, –CF2 stretching and skeletal C–C stretching) in the spectrum32 (Fig. 4(a) and (c)).
In both MMT and NiMMT treated PVdF-HFP films, all the absorbance bands due to the α-phase ceased to exist and the absorbance peaks at 509 cm−1 (–CF2 stretching) and 840 cm−1 (–CH2 rocking, –CF2 stretching and skeletal C–C stretching) are prominent, signifying the strong emergence of the electroactive β-phase33,34(Fig. 4(a) and (c)).
The main absorbance peak of the β-phase at 840 cm−1 is found to have the strongest intensity for 1 mass% of MMT embedded PVdF-HFP film while in the NiMMT–PVdF-HFP composite films the absorbance peak at 840 cm−1 gradually has been strengthened with increasing concentrations of NiMMT and reached its maximum value at 7.5 mass% of NiMMT content which indicates intimate interactions in the composite films for that particular concentration.
Evaluation of the relative fraction of the β-phase content F(β) in pure PVdF-HFP, MMT and NiMMT loaded polymer composite films have been executed from the IR spectra using the Lambert–Beer law stated in eqn (1). Graphical representation of the percentage variation of F(β) (%) with the MMT and NiMMT content is shown in Fig. 4(b) and (d) respectively. About 45.31% F(β) is obtained for the pure PVdF-HFP film. With the increase in concentration (mass%) of both MMT and NiMMT in the PVdF-HFP matrix, F(β) increases and almost saturates at higher doping concentrations. Maximum F(β) values of ∼85.22% for 1 mass% loading of MMT and ∼82.10% at 7.5 mass% incorporation of NiMMT in PVdF-HFP composite film were achieved. Henceforth, stabilization and nucleation of the electroactive β-phase, enhanced with the addition of MMT and NiMMT content are well approved from FTIR spectroscopic measurements.
3.4. Differential scanning calorimetry
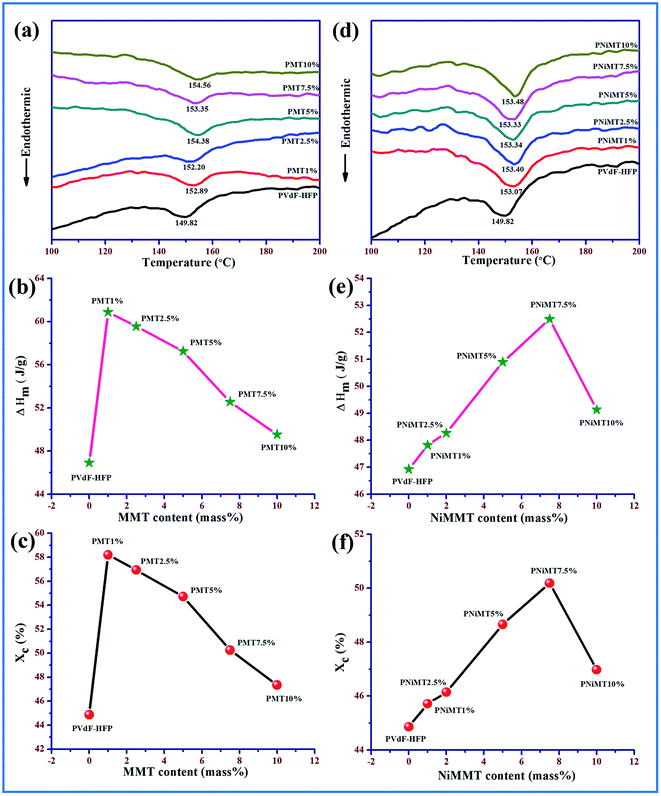
Different phase, thermal property, enthalpy and degree of crystallinity of the pure and composite polymer film samples have been investigated using differential scanning calorimetry thermograms shown in Fig. 5. The melting temperature (Tm) is observed around 149 °C for the pure PVdF-HFP film12,35 while for the MMT–PVdF-HFP films, the melting temperature shows a prominent shifting to higher temperature by about 2–4 °C (Fig. 5(a)). A slight variation of melting temperature with concentration is also perceived for Ni(OH)2 modified MMT doped polymer films with respect to the pristine PVdF-HFP film (Fig. 5(d)). Enhancement in the β-phase in the doped films is responsible for this escalation of melting temperatures.7,9,13Melting enthalpies are evaluated from the thermographs and thereafter the degree of crystallinity for all the samples was calculated using eqn (2). Variation of melting enthalpy and degree of crystallinity of the samples are graphically illustrated in Fig. 5(b), (e), (c) and (f). A detectable upsurge in the enthalpy of fusion and hence the degree of crystallinity for both the composite samples compared to the pure PVdF-HFP film are noticed with the increasing concentration of the additives.36 Increase in the crystallinity of the composite samples may be due to the active interaction of the additives with polymer chains which induces the formation of polar β polymorphs from non-polar α spherulites.27 The degree of crystallinity has been found highest at ∼58% and 50% for 1 mass% and 7.5 mass% of MMT and NiMMT doped polymer films respectively as both the concentrations exhibit maximum β-polymorphs. However, higher loading concentrations of the additives in the polymer matrix reduce the crystallinity due to confinement of the movement of the polymer chains.9,13
3.5. Scanning electron microscopy
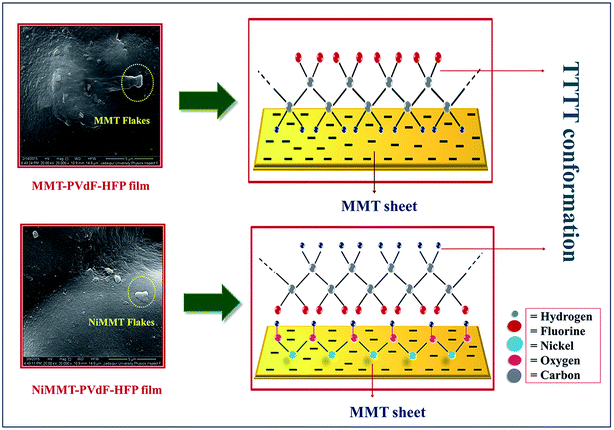
FESEM images clearly demonstrate the surface morphology of the MMT flakes, Ni2+ ion adsorbed MMT, pure PVdF-HFP and the composite film samples as shown in Fig. 6. The good uniform distribution and strong interaction of the MMT flakes in both MMT and NiMMT doped PVdF-HFP samples can be described from the encircled areas in the polymer matrix as depicted in the FESEM images (Fig. 6(d) and (e)).37,38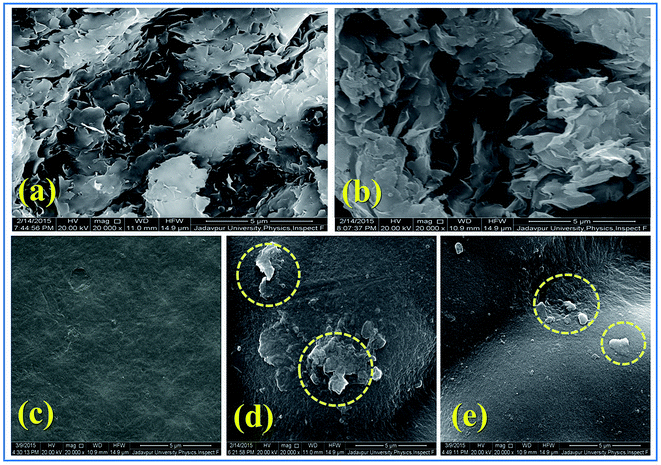 | ||
| Fig. 6 FESEM micrographs of (a) MMT flakes, (b) Ni2+ ion adsorbed MMT, (c) pristine PVdF-HFP surface, (d) 10 mass% MMT doped PVdF-HFP films and (e) 10 mass% NiMMT doped PVdF-HFP films. | ||
3.6. Phase transformation mechanism
Schematic representation of the most anticipated electroactive β-phase interaction mechanism between the MMT surfaces or NiMMT surfaces and the PVdF-HFP chains has been illustrated in Fig. 7.When MMT flakes are intercalated in the polymer matrix, the interaction between the negatively charged surface of the doped clay mineral and the positive –CH2 dipoles from (CH2–CF2) monomer of the PVdF-HFP alters the polarity and gives rise to the nucleation of the β-phase in composite samples. However, impregnation of Ni(OH)2 NP modified MMT clay in the polymer matrix, portrays a different picture of the interaction mechanism. Ni2+ ions strongly interact with the negatively charged surfaces of the MMT flakes and the H atoms of the Ni(OH)2 NPs go through a strong interaction with the F atoms of the polymer chains via formation of hydrogen bonds establishing longer TTTT conformation in NiMMT modified PVdF-HFP samples (Fig. 7). The additives act as a substrate for β-phase nucleation when prepared films are dried at 80 °C. Thus, the stimulation of stabilized alignment of the polymer chains due to these substrates results in the formation of elongated electroactive all trans conformation i.e. β-phase nucleation.9,13,39 Maximum β-phase is attained at 1 mass% of MMT doped polymer films while the same is obtained at 7.5 mass% in case of NiMMT–PVdF-HFP films. Results achieved throws light on the fact that negatively charged MMT is much efficient in enhancing the TTTT conformation compared to positively charged NiMMT. These results have also been justified by XRD, FTIR and DSC data.
3.7. Dielectric properties
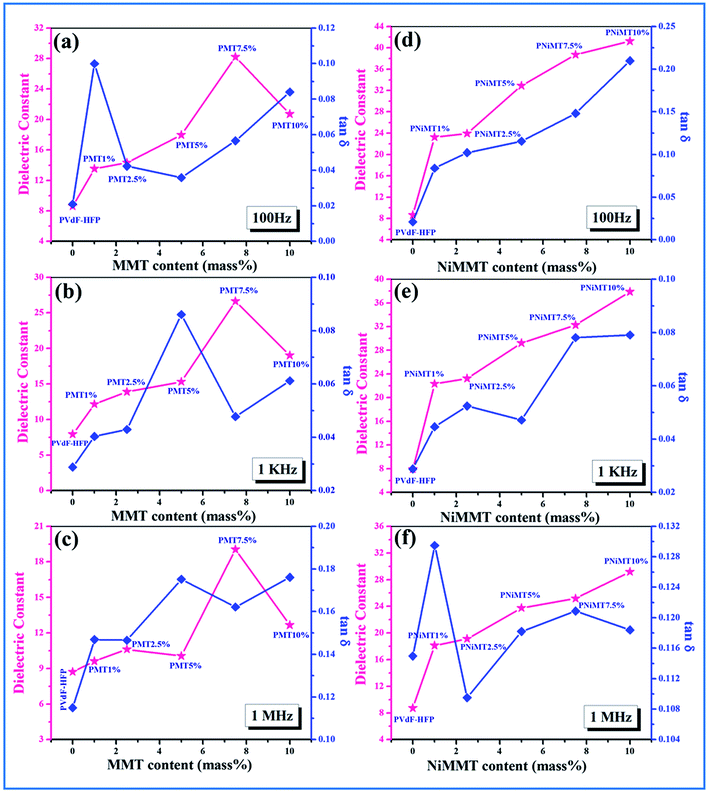
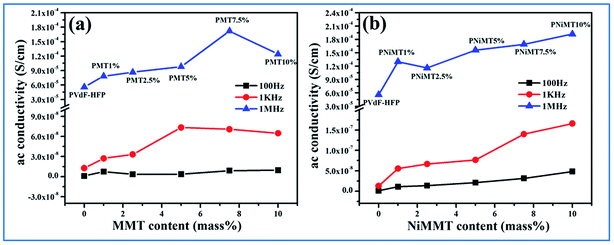
![[thin space (1/6-em)]](https://www.rsc.org/images/entities/char_2009.gif) δ) and ac conductivity (σac) of pure PVdF-HFP film, MMT and Ni(OH)2 NPs modified MMT incorporated PVdF-HFP composite films as a function of MMT and NiMMT content (mass%) were measured at 100 Hz, 1 kHz and 1 MHz at ambient condition have been displayed in Fig. 8 and 9.
δ) and ac conductivity (σac) of pure PVdF-HFP film, MMT and Ni(OH)2 NPs modified MMT incorporated PVdF-HFP composite films as a function of MMT and NiMMT content (mass%) were measured at 100 Hz, 1 kHz and 1 MHz at ambient condition have been displayed in Fig. 8 and 9.
A gradual increase in dielectric constant is observed for both MMT and NiMMT loaded PVdF-HFP films with the increase in their content (mass%) at the mentioned frequencies. Highest dielectric constants of 28, 26 and 19 are calculated for 7.5 mass% doping of MMT in PVdF-HFP matrix at 100 Hz, 1 kHz and 1 MHz frequencies respectively, while the dielectric constant values ∼41, 38 and 29 for 10 mass% doping of Ni(OH)2 NPs modified MMT in PVdF-HFP composite films are obtained at the respective frequencies (Fig. 8) using eqn (3).
Maxwell–Wagner–Sillars (MWS) interfacial polarization which occurs due to the difference in conductivity of the dopants and polymer is accountable for the enrichment of dielectric constant in the doped films with increase in doping concentration compared to the pure polymer film.40–42
The dielectric constant of the NiMMT–PVdF-HFP film is higher than the MMT–PVdF-HFP film. This disparity is mainly due to the formation of large interfaces in the three phase NiMMT–PVdF-HFP composite film than the two phase MMT–PVdF-HFP composite film. With increasing MMT content in the polymer matrix the interfacial area per unit volume associated with the interfaces of clay particles and the polymer chains crop up. Also the inter-particle distance reduces. All these, along with the strong interaction formed between the negatively charged surface of MMT and positive –CH2 dipoles, influence the significant strengthening of the average localized polarization accompanied with the clay particles and the coupling between the adjoining grains. Hence the dielectric constant of the MMT modified polymer films improves with respect to the pure polymer film as well as with the increase in doping concentration.
However, the Ni(OH)2 NP modified MMT doped polymer film introduces us with a three phase system having two interfaces, MMT/Ni(OH)2 NPs and Ni(OH)2 NPs/PVdF-HFP. Under the action of the electric field, the negatively charged surfaces of the MMT layers strongly interact with the Ni(OH)2 NPs and the –OH groups of the NPs pursue the same with the F atoms of the polymer chains establishing large interfacial surfaces. Thus larger interfacial polarization and further enhancement of dielectric constant occurs here in comparison to the two phase MMT–PVdF-HFP composite films. Also, an increase in dopant content in the polymer matrix results in the intensification of fraction of electroactive β-phase nucleation. This further leads to the increase in the number of free amorphous chains in the film samples and also contributes to the increase in dielectric strength.9,43 A non-ohmic trend is sensed for the tangent loss for the MMT and Ni(OH)2 NP modified MMT–PVdF-HFP composite films. Ac conductivity of both the composites is found to increase in an almost linear fashion.
![[thin space (1/6-em)]](https://www.rsc.org/images/entities/char_2009.gif) δ) and the ac conductivity of the pure PVdF-HFP film, MMT and Ni(OH)2 NPs modified MMT–PVdF-HFP composite films are illustrated in Fig. 10.
δ) and the ac conductivity of the pure PVdF-HFP film, MMT and Ni(OH)2 NPs modified MMT–PVdF-HFP composite films are illustrated in Fig. 10.
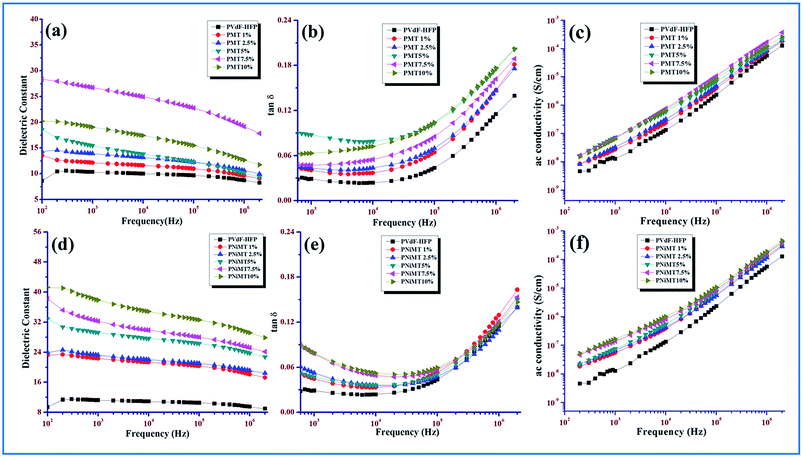 | ||
| Fig. 10 Frequency dependency of he dielectric properties of pure PVdF-HFP, MMT and NiMMT doped PVdF-HFP films (a) and (d) dielectric constant; (b) and (e) tangent loss (c) and (f) ac conductivity. | ||
The gradual decrease of the dielectric constant values at higher frequencies of all the synthesized samples and the increase of dielectric values with the increase in the doping concentration for both the MMT and Ni(OH)2 NPs modified MMT doped PVdF-HFP films are visibly evident from the illustrations (Fig. 10(a) and (d)). Both of these observations can be enlightened by the well-known MWS interfacial polarization effect.9 According to the MWS effect, when the composite film samples are treated with an electric field, a huge accretion of charge carriers from the impurities (i.e. dopants) or the electrode of both the composite films propagate liberally and get sandwiched amidst the interfaces of the dopant particles and the polymer chains due to the dissimilarity in electrical conductivity between the dopant and polymer matrix. A large interfacial polarization and hence a substantial increase in dielectric constant are the two plausible upshots of the colossal deposition of the charge carriers at the interfaces of the dopants and polymer matrix. The charge carriers or dipoles get adequate time for their movement at lower frequencies, as because their movement and their gradual buildup in the interfacial region readily continues at lower frequencies and a large polarization and dielectric constant become the two significant outcomes of this charge accumulation. At higher frequencies the picture is quite different. Due to the presence of a lag between the changes in dipoles and the changes in electrical field, the dielectric constant becomes a complicated function of electrical field frequency. Increasing frequency restricts the movement of the charge carriers or dipoles due to the incongruity of frequency and the dielectric constant values initiates to decrease for all the samples. Again, the reduction of the effective number of dipoles may be the other reason for the diminishing dielectric constant values at higher frequencies.9,13,44 Fig. 10(b) and (e) also provide a vivid representation of the non-linear increase of the tangent losses with the increase of frequency in both systems.
It is obvious from Fig. 10(c) and (f) that the ac conductivity graph linearly accelerates with the increase in frequency as well as with increase in doping concentration for both the MMT and NiMMT doped PVdF-HFP films. Lower frequency conductivity is mainly governed by dc conductivity while the same is dictated by ac conductivity when a higher frequency region comes into the scenario. The increase of dopant percentages notably contributes to increase in the ac conductivity. Hence, the MWS interfacial effect and dipolar relaxation modes become the unique roots for the linear rise of the ac conductivities of the composite films with rise in frequencies. Absence of a lower frequency plateau in the graphical representation can be the outcome of the rapid increase of conductivity at low frequencies which linearly rises with frequency.9,45
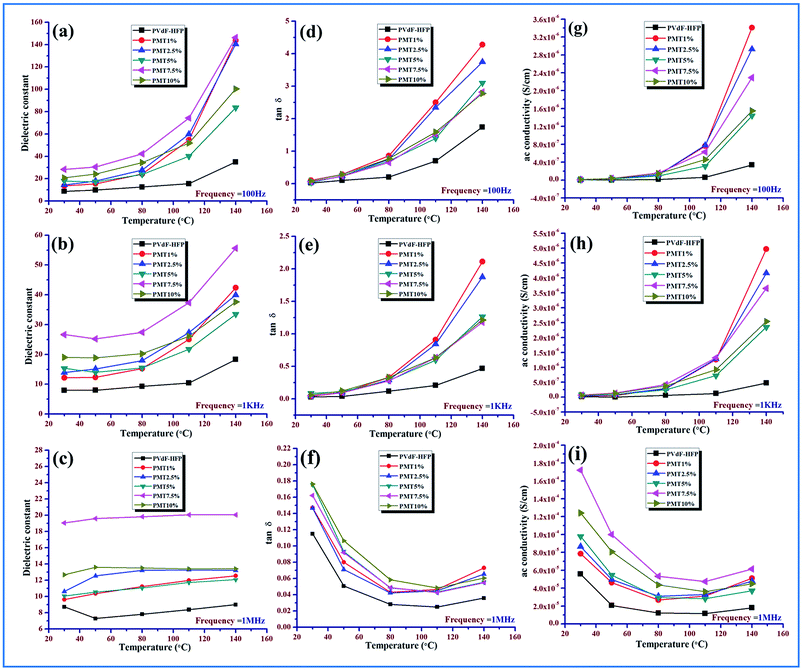
At low temperature (30–80 °C), the dielectric constant of pure PVdF-HFP doesn’t vary much with temperature and shows an almost parallel behavior pattern for all frequencies while it increases with the rise in temperature (above 80 °C), as depicted for the lower frequency range due to total polarization of PVdF-HFP.1
At high frequencies, even with the rise in temperature there is a decrease in dielectric constant value. This behavior is associated with the glass transition temperature (Tg) of the polymer and can be explained by the αa-relaxation process which arises from the thermal response of the molecular motions and Brownian motion of the main polymer chain segment. The dipoles respond to the applied heat energy and the polar group present in the polymer exhibits thermal motion.1,16,46
At low temperature, the dipoles are very intimately attached to each other so limited orientation among themselves takes place and they influence each other. However, with the escalation in temperature, the orientation of the dipoles increases considerably because of the expansion of the bulk material. An increase in temperature reduces the ratio of the molecules per effective length of the dielectric material. So the interaction between the dipoles is reduced and their movement is improved. The dipoles can also get additional energy and time for orientation from the supplied heat. Thus in a two-fold way, the net increase in polarization and simultaneous increase in dielectric constant occurs at a low and medium frequency region over the temperature spectrum.47,48
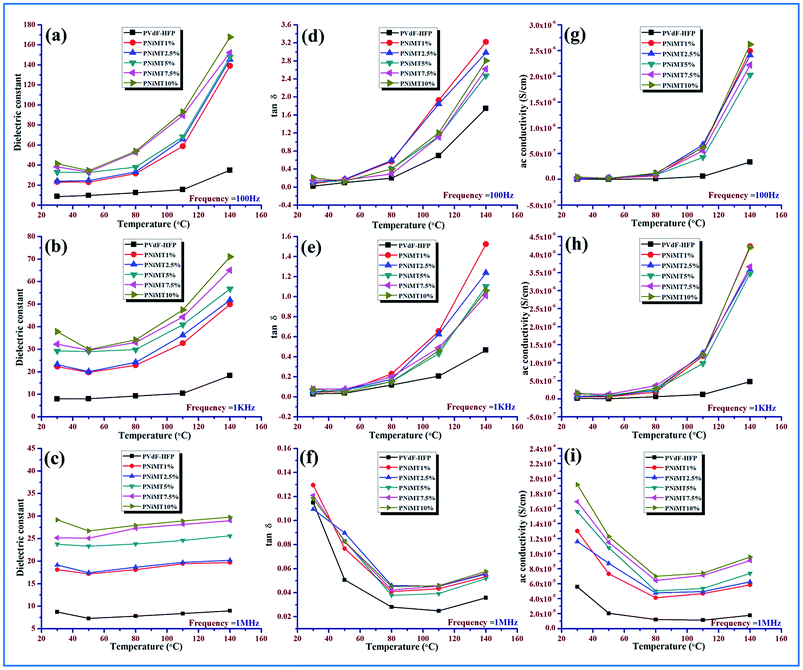
The dielectric constant of the electroactive polymer composites remains independent around 30–40 °C, thereafter, gradually rising with the temperature at lower frequencies with an increase in doping concentrations of the both MMT/NiMMT dopants. The dielectric constant value decreases and almost saturates even at higher temperatures when higher frequencies intervene (Fig. 11 and 12(a)–(c)). Absence of enough dipoles as well as not having sufficient time to catch up with the alteration in frequency of electrical field results in weak polarization and weak dielectric dependence on temperature at higher frequency.1,48
Predominance of the interfacial MWS polarization effect where large charge gathering takes place due to the strong interactions between negatively charged MMT layers with positive –CH2 dipoles for MMT doped polymer films and interaction between negatively charged surfaces of the MMT with the Ni2+ ions and the –OH groups with the F atoms of the polymer chains in Ni(OH)2 NPs modified polymer films, increases the crosslinking density of the polymer chains and is responsible for the overall increase of dielectric values in the low frequency region. Dominant αa relaxation in the low temperature area and the chain scissoring process which accelerates the movement of functional groups also can be attributed to the increase in dielectric constant in the low temperature region.1,42,46,49
The dielectric constant value increases from 41 to 167 for Ni(OH)2 NP modified polymer composites when the temperature rises from 30 °C to 140 °C which outstrips MMT doped polymer films where a dielectric value of 146 was obtained at the highest temperature (140 °C) establishing NiMMT doped polymer films to be a better dielectric material.
Ac conductivity and tangent losses of the pure and composite films increase with temperature at low frequencies but at higher frequencies, the reverse nature is observed in Fig. 11 and 12(d)–(i). The upswing of temperature highly amplifies the segmental flexibility by the faster internal bond rotation of the polymer chain which further expedites the intra- and inter-ionic hopping in the polymer chain and charge transportation is boosted.50 Also, the MWS interfacial polarization phenomenon marks the production of a large number of induced dipoles, increased dielectric values and hence enhancement in αc-relaxation. All these result in the increase of ac conductivity as compared to the pure polymer with temperature.
4. Conclusion
A simplistic solution casting process has been instigated for the synthesis of pure and MMT/NiMMT PVdF-HFP composite polymer films with various dopant percentages (1–10 mass%). UV-vis studies confirm the formation of Ni(OH)2 NPs. Materialization of the polar β-phase from non-polar α-spherulites has been confirmed through the XRD, FTIR and DSC measurements. All trans (TTTT) conformation i.e. electroactive or polar β-polymorphs in the PVdF-HFP is enhanced up to 85.22% and 82.1% when 1 mass% MMT and 7.5 mass% Ni(OH)2 NPs modified MMT have been incorporated in PVdF-HFP matrix respectively.Dielectric studies have been performed at a temperature range of 30 °C to 140 °C for all films. Promising dielectric constant values are reached for the composite films. A dielectric constant of ∼28 and 41 were obtained at 100 Hz for the MMT and NiMMT doped PVdF-HFP films respectively which were enhanced to 146 and 167 respectively at the same frequency when the temperature increased to 140 °C. Though the β-phase nucleation occurs only at 1 mass% of MMT doped films compared to NiMMT doped polymer composites where the same occurs at much greater doping percentage, electrical studies reveal the latter as a much better candidate of dielectric potential. Henceforth, these composites can prove to be alluring in the electronic fields.
Acknowledgements
We are obliged to the University Grants Commission (UGC) Govt. of India for providing fellowship during the execution of this work.References
- D. S. Rana, D. K. Chaturvedi and J. K. Quamara, J. Optoelectron. Adv. Mater., 2010, 4(6), 838–844 CAS
.
- L. Wu, W. Yuan, N. Hu, Z. Wang, C. Chen, J. Qiu, J. Ying and Y. Li, J. Phys. D: Appl. Phys., 2014, 47, 135302 CrossRef
.
- V. Tomer, E. Manias and C. A. Randall, J. Appl. Phys., 2011, 110, 044107 CrossRef
.
- P. Martins, A. C. Lopes and S. Lanceros-Mendez, Prog. Polym. Sci., 2014, 39, 683–706 CrossRef CAS
.
- L. Priya and J. P. Jog, J. Polym. Sci., Part B: Polym. Phys., 2002, 40(15), 1682–1689 CrossRef CAS
.
- L. Priya and J. P. Jog, J. Polym. Sci., Part B: Polym. Phys., 2003, 41(1), 31–38 CrossRef CAS
.
- L. Priya and J. P. Jog, J. Appl. Polym. Sci., 2003, 89(8), 2036–2040 CrossRef CAS
.
- P. Thakur, A. Kool, B. Bagchi, S. Das and P. Nandy, Appl. Clay Sci., 2014, 99, 149–159 CrossRef CAS
.
- D. Shah, P. Maiti, E. Gunn, D. Schmidt, D. D. Jiang and C. A. Batt, Adv. Mater., 2004, 16(14), 1173–1177 CrossRef CAS
.
- G. B. B. Varadwaj and K. M. Parida, RSC Adv., 2013, 3, 13583–13593 RSC
.
- J. Kabilaphat, N. Khaorapapong, K. Saito and M. Ogawa, Appl. Clay Sci., 2015, 115, 248–253 CrossRef CAS
.
- K. Prabakaran, S. Mohanty and S. K. Nayak, Int. J. Plast. Technol., 2014, 18(3), 349–361 CrossRef CAS
.
- Y. Y. Zhang, S. L. Jiang, Y. Yu, G. Xiong, Q. F. Zhang and G. Z. Guang, J. Appl. Polym. Sci., 2012, 123, 2595–2600 CrossRef CAS
.
- W. Yu, Z. Zhao, W. Zheng, B. Long, Q. Jiang, G. Li and X. Ji, Polym. Eng. Sci., 2009, 49, 491–498 CAS
.
- D. R. Dillon, K. K. Tenneti, C. Y. Li, F. K. Ko, I. Sics and B. S. Hsiao, Polymer, 2006, 47, 1678–1688 CrossRef CAS
.
- A. Kelarakis, S. Hayrapetyan, S. Ansari, J. Fang, L. Estevez and E. P. Giannelis, Polymer, 2010, 51, 469–474 CrossRef CAS
.
- A. Atanassov, G. Kostov, D. Kiryakova and L. Borisova-Koleva, J. Thermoplast. Compos. Mater., 2014, 27(1), 126–141 CrossRef CAS
.
- V. Aravindan, P. Vickraman, S. Madhavi, A. Sivashanmugam, R. Thirunakaran and S. Gopukumar, Solid State Sci., 2011, 13(5), 1047–1051 CrossRef CAS
.
- H. S. Jeong, S. C. Hong and S. Y. Lee, J. Membr. Sci., 2010, 364(1–2), 177–182 CrossRef CAS
.
- M. Wang, F. Zhao, Z. Guo and S. Dong, Electrochim. Acta, 2004, 49, 3595–3602 CrossRef CAS
.
- G. Gnana kumar, J. Mater. Chem., 2011, 21, 17382 RSC
.
- H. Du, L. Jiao, K. Cao, Y. Wang and H. Yuan, ACS Appl. Mater. Interfaces, 2013, 5, 6643–6648 CAS
.
- C. Zhang, W. W. Tjiu, W. Fan, Z. Yang, S. Huang and T. Liu, J. Mater. Chem., 2011, 21, 18011 RSC
.
- Y. Qi, H. Qi, J. Li and C. Lu, J. Cryst. Growth, 2008, 310, 4221–4225 CrossRef CAS
.
- K. M. Kim, N. G. Park, K. S. Ryu and S. H. Chang, Electrochim. Acta, 2006, 51, 5636–5644 CrossRef CAS
.
- J. Cao, B. Zhu, Y. Xu, J. Li and C. Chen, J. Macromol. Sci., Part A: Pure Appl. Chem., 2011, 45(6), 449–455 CrossRef
.
- T. U. Patro, M. V. Mhalgi, D. V. Khakhar and A. Misra, Polymer, 2008, 49, 3486–3499 CrossRef CAS
.
- P. Thakur, A. Kool, B. Bagchi, S. Das and P. Nandy, Phys. Chem. Chem. Phys., 2015, 17, 1368 RSC
.
- S. Kakuta, T. Okayama, M. Kato, A. Oda and T. Abe, Catal. Sci. Technol., 2011, 1, 1671–1676 CAS
.
- Q. Feng, C. Honbu, K. Yanagisawa, N. Yamasaki and S. Komarneni, J. Mater. Chem., 2000, 10, 483–488 RSC
.
- S. Miao, Z. Liu, B. Han, J. Zhang, X. Yu, J. Du and Z. Sun, J. Mater. Chem., 2006, 16, 579–584 RSC
.
- C. H. Du, B. K. Zhu and Y. Y. Xu, J. Mater. Sci., 2006, 41, 417–421 CrossRef CAS
.
- L. Wu, W. Yuan, N. Hu, Z. Wang, C. Chen, J. Qiu, J. Ying and Y. Li, J. Phys. D: Appl. Phys., 2014, 47, 135302 CrossRef
.
- L. Wu, G. Huang, N. Hu, S. Fu, J. Qiu, Z. Wang, J. Ying, Z. Chen, W. Lia and S. Tang, RSC Adv., 2014, 4, 35896 RSC
.
- Shalu, V. K. Singh and R. K. Singh, J. Mater. Chem. C, 2015, 3, 7305–7318 RSC
.
- Y. Xu, G. Ray and B. Abdel-Magid, Composites, Part A, 2006, 37, 114–121 CrossRef CAS
.
- B. Bagchi, S. Kar, S. K. Dey, S. Bhandary, D. Roy, T. K. Mukhopadhyay, S. Das and P. Nandy, Colloids Surf., B, 2013, 108, 358–365 CrossRef CAS PubMed
.
- Y. Feng, W. L. Li, Y. F. Hou, Y. Yu, W. P. Cao, T. D. Zhang and W. D. Fei, J. Mater. Chem. C, 2015, 3, 1250 RSC
.
- P. Martins, C. M. Costa, M. Benelmekki, G. Botelho and S. Lanceros-Mendez, CrystEngComm, 2012, 14, 2807–2811 RSC
.
- L. A. Ramajo, M. A. Ramírez, P. R. Bueno, M. M. Reboredo and M. S. Castro, Mater. Res., 2008, 11(1), 85–88 CAS
.
- J. Liu, C. G. Duan, W. G. Yin, W. N. Mei, R. W. Smith and J. R. Hardy, Phys. Rev. B: Condens. Matter Mater. Phys., 2004, 70, 144106 CrossRef
.
- A. C. Lopes, C. M. Costa, R. S. Serra, I. C. Neves, J. L. G. Ribelles and S. Lanceros-Méndez, Solid State Ionics, 2013, 235, 42–50 CrossRef CAS
.
- S. A. M. Nabirqudri, J. Mater. Res., 2014, 29(24), 2957–2964 CrossRef CAS
.
- N. Chilaka and S. Ghosh, Electrochim. Acta, 2014, 134, 232–241 CrossRef CAS
.
- P. Thakur, A. Kool, B. Bagchi, N. A. Hoque, S. Das and P. Nandy, RSC Adv., 2015, 5, 62819 RSC
.
- S. El-Sayed, T. A. Abdel-Baset and A. Hassen, AIP Adv., 2014, 4, 037114 CrossRef
.
- V. S. Yadav, D. K. Sahu, Y. Singh and D. C. Dhubkarya, Proceedings of IMECS, 2010, III, ISBN 978–988-18210-5-8 Search PubMed
.
- Z. M. Dang, J. P. Wu, H. P. Xu, S. H. Yao and M. J. Jiang, Appl. Phys. Lett., 2007, 91, 072912 CrossRef
.
- A. Hassen, T. Hanafy, S. El-Sayed and A. Himanshu, J. Appl. Phys., 2011, 110, 114119 CrossRef
.
- C. W. Liew, Y. S. Ong, J. Y. Lim, C. S. Lim, K. H. Teoh and S. Ramesh, Int. J. Electrochem. Sci., 2013, 8, 7779–7794 CAS
.
Footnotes |
| † Present address: Fuel Cell and Battery Division, Central Glass and Ceramic Research Institute, Kolkata-700032, India. |
| ‡ Present address: Department of Physics, IIEST, Howrah, West Bengal-711103, India. |
| This journal is © The Royal Society of Chemistry 2016 |

