Preparation of highly porous carbon from sustainable α-cellulose for superior removal performance of tetracycline and sulfamethazine from water†
Jinsong Hea,
Jiangdong Daia,
Tao Zhanga,
Jun Suna,
Atian Xiea,
Sujun Tiana,
Yongsheng Yan*ab and
Pengwei Huo*a
aSchool of Chemistry and Chemical Engineering, Jiangsu University, Zhenjiang 212013, China. E-mail: yys@mail.ujs.edu.cn; huopw@mail.ujs.edu.cn; Fax: +86-0511-88791800; Tel: +86-0511-88790683
bKey Laboratory of Preparation and Applications of Environmental Friendly Materials (Ministry of Education), Jilin Normal University, Siping 136000, China
First published on 3rd March 2016
Abstract
Hierarchical carbon materials with ultrahigh specific surface area and high porosity were synthesized by KOH activation from sustainable α-cellulose and employed as adsorbents to study adsorption performance of tetracycline (TC) and sulfamethazine (SMZ) from aqueous solutions. The physical and chemical properties of the as-prepared materials were characterized by SEM, TEM, FT-IR, XPS, Raman and a surface area analyzer. The obtained porous carbon exhibited a hierarchical pore structure, large BET specific surface area (3187.91 m2 g−1) and pore volume (1.781 cm3 g−1) when the activation temperature reached 850 °C. The maximum adsorption capacities were 1072.86 and 786.18 mg g−1 for TC and SMZ removal at 298 K, respectively. Moreover, TC and SMZ showed similar adsorption features, kinetic results could fit well using a pseudo-second-order model, intraparticle diffusion was not the rate-controlling step and adsorption isotherm results fit well with the Langmuir model. The adsorption capacities increased with contact time and adsorption temperature and, moreover, pH and external ionic species have a significant effect on adsorption efficiency. Thermodynamic studies implied that physisorption might dominate adsorption and the adsorption process is spontaneous and thermodynamically favorable. The results are of importance to indicate that the as-prepared porous carbon could be used as a low-cost and effective adsorbent in pharmaceutical wastewater treatment.
1. Introduction
Various pharmaceutical antibiotics are used widely for the improvement of human and animal health.1 However, long-term, widespread or improper use has resulted in antibiotic residuals in the environment; it is well established that large antibiotic residues are detected in water.2 These compounds are potentially adverse to water quality and aquatic organisms.3 Meanwhile, antibiotic residuals in the environment have access to the human body via the food chain and drinking water, resulting in antibiotic resistance and interference with the functioning of natural hormones. This risk exists greatly even though these compounds occur at sub-mg L−1 concentrations, much worse, it is difficult to ascertain which chemical groups should or should not be classified as pernicious factors.4 Hence, the excrescent antibiotic residues must be efficiently removed from discharged wastewater to solve the ecological and biological safety problems.In the process of antibiotic removal from water, many technical methods, such as photodegradation, technical oxidation, biodegradation, and adsorption5 have been developed. Among these methods, adsorption has been proven to be an effective technique for its easy operation, high efficiency and inexpensive nature.6 It is well documented that adsorption is a process whereby a contaminant adheres to the surface of an adsorbent, due to hydrophobic interactions, electrostatic interactions, π–π electron-donor–acceptor (π–π EDA) interactions and hydrogen bonds between the adsorbate and the adsorbent.7 More recently, researchers proposed that micropore filling is a major mechanism for organic contaminant adsorption onto carbon composite materials, thereinto, micropores promote reservation while mesopores facilitate transmission.8 Therefore, abundant porosity of adsorption materials and a strong interaction mechanism could contribute to high efficient organic matter adsorption. However, most of adsorbent materials such as minerals,9 clay,10 sludge,11 and imprinted nanospheres12 are not required for high efficiency; this is mainly due to the poor porous structure.13
Recently, activated carbon (AC) has been reported as an effective adsorbent to eliminate micropollutants because of its excellent porosity, huge specific surface area, low cost and environmental friendliness. Above all, the morphology and functional groups of AC can be controlled efficiently. Physical (CO2, steam, etc.) and/or chemical activation (KOH, H3PO4, ZnCl2, etc.) are often required to prepare AC. Commercial activated carbon (CAC) is prepared mainly via physical activation and,14 in general, they are endowed with the disadvantages of low specific surface area and infertile chemical groups and cannot meet the demand of fast and efficient adsorption in certain cases. In contrast, chemical activation gives rise to ACs with high specific surface area (over 2000 m2 g−1) and large pore volume. Meanwhile, it has superior advantages such as high yield, time saving and energy conservation. Among these activating agents, KOH is efficient for generating micropores into the framework of AC. Diverse KOH-activated porous materials have been successfully applied in energy storage15 and in the environmental field.16
On the other hand, the importance of the precursor cannot be neglected and there should be adequate attention paid to the discovery of an appropriate carbon source. Cellulose, the most important skeletal component in plants, is the most abundant natural polymer and has been considered an almost inexhaustible source of raw material for the increasing demand for environmentally friendly and biocompatible products.17 Cellulose has fascinating properties, such as low cost, biodegradability, non-toxicity and high stability. Moreover, cellulose molecules have a broad chemical modifying capacity due to the high density of hydroxyl groups, and can be modified with specific functional groups to remove specific pollutants.18 A variety of cellulose-rich biomass materials have been used for preparing AC, such as macadamia nut shells,19 rice husk,20bamboo,21 and tea waste biochars,22 however, rare attention has been focused on pure cellulose. To the best of our knowledge, there have been no reports of the use of KOH activation to promote the conversion of pure cellulose into AC and its application for antibiotic removal.
In this study, we synthesized a hierarchical porous bioadsorbent from α-cellulose via KOH activation for high efficiency elimination of two heavily used antibiotics, TC and SMZ, from aqueous solution. According to a report from Zhang et al.23 on the dosage of antibiotics in China, the usage of these two kinds of antibiotics were 1450 tons and 677 tons in 2013, respectively. A batch of tests were explored to investigate the adsorption properties. The main objective of this work is to explore the enormous potential of cellulose as a carbonaceous adsorbent precursor and to discover the optimum activation options for production of porous carbon for high-performance removal of antibiotics. Furthermore, the recyclability was investigated.
2. Materials and methods
2.1. Materials and chemicals
α-Cellulose (50 μm), TC and SMZ and CAC (10–32 mesh) were obtained from Aladdin Industrial Inc. (Shanghai, China) and without further purification, partial physicochemical properties of TC and SMZ are summarized in ESI, Table S1 and Fig. S1†. Hydrochloric acid (HCl, AR), sodium chloride (NaCl, AR), potassium hydroxide (KOH, AR) and sodium hydroxide (NaOH, AR) were purchased from Shanghai Chemical Reagent Co., Ltd. (Shanghai, China) and used as received.2.2. Production of porous carbon
The porous carbon materials were prepared as follows: an alumina boat with around 5 g of α-cellulose was heated in a horizontal quartz tube furnace by electric heating (Tianjin Zhonghuan Lab Furnace Co., Ltd.). The furnace was heated to 500 °C with a heating rate of 5 °C min−1 and maintained for 1 h in N2 flow (using a flow rate of 200 mL min−1), followed by cooling down to ambient temperature. To simplify, carbonized α-cellulose was denoted as Cα.In order to improve the porosity of Cα, activation with KOH at high temperature was performed. Cα was mixed with KOH (marked as CαKOH) at the ratio of 1![[thin space (1/6-em)]](https://www.rsc.org/images/entities/char_2009.gif) :
:![[thin space (1/6-em)]](https://www.rsc.org/images/entities/char_2009.gif) 1–4 (Cα
1–4 (Cα![[thin space (1/6-em)]](https://www.rsc.org/images/entities/char_2009.gif) :
:![[thin space (1/6-em)]](https://www.rsc.org/images/entities/char_2009.gif) KOH, wt
KOH, wt![[thin space (1/6-em)]](https://www.rsc.org/images/entities/char_2009.gif) :
:![[thin space (1/6-em)]](https://www.rsc.org/images/entities/char_2009.gif) wt%) uniformly ground in an agate mortar. CαKOH was placed into a nickel crucible and heated at a rate of 5 °C min−1 from room temperature to 750–850 °C and maintained for 1 h under N2 flow (400 mL min−1), respectively. After the activation processes and cooling down to room temperature, the produced materials were washed sequentially with HCl (aq, 0.5 M) and hot distilled water until the pH of the washing solution reached ∼7.0, and then dried at 80 °C for 24 h. For the convenience of further analysis, the analogous carbon materials are denoted as Cα-β-γ, where β represents the activation temperature and γ means the activation ratio of KOH/Cα.
wt%) uniformly ground in an agate mortar. CαKOH was placed into a nickel crucible and heated at a rate of 5 °C min−1 from room temperature to 750–850 °C and maintained for 1 h under N2 flow (400 mL min−1), respectively. After the activation processes and cooling down to room temperature, the produced materials were washed sequentially with HCl (aq, 0.5 M) and hot distilled water until the pH of the washing solution reached ∼7.0, and then dried at 80 °C for 24 h. For the convenience of further analysis, the analogous carbon materials are denoted as Cα-β-γ, where β represents the activation temperature and γ means the activation ratio of KOH/Cα.
2.3. Characterization
Elemental analysis (C, H, and N) was performed on a dry basis using a FLASH1112A Elemental Analyzer. Scanning electron microscopy (SEM: JSM-7001F) was employed to investigate the surface and cross-sectional morphologies. Transmission electron microscopy (TEM: JEM-2010) was used to observe the structure and morphology. The specific surface area and pore structure parameters were determined by using a surface area analyzer (Quantachrome Autosorb-iQC) by physical adsorption measurements with N2 at 77 K. Fourier transform infrared (FT-IR) spectra were recorded on a Nicolet Nexus 470 FT-IR (America thermo-electricity company). X-ray diffraction (XRD) measurements were performed on a Rigaku smartlab diffractometer at 45 kV and 200 mA for Cu Kα radiation (λ = 1.5406 Å). The surface chemical species were examined by an X-ray photoelectron spectroscope (XPS: Thermo Scientific ESCALAB 250Xi).2.4. Adsorption measurements
To investigate the adsorption process, a set of 10 mL headspace polytetrafluoroethylene test tubes containing 2 mg of porous carbon and 10 mL of tested antibiotic solution was required. In the adsorption kinetic test, an initial concentration was set at 150 and 200 mg L−1 for a background solution of pH 6.0 for the tested antibiotic pre-adjusted with NaOH or HCl by considering the acid/base buffering ability of the sorbent. Then, they were placed in a thermostat water bath at 298 K, held for predetermined time intervals, the residual solution was leached by a filter equipped with a moisture film and concentrations of the aqueous solutions were measured via a UV-vis spectrophotometer (Genesys 10 UV-vis, Thermo Electron Corporation, USA) at a wavelength of 357 nm for TC and 262 nm for SMZ, respectively.The adsorption equilibrium experiments were carried out with various initial concentrations varying from 100 to 300 mg L−1 of solution at pH 6.0. Initially, they were kept at a constant temperature in a water bath for 24 h to reach apparent sorption equilibrium based on the results of adsorption kinetics, while experimental temperatures were controlled at 298, 308 or 318 K, respectively. Measurement of the equilibrium concentration for the calculation of adsorption capacity was the same as above. In the pH and ionic concentration effect experiments, 200 mg L−1 of testing solution at various pH values (3–8) and diverse concentrations of NaCl (0.1–0.8 mol L−1) at 298 K were used, respectively. The pH of the solutions was adjusted by adding low consistency HCl or NaOH solution. The following procedures were similar to the equilibrium experiment.
To investigate the recycling property, 0.1 g of adsorbent was added in 500 mL of 200 mg L−1 TC and SMZ solutions for 12 h respectively. Then, they were taken out from the solutions, the adsorbents were placed into 50 mL of a 1 M NaOH solution under agitation at 303 K for 3 h for the purpose of desorption and then washed and dried orderly. The following adsorption experiment was the same as the equilibrium experiment at 298 K.
2.5. Experimental analysis
The amount of adsorption at time t (Qt, mg g−1) was calculated by eqn (1).
 | (1) |
Adsorption kinetics were conducted using the pseudo-first-order model,24 pseudo-second-order model,25 and the intraparticle diffusion model.26
 | (2) |
 | (3) |
| Intraparticle diffusion Qt = kidt1/2 + C | (4) |
Langmuir,27 Freundlich28 and Temkin29 isotherm models were used to investigate the adsorption equilibrium studies.
 | (5) |
 | (6) |
 | (7) |
The parameters of the determination coefficient (R2) and normalized standard deviation (Δqe) eqn (8) were evaluated to define which model best describes the experimental data.
 | (8) |
The value of Gibb’s free energy (ΔG°) can be calculated by eqn (9).
ΔG° = −RT![[thin space (1/6-em)]](https://www.rsc.org/images/entities/char_2009.gif) ln ln![[thin space (1/6-em)]](https://www.rsc.org/images/entities/char_2009.gif) Ko Ko
| (9) |
Ko is the thermodynamic equilibrium constant and represents the ability of the adsorbent to retain the adsorbate and the extent of movement of the adsorbate within the solution. Values of Ko are obtained by plotting a straight line of ln(Qe/Ce) versus Qe based on a least-squares analysis and extrapolation of Qe to 0.
The enthalpy change (ΔH°) and entropy change (ΔS°) of adsorption were estimated from eqn (10).
 | (10) |
![[thin space (1/6-em)]](https://www.rsc.org/images/entities/char_2009.gif) Ko versus 1/T, respectively.
Ko versus 1/T, respectively.
3. Results and discussion
3.1. Characterization
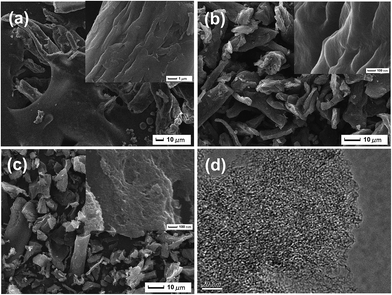
Surface elemental compositions (N, C, H, O), specific surface areas, pore volume and average pore diameter parameters of the α-cellulose-derived porous carbon are presented in Table S2.† In this study, the yield of Cα was 27.22% from carbonization of α-cellulose, then, 51.61% and 34.41% were the achieved yields of Cα-850-0 and Cα-850-4, respectively. After doping with KOH, a decline of the yield and an increase of the carbon content were observed, as KOH removes volatile materials during activation. Fig. 1 illustrates SEM images of α-cellulose, Cα and Cα-850-4. The surface of the raw precursor is gully-like and compact without a porous structure (Fig. 1a). After carbonization, the single bulk dimension decreased, it appears wrinkled and besprinkled on a smooth surface and there are little pores (Fig. 1b). Furthermore, Cα-850-4 exhibits the formation of a highly developed porous structure with micro-sized pores observed on the surface; these pores are irregular and heterogeneous (Fig. 1c). The TEM image also shows the successful formation of amorphous, worm-like micropores (Fig. 1d). It is indicated that the porosity was developed by KOH activation associated with gasification. In the process, formation of potassium carbonate, metallic potassium and hydrogen gas are firstly derived from the reaction between carbon and potassium hydroxide. Concurrently, the reduction of potassium carbonate under inert condition formed potassium, potassium oxide, carbon monoxide and carbon dioxide, respectively.16,19 The microporosity can be achieved as a result of the release of mixed gas and potassium vapor.Fig. 2 displays the isotherms of N2 adsorption–desorption and pore size distribution. The isotherm of Cα-850-4 presents a high adsorption at low relative pressure, where the adsorption branch resembles that of a type I isotherm (according to the IUPAC classification), characteristic of highly microporous materials,30 further confirming the hierarchically porous structure. BET (Brunauer–Emmett–Teller) specific surface area (SBET), total pore volume and the average Density Functional Theory (DFT) pore size of Cα-850-4 correspond to 3187.91 m2 g−1, 1.781 cm3 g−1 and 1.628 nm, respectively. These findings clearly indicate that the micropores are dominant in Cα-850-4. Fig. 2b shows the Density Functional Theory (DFT) pore size distribution of Cα-850-4, which further identifies the hierarchically porous structure. However, the isotherms of Cα and Cα-850-0 (inset of Fig. 2a) indicate the irregular structure with an inferior pore structure, which further confirms the importance of activation with KOH in raising porosity.
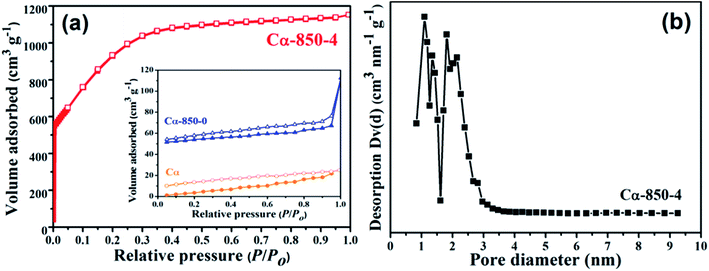 | ||
| Fig. 2 N2 adsorption–desorption isotherms of the samples prepared under different conditions (a) and the pore size distribution of Cα-850-4 (b). | ||
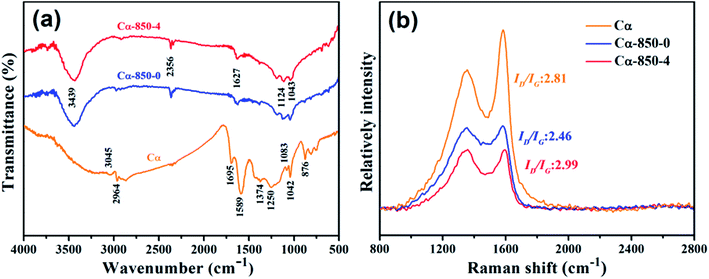
The Fourier transform infrared (FT-IR) spectra of Cα, Cα-850-0 and Cα-850-4 are presented in Fig. 3a, which shows the disappearance of many bands in the Cα-850-0 and Cα-850-4 spectrum as a result of carbonization and/or the activation process. It is suggestive of the decomposition of partial surface functional groups and release of volatile matter at high temperature. The peak at 3439 cm−1 can be attributed to the hydrogen bonded O–H stretching vibration,31 the bands at 3045 and 2964 cm−1 are assigned to the aromatic and aliphatic C–H groups, the band at 2356 cm−1 may be attributed to the C![[triple bond, length as m-dash]](https://www.rsc.org/images/entities/char_e002.gif) C stretching, the peak at 1695 cm−1 may be ascribed to the existence of esters in the structure, the band at 1250 cm−1 indicates C
C stretching, the peak at 1695 cm−1 may be ascribed to the existence of esters in the structure, the band at 1250 cm−1 indicates C![[double bond, length as m-dash]](https://www.rsc.org/images/entities/char_e001.gif) O vibration, and the peaks at 1627–1589 cm−1 and 1042 cm−1 are related to C
O vibration, and the peaks at 1627–1589 cm−1 and 1042 cm−1 are related to C![[double bond, length as m-dash]](https://www.rsc.org/images/entities/char_e001.gif) C and C–O stretching in carboxyl acids, alcohols, phenols and esters,32 respectively. The bands at 1124 cm−1 and 876 cm−1 indicate C–O–H vibration.
C and C–O stretching in carboxyl acids, alcohols, phenols and esters,32 respectively. The bands at 1124 cm−1 and 876 cm−1 indicate C–O–H vibration.
In the Raman spectra (Fig. 3b), two prominent peaks at 1354 and 1580 cm−1 correspond to the D band and the G band, respectively. The D band originates from the stretching vibration of sp3 carbon atoms, which induces defects and disorders, whereas the G band originates from the stretching vibration of sp2 carbon atoms, corresponding to the first-order scattering of the E2g mode.8,33 The intensity ratio of the D band to the G band (ID/IG) estimate the relative degree of graphitization of the as-prepared composites. Cα possessed the lowest ID/IG ratio, revealing that increasing temperature increased the degree of graphitization substantially. A high KOH ratio activation treatment generally enhanced structural disorder indicated by microporosity as confirmed from the highest ID/IG ratio of Cα-850-4.
To further understand the nature of most external surface functionalities of Cα and Cα-850-4, the O 1s and C 1s photoelectrons of XPS were analyzed (Fig. S2†). The high resolution C 1(s) photoelectron spectrum for the raw hydrochar sample included four common signals, which can be attributed to the aliphatic/aromatic carbon groups (C1, C–H, and C–C, 284.7 eV), hydroxyl group (C2, C–OH, 286.1 eV), carbonyl group (C3, C![[double bond, length as m-dash]](https://www.rsc.org/images/entities/char_e001.gif) O, 287.0 eV), and carboxylic/ester/lactone group (C4, O
O, 287.0 eV), and carboxylic/ester/lactone group (C4, O![[double bond, length as m-dash]](https://www.rsc.org/images/entities/char_e001.gif) C–O, 288.7 eV). The O 1s spectra can be deconvoluted into two groups: ketone, lactone, carbonyl, and quinone groups (O1, C
C–O, 288.7 eV). The O 1s spectra can be deconvoluted into two groups: ketone, lactone, carbonyl, and quinone groups (O1, C![[double bond, length as m-dash]](https://www.rsc.org/images/entities/char_e001.gif) O, 531.1 eV) and ether and/or alcohol/phenolic hydroxyl (O2, R–OH and/or C–O–C, 532.9 eV).34 The composition groups on the surface of the biochars show that the concentration of carbonyl groups decreased after activation whereas the hydroxyl groups increased.
O, 531.1 eV) and ether and/or alcohol/phenolic hydroxyl (O2, R–OH and/or C–O–C, 532.9 eV).34 The composition groups on the surface of the biochars show that the concentration of carbonyl groups decreased after activation whereas the hydroxyl groups increased.
3.2. Effect of activation conditions on adsorption
The activation temperature and KOH ratios are very important parameters which affect the physical characteristics of the prepared carbon. Generally, good porosity can be achieved by increasing the temperature and KOH mass moderately. The amount of TC and SMZ sorbed on Cα-β-γ increased with the rise in activation temperature due to the formation of new pores with the continuation of evaporating agents resulting from the decomposition of the primary compounds of Cα with an increase of the temperature. More KOH input leads to selectively extracted H and O in the form of gas away from Cα. Furthermore, good porosity promises to enhance adsorption capacity.35 Adsorption experiments were conducted with materials from different activation temperatures (Fig. 4). For both TC and SMZ antibiotics, the adsorption amount significantly increased with rise in the impregnation ratio, and 800 °C for SMZ and 850 °C for TC can be accepted as the optimal activation temperature. Conveniently, Cα-850-4 was chosen as the optimum activation product for the subsequent experiments.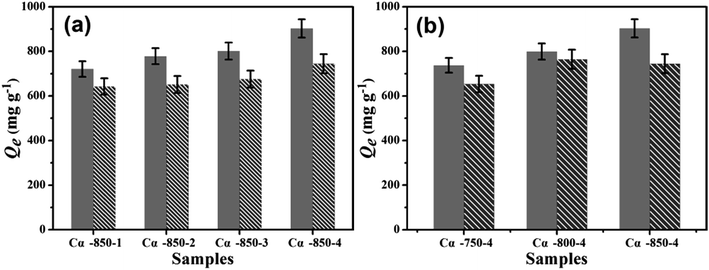 | ||
| Fig. 4 The effect of activation conditions on the adsorption ability of Cα-β-γ (C0 = 200 mg L−1, pH = 6.0, t = 24 h, T = 298 K). | ||
3.3. Effect of ionic strength on adsorption
Co-existing ionic species affect the aqueous activity of antibiotic species and further has an effect on the equilibrium adsorption capacity. Fig. 5a displays the effects of ionic strength (NaCl) on TC and SMZ adsorption on the adsorbents at pH 6. TC adsorption amount increased with increasing ionic concentration, which could have resulted from the salting out effect, where the solubility of TC in water is decreased with an increase of NaCl. The decrease in solubility of TC in water facilitates the diffusion of more TC to the surface of the adsorbents, resulting in increased adsorption. Previous studies have also reported similar results that increasing ionic strength facilitates adsorption due to the electrostatic screening of the surface charge.36 However, negligible effects of ionic strength on adsorption of SMZ were indeed observed. This may be contributed to SMZ possessing fewer surface functionalities and adsorption was dominated by the protonated neutral form; the Cα-850-4 contact surface is predominant in adsorption.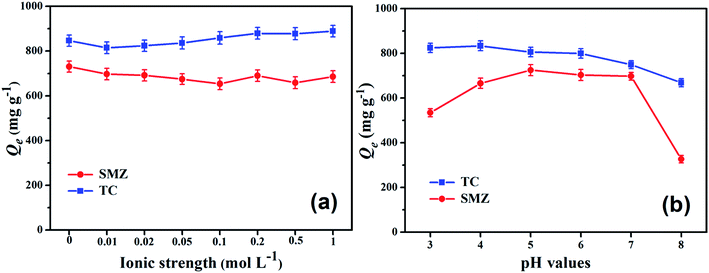 | ||
| Fig. 5 Effects of ionic strength (a) and solution pH (b) on TC and SMZ removal efficiency by Cα-850-4 (C0 = 200 mg L−1, t = 24 h, T = 298 K). | ||
3.4. Effect of pH on adsorption
The solution pH value has an influence on the effective interaction between adsorbate and adsorbent and may promote or suppress adsorption by altering properties of both the adsorbate and adsorbent. As shown in Fig. 5b, the adsorption of TC and SMZ on Cα-850-4 exhibited a pronounced pH-dependence. The adsorption capacity of TC decreased with increasing pH values. TC existed in three forms depending on the different pH. At pH between 3.3 (i.e., pKa1) and 7.7 (i.e., pKa2), TC exists as a zwitterion, namely almost all of the TC molecules carry no net electrical charge, which makes them hardly possess electrostatic attraction or repulsion, so the increase of pH from 4.0 to 6.0 has no significant effect on the adsorptive affinity of TC in the experiment. As the concentration of TCH− and TC2− increased at higher pH, a progressive decrease in adsorption was observed. This could be attributed to a decrease in electrostatic attraction between the negatively charged TC and the adsorbent. These results indicated that, depending on the solution pH, hydrophobic interaction also plays an important role in these adsorption processes.A different, complex correlation depending on the solution pH was presented by SMZ. The adsorption capacity increased initially and then decreased. SMZ has two pKa values (2.3 and 7.5) and could exist as a cationic, neutral and anionic species under different pH conditions. When the pH value ranged from 3 to 7, the neutral form was dominant,37 the Cα-850-4 surface hydrophobic sites interacted with SMZ molecules by the hydrophobic effect.
3.5. Adsorption kinetics
Kinetic studies are important to understand the adsorption dynamics and mechanism in terms of order of the rate constant. The adsorption process is initially rapid and then becomes slow and stagnates, perhaps because the available vacant surface sites for adsorption decreased due to repulsive forces between Cα-850-4 and antibiotic molecules with the prolongation of adsorption. However, both TC and SMZ exhibited a rapid process and obtained equilibria in 120 min (Fig. 6a and b).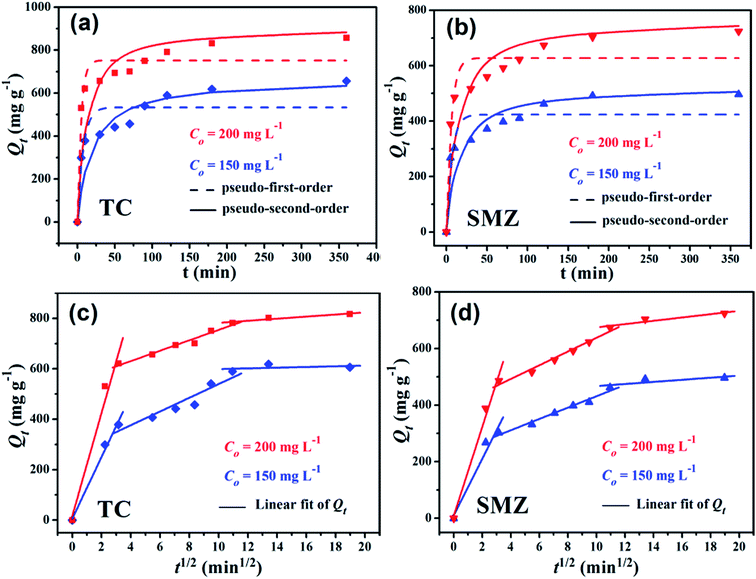 | ||
| Fig. 6 Adsorption kinetics of TC (a) and SMZ (b) on Cα-850-4 (pH = 6.0, T = 298 K) and the intraparticle diffusion model of TC (c) and SMZ (d), respectively. | ||
The analysis results of pseudo-first order and pseudo-second order kinetics data are summarized in Table 1. The pseudo-first order model shows low regression coefficients for both TC and SMZ. Moreover, the normalized standard deviation (Δqe, %) derived from the experimental and calculated adsorption capacity indicates a poor fitting result for the pseudo-first model. Meanwhile, the linear plot of t/Qt versus t for the pseudo-second order equation regression coefficients is higher than 0.99 for all compounds and Cα-850-4. The better representation of adsorption kinetics was by the pseudo-second order kinetic model and Qe,cal values agree well with Qe,exp values for both TC and SMZ. The pseudo-second-order kinetic model is based on the experimental information of solid-phase sorption. Both values for the rate constant k2 for TC and SMZ decreased with the increasing initial concentration, which may be attributed to the high competition for the available sorption sites at high concentration. However, the parameter k2 may not directly relate to the rate of adsorption because it is dependent on the solid-phase concentration.38 This result indicated that sorption might be related with chemical sorption. Sorption forces might be involved in the valence forces of the shared or electrostatic interactions between adsorbate and adsorbent. The chemisorption reaction or an activated site sorption would be more predominant in the rate controlling step for TC and SMZ systems.39
| Adsorbates | C0 (mg L−1) | Pseudo-first-order | Pseudo-second-order | |||||||
|---|---|---|---|---|---|---|---|---|---|---|
| k1 (10−2 min−1) | Q1,cal (mg g−1) | Δqe (%) | R2 | k2 (10−3 g mg−1 min−1) | Q2,cal (mg g−1) | h (mg g−1 min−1) | Δqe (%) | R2 | ||
| TC | 150 | 1.01 | 533.59 | 6.61 | 0.8713 | 0.01 | 666.67 | 35.59 | 0.56 | 0.9937 |
| 200 | 0.74 | 752.32 | 3.83 | 0.7861 | 0.10 | 909.09 | 86.21 | 0.17 | 0.9968 | |
| SMZ | 150 | 0.48 | 423.59 | 3.91 | 0.8141 | 0.13 | 526.32 | 80.64 | 0.91 | 0.9982 |
| 200 | 0.41 | 627.77 | 3.81 | 0.8374 | 1.06 | 769.23 | 108.70 | 0.58 | 0.9981 | |
Generally, the adsorption process onto AC can be divided into three stages. The first stage is external diffusion, in which the adsorbates move from the bulk solution to the external surface of the adsorbent. The second stage is intraparticle diffusion, and the adsorbates diffuse further to the adsorption sites within the adsorbent. The last stage is adsorbing. In this stage, the adsorbates are adsorbed at the active sites on the adsorbent, which is a fast step and usually can be negligible.39 Because the transportation of adsorbate from the solution phase to the surface of the adsorbent particles may be controlled either by one or more steps,38 neither the pseudo-first-order nor the second-order model can identify the diffusion mechanism, thus the kinetic results were analyzed by the intraparticle diffusion model to elucidate the diffusion mechanism.
According to Fig. 6c and d, the plots of Qt to t1/2 exhibited a piecewise-linear pattern with three slopes for both TC and SMZ antibiotics similarly. The first stage is attributed to the rapid diffusion of antibiotics on the external surface of the adsorbent. It was essential for Qt versus t1/2 plots to go through the origin if the intraparticle diffusion was the sole rate-limiting step. Both the second and third stages did not pass through the origin, indicating that intraparticle diffusion was related to adsorption but not as an exclusive rate-controlling step.
3.6. Adsorption isotherms
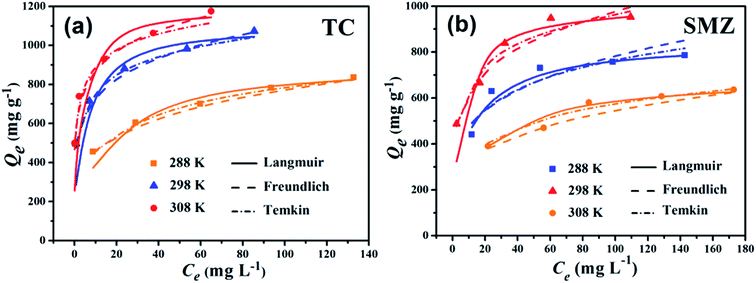
The mechanism of adsorption reactions could be determined by evaluating the adsorption equilibrium data given a comprehensive understanding of the nature of the interaction between absorbates and absorbents. The Langmuir model is an ideal model, which possesses a perfect adsorbent surface and monolayer molecule adsorption. As an empirical model, the Freundlich model is used widely in the field of chemistry. The Temkin model is a proper model for chemical adsorption based on a strong electrostatic interaction between positive and negative charges.11 Three adsorption isotherm non-linear fitting results are presented in Fig. 7 and the fitting parameters are listed in Table 2. The adsorption capacities obviously increased with the rise of temperature, indicating that adsorption is an endothermic reaction. The fitting performance as identified by R2 shows that the Langmuir model for both of TC and SMZ fit the data precisely, while the other two models fit reasonably, showing the correlations of the isotherm are in the order: Langmuir > Temkin > Freundlich.| Models | Constants | Tetracycline | Sulfamethazine | ||||
|---|---|---|---|---|---|---|---|
| 288 K | 298 K | 308 K | 288 K | 298 K | 308 K | ||
| Langmuir | Qm (mg g−1) | 900.91 | 1086.96 | 1176.47 | 687.29 | 834.72 | 1001.01 |
| KL (L mg−1) | 0.08 | 0.29 | 0.53 | 0.06 | 0.11 | 0.19 | |
| RL | 0.20 | 0.07 | 0.04 | 0.24 | 0.15 | 0.09 | |
| R2 | 0.9954 | 0.9957 | 0.9952 | 0.9976 | 0.9994 | 0.9970 | |
| Freundlich | KF ((mg g−1)(1 mg−1)1/n) | 281.15 | 524.42 | 672.16 | 181.33 | 285.83 | 408.38 |
| 1/n | 0.22 | 0.16 | 0.13 | 0.24 | 0.21 | 0.19 | |
| R2 | 0.9190 | 0.8994 | 0.9283 | 0.9190 | 0.8635 | 0.9350 | |
| Temkin | bT | 17.11 | 20.98 | 25.68 | 21.11 | 18.87 | 19.27 |
| KT (L g−1) | 2.76 | 79.44 | 162.64 | 1.63 | 3.52 | 14.38 | |
| R2 | 0.9748 | 0.9895 | 0.9571 | 0.9618 | 0.9059 | 0.9516 | |
The essential feature of the Langmuir isotherms RL indicates the possibility of the adsorption process being irreversible (RL = 0), favorable (0 < RL < 1), linear (RL = 1), or unfavorable (RL > 1).31 RL is estimated from eqn (11):
 | (11) |
Values of RL fall between 0 and 1, indicating that adsorption of both antibiotics on Cα-850-4 was favorable. The maximum adsorption capacity of TC and SMZ based on Langmuir was 1086.96 and 834.72 mg g−1 respectively, which was in accordance with the obtained experimental values. This result may be due to the homogeneous distribution of active sites on the surfaces of Cα-850-4. In order to compare, equilibrium experiments were also carried out using CAC under the same conditions. When compared with CAC and other reported adsorbents (Table 3), this result indicated that Cα-850-4 has great potential as an adsorbent for antibiotic removal.
| Adsorbent | Qm (mg g−1) | Adsorption condition | Reference | |
|---|---|---|---|---|
| TC | Cα-850-4 | 1086.96 | pH = 6.0, T = 298 K | This work |
| CAC | 214.63 | pH = 6.0, T = 298 K | This work | |
| Carbon nanotubes | 269.54 | T = 293 K | 43 | |
| Graphene oxide | 370 | pH = 3.6, T = 298 K | 44 | |
| Montmorillonite | 341.44 | pH = 5.5, T = 298 K, 0.01 M NaCl | 45 | |
| Magnetic porous carbon | 29 | T = 303 K | 46 | |
| SMZ | Cα-850-4 | 834.72 | pH = 6.0, T = 298 K | This work |
| CAC | 69.47 | pH = 6.0, T = 298 K | This work | |
| Carbon nanotubes | 38.13 | pH = 5.0, T = 298 K | 47 | |
| Tea waste biochars | 33.81 | pH = 5.0, T = 298 K | 22 | |
| Acid-coated goethite | 0.17 | pH = 3.5, T = 298 K, 0.01 M KNO3 | 48 |
3.7. Thermodynamic studies
To further study the adsorption mechanism, the sorption behaviors of different concentrations of TC and SMZ onto Cα-850-4 were critically investigated at 288, 298, and 308 K, respectively. These thermodynamic parameters provide in-depth information on inherent energetic changes. TC and SMZ showed similar thermodynamic properties. The spontaneous and thermodynamically favorable nature of the process was well explained by the negative values of ΔG° for all of the tested temperatures (Table 4). The positive value of ΔH° indicated that both TC and SMZ adsorption onto Cα-850-4 were endothermic. The positive ΔS° indicated the increase of randomness at the solid/liquid interface during the adsorption process.40 This endothermic characteristic revealed that TC and SMZ adsorption onto the as-prepared material was more favorable at a higher temperature, as confirmed as the higher adsorption capacity at 308 K (Table 2).| Adsorbates | T (K) | ln![[thin space (1/6-em)]](https://www.rsc.org/images/entities/char_2009.gif) Ko Ko |
ΔG° (kJ mol−1) | ΔH° (kJ mol−1) | ΔS° (J mol−1 K−1) |
|---|---|---|---|---|---|
| TC | 288 | 1.86 | −4.51 | 24.53 | 100.85 |
| 298 | 2.29 | −5.52 | |||
| 308 | 2.52 | −6.53 | |||
| SMZ | 288 | 1.61 | −3.83 | 16.62 | 71.01 |
| 298 | 1.81 | −4.33 | |||
| 308 | 2.06 | −5.15 |
Generally, ΔG° for physisorption is between −20 and 0 kJ mol−1 and for chemisorption is between −80 and −400 kJ mol−1, which implied that physisorption might dominate the adsorption of TC and SMZ onto Cα-850-4. Furthermore, Kara et al.41 suggested that the ΔH° value for physical adsorption is smaller than 40 kJ mol−1, also indicating that the adsorption processes for TC and SMZ were mainly physical adsorption. Moreover, the positive values of ΔH° evinced the increment of randomness at the contact interface in the adsorption process.16
3.8. Mechanism analysis
Adsorption of antibiotics on carbonaceous materials are determined by their physical and chemical interaction. Textual characteristics play a fundamental role on physical adsorption. A high specific surface area and huge pore volume significantly promote TC and SMZ adsorption on Cα-850-4. The micropore-filling effect can be applied to elucidate the superior removal performance. The adsorption capacity is in correlation with surface properties of the adsorbent and the adsorption capability is directly proportional to the micropore surface area and micropore volume.13 According to the results of the thermodynamic analysis, van der Waals forces might serve as the dominant factor for the removal of TC and SMZ by Cα-850-4. Moreover, the intensity of van der Waals forces is related to their valid contact surface area with the adsorbent.Meanwhile, several extra essential adsorption mechanisms such as π–π EDA interactions, hydrogen bonding, and hydrophobic interactions may be involved in the process. Ji et al.42 explained the strong adsorption interaction mainly derived from the binding of tetracycline by carbon nanotubes (CNTs), including van der Waals forces and π–π EDA interactions between the protonated amino group (π-electron-acceptors) and the graphene π-electrons. In this course, TC is in possession of a conjugated enone that can act as π-electron acceptors commendably, due to the strong electron-withdrawing ability of the ketone group, and therefore interact strongly with the short stacks of graphite-like sheets (π-electron-donors) arranged in the disordered form of Cα-850-4 via π–π EDA interactions as confirmed by Raman spectra.
TC has more functional groups, including phenol, alcohol, ketone, and amino, hence, the interaction with Cα-850-4 is in a wider range than those of SMZ. Within the tested pH of 6.0, the zwitterion of tetracycline predominated. TC has abundant H-bonding acceptors (Fig. S1†), and hydrogen bonding interactions between the functional groups of antibiotics such as –OH, –NHx as H-acceptor and the O-containing functional groups including –COOH and C–OH of Cα-850-4 is more intensive.38 Therefore, a greater sorption capacity of TC was observed. Lastly, compared with SMZ, TC can be adsorbed more strongly on the surface of carbonaceous Cα-850-4 despite its much lower hydrophobicity, as a higher SW and lower log![[thin space (1/6-em)]](https://www.rsc.org/images/entities/char_2009.gif) KOW of TC are shown in Table S1,† demonstrating that the contribution of hydrophobic interactions to adsorption was limited.
KOW of TC are shown in Table S1,† demonstrating that the contribution of hydrophobic interactions to adsorption was limited.
3.9. Recycling performance
The recyclability and removal activation of an adsorbent are important for the application of pollutant control and reclaim. As shown in Fig. 8, after three adsorption–harvesting cycles, the recyclable adsorption behavior of the α-cellulose based bioadsorbent to TC and SMZ was similar and the adsorption capacities of the biobased adsorbent decreased slightly. The adsorption capability still remained at 82.8% for TC and 85.9% for SMZ after 3 cycles. This demonstrated that the adsorbent has good recycling ability for the removal of TC and SMZ. The potential of the α-cellulose-based adsorbents for the practical application of pollutant removal will be further studied in our future study.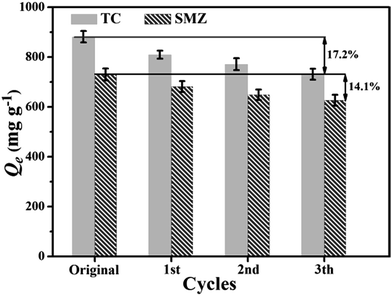 | ||
| Fig. 8 Recycling property of Cα-850-4 for TC adsorption (C0 = 200 mg L−1, pH = 6.0, t = 24 h, T = 298 K). | ||
4. Conclusion
In this study, an efficient and low-cost hierarchically porous carbon was successfully synthesized from α-cellulose in two steps. The prepared samples showed a high surface area and superb adsorption performance of TC and SMZ antibiotics. 850 °C as an activation temperature and 4 as an impregnation ratio of KOH/Cα were adopted as the ideal activation conditions according to adsorption data. SBET and total pore volume of Cα-850-4, evaluated using nitrogen adsorption isotherms, correspond to 3187.91 m2 g−1, 1.781 cm3 g−1 respectively. High-performance adsorption capability can be achieved from well-developed porosity. Due to the multiple ionizable functional groups of TC and SMZ antibiotics, pH and external ionic species have a dependent effect on adsorption efficiency. Accordingly, Cα-β-γ is hereby presented as a porous carbon adsorbent with high pore volume and specific surface area from α-cellulose that is promising for application in wastewater treatment and has economic benefits to the environment.Acknowledgements
This work was financially supported by National Natural Science Foundation of China (No. 21176107, 21174057, 21277063, 21446015 and U1407123), National Basic Research Program of China (973 Program, 2012CB821500), Natural Science Foundation of Jiangsu Province (BK20140534), Ph.D. Innovation Programs Foundation of Jiangsu Province (No. CXZZ13_0668), Research Fund for the Doctoral Program of Higher Education of China (20133227110022 and 20133227110010) and Jiangsu Planned Projects for Postdoctoral Research Funds (1102119C).References
- M. Hvistendahl, Science, 2012, 336, 795 CrossRef CAS PubMed.
- J. V. Holm, K. Ruegge, P. L. Bjerg and T. H. Christensen, Environ. Sci. Technol., 1995, 29, 1415–1420 CrossRef CAS PubMed.
- K. L. Carstens, A. D. Gross, T. B. Moorman and J. R. Coats, Environ. Sci. Technol., 2013, 47, 10877–10883 CrossRef CAS PubMed.
- S. D. Kim, J. Cho, I. S. Kim, B. J. Vanderford and S. A. Snyder, Water Res., 2007, 41, 1013–1021 CrossRef CAS PubMed.
- K. Kummerer, Chemosphere, 2009, 75, 417–434 CrossRef PubMed.
- B. Li and T. Zhang, Environ. Sci. Technol., 2010, 44, 3468–3473 CrossRef CAS PubMed.
- S. W. Nam, D. J. Choi, S. K. Kim, N. Her and K. D. Zoh, J. Hazard. Mater., 2014, 270, 144–152 CrossRef CAS PubMed.
- X. Zhu, Y. Liu, G. Luo, F. Qian, S. Zhang and J. Chen, Environ. Sci. Technol., 2014, 48, 5840–5848 CrossRef CAS PubMed.
- G. Juan and J. A. Pedersen, Environ. Sci. Technol., 2005, 39, 9509–9516 CrossRef.
- P. H. Chang, Z. Li, J. S. Jean, W. T. Jiang, C. J. Wang and K. H. Lin, Appl. Clay Sci., 2012, 67–68, 158–163 CrossRef CAS.
- X. Song, D. Liu, G. Zhang, M. Frigon, X. Meng and K. Li, Bioresour. Technol., 2014, 151, 428–431 CrossRef CAS PubMed.
- J. Dai, J. He, A. Xie, L. Gao, J. Pan, X. Chen, Z. Zhou, X. Wei and Y. Yan, Chem. Eng. J., 2016, 284, 812–822 CrossRef CAS.
- L. Ji, Y. Wan, S. Zheng and D. Zhu, Environ. Sci. Technol., 2011, 45, 5580–5586 CrossRef CAS PubMed.
- C. X. Yan, C. Q. Wang, J. F. Yao, L. X. Zhang and X. Q. Liu, Colloids Surf., A, 2009, 333, 115–119 CrossRef CAS.
- J. Wang and S. Kaskel, J. Mater. Chem., 2012, 22, 23710–23725 RSC.
- M. J. Ahmed and S. K. Theydan, Chem. Eng. J., 2012, 211–212, 200–207 CrossRef CAS.
- D. Klemm, B. Heublein, H. P. Fink and A. Bohn, Angew. Chem., Int. Ed., 2005, 44, 3358–3393 CrossRef CAS PubMed.
- L. Liu, Z. Y. Gao, X. P. Su, X. Chen, L. Jiang and J. M. Yao, ACS Sustainable Chem. Eng., 2015, 3, 432–442 CrossRef CAS.
- A. C. Martins, O. Pezoti, A. L. Cazetta, K. C. Bedin, D. A. S. Yamazaki, G. F. G. Bandoch, T. Asefa, J. V. Visentainer and V. C. Almeida, Chem. Eng. J., 2015, 260, 291–299 CrossRef CAS.
- L. Lin, S.-R. Zhai, Z.-Y. Xiao, Y. Song, Q.-D. An and X.-W. Song, Bioresour. Technol., 2013, 136, 437–443 CrossRef CAS PubMed.
- S. Deng, Y. Nie, Z. Du, Q. Huang, P. Meng, B. Wang, J. Huang and G. Yu, J. Hazard. Mater., 2015, 282, 150–157 CrossRef CAS PubMed.
- A. U. Rajapaksha, M. Vithanage, M. Zhang, M. Ahmad, D. Mohan, S. X. Chang and Y. S. Ok, Bioresour. Technol., 2014, 166, 303–308 CrossRef CAS PubMed.
- Q. Q. Zhang, G. G. Ying, C. G. Pan, Y. S. Liu and J. L. Zhao, Environ. Sci. Technol., 2015, 49, 6772–6782 CrossRef CAS PubMed.
- S. Lagergren, K. Sven. Vetenskapsakad. Handl., 1898, 24, 1–13 Search PubMed.
- S. Azizian, J. Colloid Interface Sci., 2004, 276, 47–52 CrossRef CAS PubMed.
- D. Kavitha and C. Namasivayam, Bioresour. Technol., 2007, 98, 14–21 CrossRef CAS PubMed.
- I. Langmuir, J. Am. Chem. Soc., 1916, 38, 2221–2295 CrossRef CAS.
- H. M. F. Freundlich, Z. Phys. Chem., 1906, 57, 384–470 Search PubMed.
- M. Temkin and V. Pyzhev, Acta Physicochim. URSS, 1940, 12, 217–222 Search PubMed.
- M. Yang, L. Guo, G. Hu, X. Hu, L. Xu, J. Chen, W. Dai and M. Fan, Environ. Sci. Technol., 2015, 49, 7063–7070 CrossRef CAS PubMed.
- H. Xiao, H. Peng, S. H. Deng, X. Y. Yang, Y. Z. Zhang and Y. W. Li, Bioresour. Technol., 2012, 111, 127–133 CrossRef CAS PubMed.
- K. Y. Foo and B. H. Hameed, Bioresour. Technol., 2013, 130, 696–702 CrossRef CAS PubMed.
- J. Wang, Z. Chen and B. Chen, Environ. Sci. Technol., 2014, 48, 4817–4825 CrossRef CAS PubMed.
- T. Horikawa, N. Sakao, T. Sekida, J. Hayashi, D. D. Do and M. Katoh, Carbon, 2012, 50, 1833–1842 CrossRef CAS.
- H. Sayğılı, F. Güzel and Y. Önal, J. Cleaner Prod., 2015, 93, 84–93 CrossRef.
- W. Yang, F. Zheng, Y. Lu, X. Xue and N. Li, Ind. Eng. Chem. Res., 2011, 50, 13892–13898 CrossRef CAS.
- L. Ji, W. Chen, S. Zheng, Z. Xu and D. Zhu, Langmuir, 2009, 25, 11608–11613 CrossRef CAS PubMed.
- O. Patryk, P. Bo and X. Baoshan, Environ. Sci. Technol., 2009, 43, 9167–9173 CrossRef PubMed.
- Y. Shen, Q. Fang and B. Chen, Environ. Sci. Technol., 2015, 49, 67–84 CrossRef CAS PubMed.
- X. Zhu, Y. Liu, C. Zhou, S. Zhang and J. Chen, ACS Sustainable Chem. Eng., 2014, 2, 969–977 CrossRef CAS.
- M. Kara, H. Yuzer, E. Sabah and M. S. Celik, Water Res., 2003, 37, 224–232 CrossRef CAS PubMed.
- L. Ji, W. Chen, L. Duan and D. Zhu, Environ. Sci. Technol., 2009, 43, 2322–2327 CrossRef CAS PubMed.
- L. Zhang, X. Song, X. Liu, L. Yang, F. Pan and J. Lv, Chem. Eng. J., 2011, 178, 26–33 CrossRef CAS.
- Y. Gao, Y. Li, L. Zhang, H. Huang, J. J. Hu, S. M. Shah and X. G. Su, J. Colloid Interface Sci., 2012, 368, 540–546 CrossRef CAS PubMed.
- N. Liu, M. X. Wang, M. M. Liu, F. Liu, L. Weng, L. K. Koopal and W. F. Tan, J. Hazard. Mater., 2012, 225–226, 28–35 CrossRef CAS PubMed.
- X. Zhu, Y. Liu, F. Qian, C. Zhou, S. Zhang and J. Chen, Bioresour. Technol., 2014, 154, 209–214 CrossRef CAS PubMed.
- Q. Yang, G. Chen, J. Zhang and H. Li, RSC Adv., 2015, 5, 25541–25549 RSC.
- X. Guo, J. Zhang, J. Ge, C. Yang, Z. Dang, S. Liu and L. Gao, RSC Adv., 2015, 5, 100464–100471 RSC.
Footnote |
| † Electronic supplementary information (ESI) available. See DOI: 10.1039/c6ra00277c |
| This journal is © The Royal Society of Chemistry 2016 |

