Highly sensitive visual detection of catalase based on the accelerating decomposition of H2O2 using Au nanorods as a sensor
Simin Lua,
Ling Chena,
Ping Yang*a and
Katarzyna Matras-Postolekb
aSchool of Material Science and Engineering, University of Jinan, Jinan, 250022, P. R. China. E-mail: mse_yangp@ujn.edu.cn; Fax: +86 531 87974453; Tel: +86 531 89736225
bFaculty of Chemical Engineering and Technology, Cracow University of Technology, Krakow, 31-155, Poland
First published on 12th February 2016
Abstract
The detection of catalase associated with various diseases is very important due to the fact that it is frequently downregulated in human cancer tissues. Noble metal nanomaterial-assisted sensors have achieved rapid development for wide applications but few for detecting catalase. Thus, a novel colourimetric strategy has been developed for the selective and rapid visual detection of catalase by using the decelerating etching of gold nanorods (NRs). In the presence of hexadecyltrimethylammonium bromide and SCN−, which can reduce the redox potential of Au(I)/Au (0), Au NRs would be etched by H2O2 along the longitudinal direction. As a consequence, the colour of solutions changed from bluish green to pink accompanied by the localized surface plasmon resonance (LSPR) extinction peak being shifted to short wavelength. In contrast, the etching process would be prohibited in the presence of catalase, and the colour and LSPR extinction peak of Au NRs would remain unchanged. Furthermore, this Au NR based sensor is applied to test paper that could be used in the detection of catalase in real samples. The discussion of the mechanism indicates that such a sensing method has an ideal performance in terms of sensitivity, selectivity, and linearity.
Introduction
In recent years, noble metal (e.g., Au and Ag) nanoparticles have attracted increasing attention because of their unique physical properties that are extremely sensitive to their shape, size, composition, the interaction between nanoparticles and the surrounding medium.1–6 Among various noble metal nanoparticles, gold nanoparticles display strong localized surface plasmon resonances (LSPR) and strong surface plasmon resonance (SPR) absorption. In addition, the extinction coefficient of Au nanoparticles is higher than that of organic dyes in the visible wavelength region.7 Owing to their unique optical property gold nanoparticle-based visual detection method has been developed gradually. Due to their simplicity, potential application to on-site detection, and high sensitivity, this method has been widely applied in analytical chemistry filed.8–10 Lots of methods are based on the aggregation of functionalized gold nanoparticles directly and indirectly. The aggregation of gold nanoparticles can lead to the decrease of absorbance and a red-shift of localized surface plasmon resonance absorption, which accompanied with a visible colour change from wine red to blue.11 However, these methods usually require tedious steps to modify the analyzed recognition reagents onto the surface of the gold nanoparticles. In addition, most of the nanoparticle-aggregation-based visual detection method will suffer from the auto-aggregation in complicated samples, which could give rise to false positive results and high backgrounds. In some sense, these drawbacks inherently limit the application and some more facile and effective methods were strongly suggested to be produced.To avoid the disadvantages mentioned above, a promising method has been developed, which based on etching of gold nanoparticles for sensing of various targets. Gold nanoparticles have all kinds of shapes. Among other shapes, Au nanorods (NRs) have the most special LSPR band which contains both transverse surface plasmon resonance and longitudinal plasmon resonance. In addition, Au NRs have a large extinction coefficient (−109 M−1 cm−1) compared with gold nanoparticles.12 Their longitudinal plasmon resonance is highly sensitive to the aspect ratio (AR) of themselves. The mechanism of this method is based on the shape-dependent longitudinal plasmon resonance of Au NRs. The etching leads to the decrease of AR of NRs, resulting in an obvious blue shift of longitudinal plasmon resonance in LSPR band. This method has been applied for detecting many targets, including Cu2+, Pb2+, Cl−, I−, Co2+, enzyme, H2O2.13–19 In general, analytes can be divided into four categories: (I) analytes (Cu2+, I−, Fe3+) have higher redox potential compared with Au+(I)/Au0 at certain condition.15 (II) analytes (Co2+ and glucose) can generate strong oxidants, including hydroxyl radical (˙OH), superoxide radical (O2˙−), and H2O2,20 (III) analytes (Pb2+, Cl−, and CN−) can form gold/analyte complex or metal–Au alloys which leads to the decrease of redox potential,21 (IV) analytes can inhibit the etching of Au NRs, which can remain the shape of LSPR band unchanged. Not only can this kind of strategy gets rid of a difficult surface modification of gold nanoparticles but also avoids false positive signal due to the auto-aggregation of gold nanoparticles. Hence, it's necessary for us to employ this sensor for more meaningful works.
Catalase, existing mainly in cells, is a kind of essential enzyme for many aerobionts, animals, and even for plants. It is an important antioxidant enzyme that has an ability to dismutate hydrogen peroxide into molecular oxygen and water (2H2O2 → 2H2O + O2), the transformation plays an important role in defending cell against oxidative damage.22 Usually, unnormal catalase expression is associated with many disease, including diabetes, hypertension, Alzheimer disease, acatalasemia, and vitiligo.23,24 It's worth noting that catalase is frequently down regulated in human cancer tissues compared with healthy tissue.25,26 Thus, lots of methods, including ultraviolet spectroscopy, permanganate titration method, iodometric assay, and manometric method, have been employed for the detection of catalase for a long time. For example, Futo's group developed an amperometric based biosensor for detecting catalase,27 Jon's group developed an aptamer based surface plasmon resonance biosensor for the detection of catalase in milk.28 Nevertheless, these methods can't avoid tedious and imprecise procedure. Therefore, it's essential for us to develop a more accurate, sensitive, and reliable method for the detection of catalase.
Herein, a cost-effective and simple sensing platform for catalase in solution at 37 °C which is consistent with the body temperature of human was demonstrated based on cetyltri-methylammonium bromide (CTAB)-stabilized Au NRs. At the absence of catalase, H2O2 has higher redox potential than Au(0), which can etch Au NRs along the longitudinal direction. The occurrence of etching can lead an obvious colour change and a blue-shift of longitudinal LSPR band of Au NRs. While, when catalase exists, H2O2 is dismutated into H2O and O2. Thus, the colour and the LSPR band of Au NRs remain unchanged. The results show that this sensing method has a unique performance in terms of sensitivity, selectivity, and linearity.
Experimental
Chemicals
Hydrogen tetrachloroaurate(III) dehydrate (HAuCl4·3H2O), cetyltrimethylammonium bromide (CTAB, 99%), ascorbic acid (AA, 99.7%), sodium borohydride (NaBH4; 96%), silver nitrate (AgNO3, 99.8%), hydrogen peroxide (H2O2, 30 wt%), potassium thiocyanate (KSCN, 99%) were obtained from Sinopharm Group Chemical Reagent Co. Ltd. (Shanghai, China), and catalase (≥35![[thin space (1/6-em)]](https://www.rsc.org/images/entities/char_2009.gif) 000 units per mg protein) were obtained from Aladdin industrial corporation (Shanghai, China). All of the reagents were of analytical grade and were used without further purification.
000 units per mg protein) were obtained from Aladdin industrial corporation (Shanghai, China). All of the reagents were of analytical grade and were used without further purification.
Instrumentation
Double-distilled water was obtained from a Milli-Q synthesis system. Transmission electron microscopy (TEM) images were obtained from H-9000A electron microscope (Hitachi). High resolution transmission electron microscopy (HRTEM) images were obtained from JEM-2100 under an acceleration voltage of 200 kV. UV-vis extinction spectra were measured on a U-4100 spectrophotometer (Hitachi). Cyclic-voltammetry (CV) measurements were conducted on CHI660E Electrochemical Workstation.Synthesis of Au NRs
All experimental glassware used in the following procedures were cleaned in a bath of fresh aqua regia (3![[thin space (1/6-em)]](https://www.rsc.org/images/entities/char_2009.gif) :
:![[thin space (1/6-em)]](https://www.rsc.org/images/entities/char_2009.gif) 1 (v/v) HCl/HNO3), rinsed thoroughly in double-distilled water, and dried in dryer. The Au NRs were synthesized according to the as-reported method.29 (1) Seed solution: 5 mL of CTAB (0.10 M) solution were mixed with 2.5 mL of HAuCl4·3H2O (0.60 mM), 0.3 mL of NaBH4 (0.01 M) was added in the mixture at last. The mixture was kept in water at 25 °C for 1 hour. (2) Growth solution: 80 mL of CTAB (0.10 M) was mixed with 1.2 mL of an aqueous HAuCl4·3H2O (50 mM) solution in a glassware with stirring. Then, 0.055 mL of AgNO3 (50 mM) solution and 1 mM of AA (0.08 M) were added to the solution in order. Finally, 0.16 mL of seed solution prepared in step (1) was added into the growth solution at room temperature. The colour of the solution gradually changed from transparent to green within 20 min. The obtained solution was then left undisturbed for 12 hours. Au NRs were centrifuged twice at 8000 rpm for 15 min to remove excess unreacted materials. The obtained soft sediment was re-suspended in 0.05 M CTAB solution.
1 (v/v) HCl/HNO3), rinsed thoroughly in double-distilled water, and dried in dryer. The Au NRs were synthesized according to the as-reported method.29 (1) Seed solution: 5 mL of CTAB (0.10 M) solution were mixed with 2.5 mL of HAuCl4·3H2O (0.60 mM), 0.3 mL of NaBH4 (0.01 M) was added in the mixture at last. The mixture was kept in water at 25 °C for 1 hour. (2) Growth solution: 80 mL of CTAB (0.10 M) was mixed with 1.2 mL of an aqueous HAuCl4·3H2O (50 mM) solution in a glassware with stirring. Then, 0.055 mL of AgNO3 (50 mM) solution and 1 mM of AA (0.08 M) were added to the solution in order. Finally, 0.16 mL of seed solution prepared in step (1) was added into the growth solution at room temperature. The colour of the solution gradually changed from transparent to green within 20 min. The obtained solution was then left undisturbed for 12 hours. Au NRs were centrifuged twice at 8000 rpm for 15 min to remove excess unreacted materials. The obtained soft sediment was re-suspended in 0.05 M CTAB solution.
Electrochemical measurements
Au NRs were washed twice by centrifugation and then were dispersed into double-distilled water. After dropping 200 μL of centrifuged Au NR solution on indium tin oxide substrates, the substrates with the deposited Au NRs were washed again with ethanol and then used as the working electrodes. Ag/AgCl served as the reference electrode and a Pt wire was used as the counter electrode. As for electrolyte solution, an aqueous solution of H2SO4 (0.1 M) was purged with high-purity N2 gas for half an hour. The voltage scan rate was 20 mV s−1.Procedure for sensing catalase
Catalase solutions with different volume (all of catalase used in the experiment was diluted 35![[thin space (1/6-em)]](https://www.rsc.org/images/entities/char_2009.gif) 000 times by water) and 80 μL of H2O2 were added into a serious 2 mL calibrated test tube and equilibrated at 37 °C for 30 min. Then, the prepared Au NRs (300 μL) and 20 μL of KSCN (0.1 M) were added, respectively. After incubation at 37 °C for 30 min, the resulting solution was then subjected to UV-vis spectroscopic measurement.
000 times by water) and 80 μL of H2O2 were added into a serious 2 mL calibrated test tube and equilibrated at 37 °C for 30 min. Then, the prepared Au NRs (300 μL) and 20 μL of KSCN (0.1 M) were added, respectively. After incubation at 37 °C for 30 min, the resulting solution was then subjected to UV-vis spectroscopic measurement.
Results and discussion
Proposed principle for sensing system
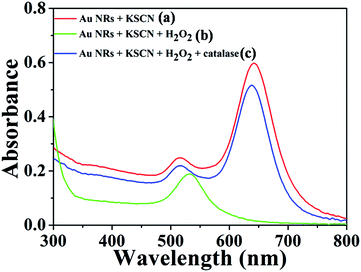
Scheme 1 illustrates the working mechanism for the detection of catalase based on decelerating etching of Au NRs schematically. H2O2 is a type of strong oxidants that can oxidize Au. As indicated in Fig. 1 (curves a–c), initially, in the absence of catalase, CTAB-stabilized Au NRs (length/diameter ratio is about 2.5![[thin space (1/6-em)]](https://www.rsc.org/images/entities/char_2009.gif) :
:![[thin space (1/6-em)]](https://www.rsc.org/images/entities/char_2009.gif) 1) were etched by dissolved H2O2. After incubation in a 37 °C water bath for 30 minutes, the colour of solution changes from bluish green to pink gradually corresponds to the obvious change in the UV-vis extinction spectrum that originally exhibited two peaks located at 639 nm (longitudinal surface plasmon resonance) and 518 nm (transverse surface plasmon resonance) and the longitudinal surface plasmon resonance band shifted to shorter wavelength. However, this change would be prevented by the presence of catalase that can decompose H2O2 into H2O and O2. The decomposition of H2O2 slows down the rate of etching and the shapes of Au NRs nearly remain unchanged, which leads to the Au NRs solution remained bluish green corresponding well to the slight change of location of longitudinal surface plasmon band.
1) were etched by dissolved H2O2. After incubation in a 37 °C water bath for 30 minutes, the colour of solution changes from bluish green to pink gradually corresponds to the obvious change in the UV-vis extinction spectrum that originally exhibited two peaks located at 639 nm (longitudinal surface plasmon resonance) and 518 nm (transverse surface plasmon resonance) and the longitudinal surface plasmon resonance band shifted to shorter wavelength. However, this change would be prevented by the presence of catalase that can decompose H2O2 into H2O and O2. The decomposition of H2O2 slows down the rate of etching and the shapes of Au NRs nearly remain unchanged, which leads to the Au NRs solution remained bluish green corresponding well to the slight change of location of longitudinal surface plasmon band.
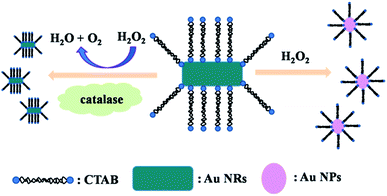 | ||
| Scheme 1 Schematic illustration for visual detection of catalase based on accelerating decomposition of H2O2. | ||
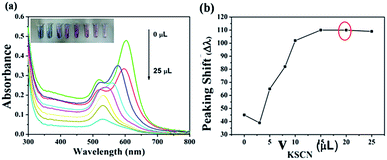
Condition optimization for etching process
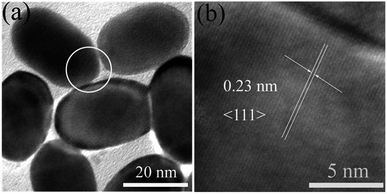
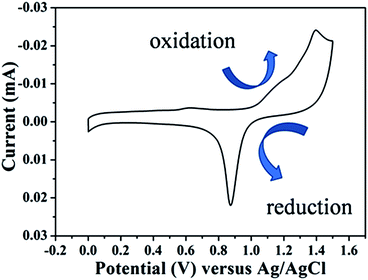
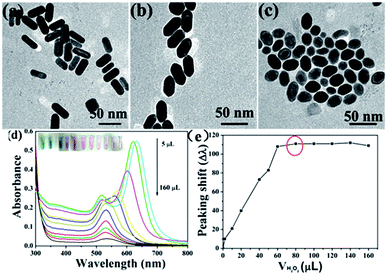
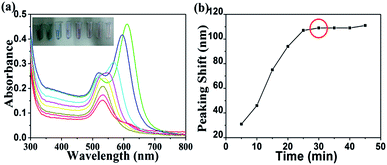
As shown in Fig. 3, the observed lattice spacing 0.23 nm is in well agreement with Au {111} spacing (0.235 nm), this confirmed that end facets of Au NRs are composed of {111} after they were etched by H2O2.33 In conclusion, the reasons of preferential etching along the longitudinal direction of Au NRs are that less surface passivation caused by CTAB and its end facet is composed of high energy crystal plane ({100} and {110}). However, in this sensing system, CTAB is not only a stabilizer but also an ion-association reagent. When CTAB acts as ligands of Au (AuBr2−–CTA+), the standard redox potential of Au(I)/Au(0) (1.691 eV) can be reduced.34 This can be confirmed by CV measurement (Fig. 4), the redox potential was reduced to 1.4 eV. Hence, it's necessary for us to re-suspend Au NRs in CTAB solution after they were centrifuged.
It is worth noting that the oxidization capability of H2O2 depends on the acidity of the solution.19
Under alkaline conditions,
| H2O2 + 2e− → 2OH, E0 = 0.867 eV | (1) |
Under acid conditions,
| H2O2 + 2H+ + 2e− → 2H2O, E0 = 1.763 eV | (2) |
It has a standard potential of 0.867 V in an alkaline solution and 1.763 V in an acidic solution, only one of which is higher than that of gold species (AuBr2−–CTA+/Au, E < 0.2 eV vs. the normal hydrogen electrode, NHE).16 Thus the whole etching experiment should be conducted under acid conditions. The prepared Au NR solution is acid, which meets the demand of pH value.
Sensitivity for sensing catalase
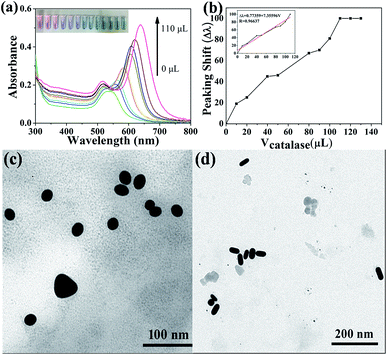
As we mentioned above, catalase has an ability to dismutate hydrogen peroxide into molecular oxygen and water (2H2O2 → 2H2O + O2), which may provide a possible approach for easy and sensitive determination of catalase by naked eyes. In order to evaluate the sensitivity of the sensor, we employed the UV-vis extinction spectra of the Au NRs to record the changes of morphology in different volumes of catalase. Under optimized conditions (80 μL H2O2, 20 μL 0.1 M KSCN, incubation temperature 37 °C, incubation time 30 min), different volumes of catalase were added to the mixture solution. Fig. 7 shows the response of the sensor to different volumes of catalase. The longitudinal LSPR peak of Au NRs begin to shift to long wavelength gradually with the increase in the volumes of catalase (1 U g−1) in range of 0–130 μL, which results from the accelerating decomposition of H2O2 (Fig. 7a). The longitudinal LSPR band peaking shift almost tends to be unchangeable when the volumes of catalase increase to 110 μL and this phenomenon means that H2O2 has almost been decomposed completely by catalase.Thus, we can get a typical plot of peaking shift versus catalase volume (1 U g−1, 0–140 μL) that is shown in Fig. 7b, and an accurate linear relationship between peaking shift and the volumes of catalase, Δλ = 0.77359 + 7.35596 V (μL) has also been obtained over the range of 0–110 μL with the correlation coefficient of 0.96637. The TEM images in Fig. 7c and d show the morphologies of Au NRs in the presence of 20 μL and 100 μL catalase respectively) indicate the changes of morphology of Au NRs, which can give evidence of decomposition of H2O2. In addition, the digital photo (inset in Fig. 7a) shows that the colour of Au NRs solutions changing from pink to green with the increase in the volumes of catalase. All of evidences shown in Fig. 7 demonstrate that catalase inhibit H2O2 from etching Au NRs. It's necessary for us to know that the aspect ratio of Au NRs will influence the sensitivity of the test. Au NRs who have large aspect ratio will possess distinct LSPR band and colour. When they are etched by H2O2, theirs aspect ratio will decrease, and longitudinal LSPR band peaking shift change obviously. To our best knowledge, there are almost no detection methods for catalase, this visual sensing method is the easiest, sensitive, and selective. Furthermore, compared with other methods, Au NRs possess unique optical properties which can improve the sensitivity of sensor, and the etching detection method can avoid auto-aggregation in complicated samples successfully. For these reasons, we can draw a conclusion that the probe (Au NRs) displays an excellent detection performance toward catalase.
Practical application
Based on the above experiments, an easy test paper was developed for the visual detection of catalase in real sample, which was illustrated in Scheme 2. Briefly, a certain volume of CTAB-stabilized Au NRs colloid was dropped on the specific area of filter papers (Pall 66191, 0.45 μm, Pall Corporation, USA). The filter papers were evaporated in air absolutely. Then the sensing zone was immersed in target solution that contains a percentage of H2O2, KSCN, and different volumes of catalase. After incubation at 37 °C for 30 min, test papers were compared. The colour was turned from bluish green to pink gradually with decreasing catalase content concentration (Fig. 8), which can be observed by naked eyes. The test paper is simpler and more economical than other sensors for the detection of catalase.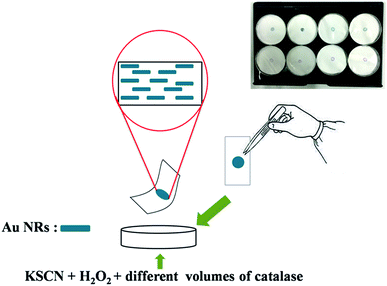 | ||
| Scheme 2 Schematic illustration for practical detection of catalase by using the equipment of test paper. | ||
Conclusions
We have developed a novel method for the visual detection of catalase with high sensitivity in aqueous at 37 °C based on the accelerating decomposition of H2O2, which can prevent H2O2 etching Au NRs, and we employ this system as the colourimetric probe. Compared to other existing sensors for the detection of catalase, our sensor shows sensitivity, selectivity and rapid response without the use of sophisticated equipment and any other modification steps. Only by observing the changes of LSPR band and colour of colloidal Au NRs, can we detect the content of catalase. In addition, this Au NRs-based sensor is applied to test paper that could be used in the rapid detection of catalase in real sample, which is meaningful for many areas such as medicine, chemistry, and food safety technology.Acknowledgements
This work was supported in part by the program for Taishan Scholars, the projects from National Natural Science Foundation of China (grant no. 51572109, 51501071, 51302106, 51402123, and 51402124).References
- M. Hu, J. Chen, Z. Y. Li, L. Au, G. V. Hartland, X. Li, M. Marquez and Y. Xia, Chem. Soc. Rev., 2006, 35, 1084 RSC.
- R. Wilson, Chem. Soc. Rev., 2008, 37, 2028 RSC.
- M. E. Stewart, C. R. Anderton, L. B. Thompson, J. Maria, S. K. Gray, J. A. Rogers and R. G. Nuzzo, Chem. Rev., 2008, 108, 494 CrossRef CAS PubMed.
- Y. S. Xia, J. J. Ye, K. H. Tan, J. J. Wang and G. Yang, Anal. Chem., 2013, 85, 6241 CrossRef CAS PubMed.
- L. Chen, J. H. Li and L. X. Chen, ACS Appl. Mater. Interfaces, 2014, 6, 15897 CAS.
- L. Chen, X. L. Fu, W. H. Lu and L. X. Chen, ACS Appl. Mater. Interfaces, 2013, 5, 284 CAS.
- S. Kubo, A. Diaz, Y. Tang, T. S. Mayer, I. C. Khoo and T. E. Mallouk, Nano Lett., 2007, 7, 3418 CrossRef CAS PubMed.
- D. Liu, Z. Wang and X. Jiang, Nanoscale, 2011, 3, 1421 RSC.
- K. Saha, S. S. Agasti, C. Kim, X. Li and V. M. Rotello, Chem. Rev., 2012, 112, 2739 CrossRef CAS PubMed.
- B. Yudhajit and C. Amarnath, ACS Sustainable Chem. Eng., 2014, 2, 2149 CrossRef.
- M. Nicholas, S. R. Adams, F. R. Jackson and W. W. David, Langmuir, 2012, 28, 1068 CrossRef PubMed.
- C. R. Paresh, A. K. Sadia, K. S. Anant, S. Dulal and F. Zhen, Chem. Soc. Rev., 2012, 41, 3193 RSC.
- Z. P. Chen, R. L. Liu, S. S. Wang, C. L. Qu, L. X. Chen and Z. Wang, RSC Adv., 2013, 3, 13318 RSC.
- R. Liu, Z. Chen, S. Wang, C. Qu, L. Chen and Z. Wang, Talanta, 2013, 112, 37 CrossRef CAS PubMed.
- L. Saa, M. Coronado-Puchau, V. Pavlov and L. M. Liz-Marzan, Nanoscale, 2014, 6, 7405 RSC.
- Z. Zhang, Z. Chen, C. Qu and L. X. Chen, Langmuir, 2014, 30, 3625 CrossRef CAS PubMed.
- J. M. Liu, L. Jiao, M. L. Cui, L. P. Lin, X. X. Wang, Z. Y. Zheng, L. H. Zhang and S. L. Jiang, Sens. Actuators, B, 2013, 188, 644 CrossRef CAS.
- Z. Y. Zhang, Z. P. Chen, S. S. Wang, F. B. Cheng and L. X. Chen, ACS Appl. Mater. Interfaces, 2015, 7, 27639 CAS.
- R. X. Zou, X. Guo, J. Yang, D. D. Li, F. Peng, L. Zhang, H. J. Wang and H. Yu, CrystEngComm, 2009, 11, 2797 RSC.
- Z. Zhang, Z. Chen, D. Pan and L. X. Chen, Langmuir, 2015, 31, 643 CrossRef CAS PubMed.
- A. R. Ferhan, L. Guo, X. Zhou, P. Chen, S. Hong and D. H. Kim, Anal. Chem., 2013, 85, 4094 CrossRef CAS PubMed.
- G. Christophe, Z. Marcel, M. S. Juan, V. Julien and B. C. Pedro, Free Radical Biol. Med., 2015, 87, 84 CrossRef PubMed.
- L. Goth, P. Rass and A. Pay, Mol. Diagn., 2004, 8, 141 CrossRef PubMed.
- J. Kodydkova, L. Vavrova, M. Kocik and A. Zak, Folia Biol., 2014, 60, 153 CAS.
- D. G. Bostwick, E. E. Alexander, R. Singh, A. Shan, J. R. Qian and M. Santella, Cancer, 2000, 89, 123 CrossRef CAS PubMed.
- H. J. Chung-man, S. Zheng, S. A. Comhair, C. Farver and S. C. Erzurum, Cancer Res., 2001, 61, 8578 Search PubMed.
- P. Fütö, G. Markus, A. Kiss and N. Adányi, Electroanalysis, 2012, 24, 107 CrossRef.
- A. Jon, F. Sam and Y. Li, Biosens. Bioelectron., 2013, 48, 126 CrossRef PubMed.
- Z. Zhang, Z. Chen and L. X. Chen, Langmuir, 2015, 31, 9253 CrossRef CAS PubMed.
- S. S. Wang, Z. P. Chen, L. Chen, R. L. Liu and L. X. Chen, Analyst, 2013, 138, 2080 RSC.
- D. K. Smith, N. R. Miller and B. A. Korgel, Langmuir, 2009, 25, 9518 CrossRef CAS PubMed.
- E. L. Samuel and J. M. Catherine, Chem. Mater., 2013, 25, 1250 CrossRef.
- G. Niti, S. Clark, M. Ashok and R. C. Jin, Langmuir, 2010, 26, 10271 CrossRef PubMed.
- J. Rodriguez-Fernandez, J. Perez-Juste, P. Mulvaney and L. M. Liz-Marzan, J. Phys. Chem. B, 2005, 109, 14257 CrossRef CAS PubMed.
| This journal is © The Royal Society of Chemistry 2016 |

