Doxorubicin-loaded pH-sensitive polymeric blends for synergistic cancer treatment
Wenlong Wanga,
Liang Zhanga,
Yuan Le*a,
Jiexin Wanga and
Jian-Feng Chenab
aState Key Laboratory of Organic-Inorganic Composites, Beijing University of Chemical Technology, Beijing 100029, PR China. E-mail: leyuan@mail.buct.edu.cn
bResearch Center of the Ministry of Education for High Gravity Engineering and Technology, Beijing University of Chemical Technology, Beijing 100029, PR China
First published on 11th March 2016
Abstract
An intelligentized system that can transport chemotherapeutics to targets in tumors is an attractive strategy to reverse drug resistance in tumor cells. In this work, a doxorubicin (DOX) delivery system composed of PEGylated resveratrol (PEG–GLY–RES) and poly(histidine)–PEG (PEG–PHIS) was prepared, characterized and evaluated for synergistic cancer therapy. RES was chemically linked with PEG as a component and DOX was loaded into the polymeric blends. This system had an average size of 80 nm, and showed the desired pH-dependent drug release properties, with much faster drug release at pH 5.5, mimicking the tumoral microenvironment. The MTT assay showed the drug loaded blends had higher cytotoxicity than free DOX in all doses. Confocal laser scanning microscopy observation and flow cytometry analyses indicated that the blends were efficiently internalized into HeLa cells, released DOX into the cytoplasm, and entered the nuclei. Endocytosis inhibition results proved that the blends entered the HeLa cells mainly through clathrin-mediated endocytosis and macropinocytosis. It has been shown that such co-delivery of RES and DOX is promising for improvement of anti-cancer efficacy.
1. Introduction
Resveratrol (RES) is a natural polyphenol commonly found in grapes, berries, and peanuts that can prevent or slow the progression of a wide variety of illnesses, including cancer,1–3 cardiovascular disease,4 and ischemic injuries.5 RES has an intrinsic antioxidant capacity that likely contributes to its chemoprotective effects.6 In vitro studies indicate RES can increase the plasma antioxidant capacity, decrease lipid peroxidation,7 suppresses cell viability and proliferation in ER-positive and ER-negative cells.8 Moreover, RES can inhibit certain types of cancer owing to its ability to induce apoptosis, activate caspase, modulate signaling pathways and decrease cell proliferation, arrest cell cycles as well as decrease metastasis.9 Despite of the potential health benefits of RES, its utilization as a drug within the pharmaceutical field is currently limited due to its poor water solubility, low bioavailability and chemical instability.10–12Doxorubicin (DOX) is a commonly used chemotherapeutic agent in several types of cancer including ovarian and breast cancer.13–15 DOX potently inhibits proliferation of cancer cells through binding to topoisomerase enzyme II or directly intercalating with DNA base pairs to suppress DNA base pairs to suppress DNA replication and induce cell apoptosis.16 However, DOX often causes serious cytotoxicity in normal tissues17–19 and induces drug resistance in cancer cells20 due to high administrated dosage. Generally, conventional single drug chemotherapy exhibits low therapeutic efficacy and high toxicity due to limited accessibility of the drug to tumor tissues,21 as well as multi-drug resistance (MDR) after repeated treatment.22 The combination of two or more drugs within a single nanocarrier can overcome toxicity and other side-effects.23–25
Recent studies showed that a supplement of antioxidant drug during anticancer therapy may reduce adverse reactions and improve the potential for success in terms of tumor response.26 For example, RES synergistically promotes 5-fluorouracil (5-FU)-mediated apoptosis of cancer cells irrespective of p53.27,28 RES and quercetin combined with DOX were synergistic in human ovarian cancer (SKOV-3 cells) and protected H9c2 cells against DOX-induced cardiotoxicity.29
As we know, the physiological pH of blood and normal tissues is 7.4, but the extracellular pH in some tumor tissues is 6.8, and the intracellular endo/lysosomal pH ranges from 4.0 to 5.5.30 Therefore, pH responsive carriers have unprecedented control over anticancer drug release and delivery to increase efficacy in vitro and/or in vivo.31 Xu et al.32 prepared pH-sensitive nanoparticles based on poly(2-(puridin-2-yl disulfanyl)ethyl acrylate)-g-PEG/cRGD graft copolymers (PDS-g-PEG/cRGD). The release of DOX from these nanoparticles was low at pH 7.4 but greatly enhanced at pH 5.5. In addition, DOX-loaded nanoparticles have higher anti-cancer activity in HCT-116 colon cancer cells than free DOX. Leng et al.33 reported amphiphilic dendritic star-block copolymer PCL-b-PDMAEMA composed of poly(ε-caprolactone) and poly(2-(N,N-dimethyl amino)ethyl methacrylate) was synthesized and used as carrier for delivering camptothecin. These copolymer micelles showed good biocompatibility and the release of drug camptothecin could be effectively controlled by altering the pH values of the environment. In addition, pH stimulus-sensitive polymer–drug conjugates have emerged as appealing approaches to readily modulate drug release triggered by external stimulus.34,35 Although these pH-sensitive polymers could control the release of drug and improve the cancer treatment, it is still a great challenge to overcome the side effects of overdose. Thus, we design a polymeric blend for co-delivery RES and DOX in different ways, which could enhance cellular uptake and achieve a synergistic effect in cancer therapy.
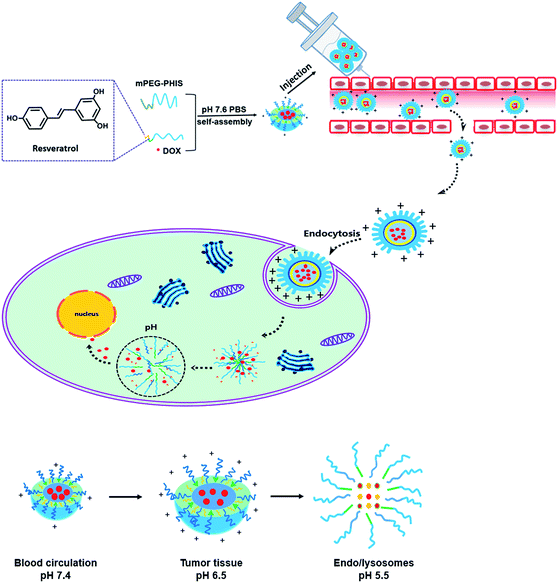
In this study, pH responsive polymeric blends delivering RES and DOX was proposed, which was decided by the hydrophobic effect between RES and PHIS and molecular chain interaction between PEG–GLY–RES and PEG–PHIS. PEG–GLY–RES that has anticancer activity was selected as a segment of blends to enhance the anticancer activity, and PEG–PHIS was used as pH-sensitive segment. The physicochemical characteristics and drug-loading capacities of blends were evaluated by scanning electron microscopy (SEM), dynamic light scattering (DLS) and ultraviolet spectrophotometer (UV). The cytotoxicity of the drug loaded blends was studied using HeLa cells and MCF-7 cells by the MTT assay. The behavior of the intracellular release of DOX was demonstrated in HeLa cells under confocal laser scanning microscopy (CLSM) and flow cytometry (FCM). Finally, we further investigated the internalization pathways of drug loaded blends with three different types of endocytosis inhibitors in HeLa cells under CLSM and FCM. An overview of drug loaded polymeric blends for drug release is presented in Scheme 1.
2. Experimental section
2.1. Materials
Poly-L-histidine (PHIS) with a number average molecular weight of 5000 Da was purchased from Scilight Biotechnology, LLC (Beijing, China). Methoxyl PEG succinimidyl ester (mPEG3500–NHS) was purchased from Jen Kem Technology Co. LTD (Beijing, China). Glycine (purity ≥ 99.9%) was purchased from Fuchen Chemical Reagent Co., Ltd (Tianjin, China). Dicyclohexyl-carbodiimide (DCC, purity ≥ 99%) and 4-dimethylaminopyridine (DMAP, purity ≥ 99%) were obtained from Aladdin Industrial Corporation (Shanghai, China). trans-Resveratrol (3,4′,5-trihydroxy-trans-stilbene, purity ≥ 99.9%) was purchased from Xi'an Haoxuan Biological Science and Technology Ltd (Xi'an, China). HeLa cells, MCF-7 cells, Dulbecco's modification of Eagle's medium (DMEM), fetal bovine serum, and penicillin–streptomycin were obtained from Peking Union Cell Resource Center (Beijing, China). Succinic anhydride and other solvents were purchased from Chemical Reagent Co., Ltd (Beijing, China).2.2. Synthesis of mPEG–PHIS
mPEG–PHIS was synthesized as described previously.36 Poly(L-histidine) (2 mmol) was dissolved in acetic acid (10 mM) followed by adjustment of pH to 6.5 with 0.1 M NaOH. An excess amount of mPEG–NHS (1.5![[thin space (1/6-em)]](https://www.rsc.org/images/entities/char_2009.gif) :
:![[thin space (1/6-em)]](https://www.rsc.org/images/entities/char_2009.gif) 1, mol/mol) was added to the above solution and the reaction was carried out under the nitrogen gas for 12 h at room temperature. The reaction mixture was dialyzed with dialysis membranes with a molecular weight cut-off of 5 kDa against deionized water for 72 h to remove the unreacted mPEG–NHS. The solution was lyophilized after filtering through a 0.45 μm syringe filter. The freeze-dried powder (2 mg) was dissolved in the deuterated (d)-chloroform (CDCl3, 1 mL) and analyzed by the 1H NMR (Bruker, AV III 400 mHz).
1, mol/mol) was added to the above solution and the reaction was carried out under the nitrogen gas for 12 h at room temperature. The reaction mixture was dialyzed with dialysis membranes with a molecular weight cut-off of 5 kDa against deionized water for 72 h to remove the unreacted mPEG–NHS. The solution was lyophilized after filtering through a 0.45 μm syringe filter. The freeze-dried powder (2 mg) was dissolved in the deuterated (d)-chloroform (CDCl3, 1 mL) and analyzed by the 1H NMR (Bruker, AV III 400 mHz).
2.3. Synthesis of PEG–GLY–RES
PEG (MW 2000, 1 mmol) was dissolved in 45 mL of DMF. The solution was stirred for 5 min followed by drop-wise addition of a solution of succinic anhydride (2.3 mmol) and sodium hydride (1.04 mmol) in 5 mL of DMF with agitation. The reaction mixture was gently stirred for 6 h at 65 °C and then evaporated under vacuum to remove the solvent. The residue was then dissolved in 60 mL of a saturated NaHCO3 aqueous solution and extracted by ethyl acetate. The aqueous phase was cooled on ice and pH-adjusted with a dilute HCl aqueous solution to 2–3. Next, the mixture was extracted by CH2Cl2 for three times and the organic layer was separated and washed off with saturated brine, dried by MgSO4 overnight. The filtrate was condensed under vacuum and precipitated with anhydrous ether.PEG succinic acid (0.5 mmol) was dissolved in 20 mL of CH2Cl2 in an ice bath. N-Hydroxysuccinimide (NHS, 2.1 mmol) and N,N-dicyclohexyl carbon imide (DCC, 1.5 mmol) were added into the solvent above. The mixture was stirred for 4 h at room temperature. Glycine (2.4 mmol) in saturated NaHCO3 solution (5 mL) was added into the mixture for the following reaction. After overnight stirring, the solution was dialyzed against water for 72 h in a dialysis bag (MWCO 1000). Finally, the specimens were lyophilized in a freeze-dryer (Lyo-0.5, Tofflon) for 48 h.
PEG glycine derivatives (1 mmol) was dissolved in 50 mL of DMF. DCC (2 mmol), DMAP (1 mmol) and RES (2.19 mmol) were added into solution above. The reaction mixture was stirred for 24 h at 25 °C in the dark. The solution was dialyzed against water for 72 h in a dialysis bag (MWCO 1000). Finally, the specimens were lyophilized in a freeze-dryer (Lyo-0.5, Tofflon) for 48 h. The content of RES was analyzed by the 1H NMR.
2.4. Preparation of the drug-loaded polymeric blends
To prepare the blends (PEG–GLY–RES/mPEG–PHIS), a dialysis method was used. First, 5 mg of mPEG–PHIS was dissolved in 2 mL mixed solvent of H2O and DMSO (1![[thin space (1/6-em)]](https://www.rsc.org/images/entities/char_2009.gif) :
:![[thin space (1/6-em)]](https://www.rsc.org/images/entities/char_2009.gif) 1, v/v), a small amount of 0.1 M acetic acid was added to make sure mPEG–PHIS dissolve completely, and then mixed with a certain amount of PEG–GLY–RES by sonication in the ice-water bath for 30 min. The resulting solution was transferred into dialysis membranes with a molecular weight cut-off of 3.5 kDa at 4 °C and then put into another dialysis membrane (MWCO 12
1, v/v), a small amount of 0.1 M acetic acid was added to make sure mPEG–PHIS dissolve completely, and then mixed with a certain amount of PEG–GLY–RES by sonication in the ice-water bath for 30 min. The resulting solution was transferred into dialysis membranes with a molecular weight cut-off of 3.5 kDa at 4 °C and then put into another dialysis membrane (MWCO 12![[thin space (1/6-em)]](https://www.rsc.org/images/entities/char_2009.gif) 000–14
000–14![[thin space (1/6-em)]](https://www.rsc.org/images/entities/char_2009.gif) 000) at room temperature to be dialyzed against 10 mM PBS, pH 7.6. The outer phase was replaced with fresh buffer solution at 1, 2, 4, 8, and 12 h. After 24 h, the polymers inside the membrane were self-assembled into blends. The solution was subsequently lyophilized after filtering through a 800 nm syringe filter. The proportion of blends was calculated by using 1H NMR test method.
000) at room temperature to be dialyzed against 10 mM PBS, pH 7.6. The outer phase was replaced with fresh buffer solution at 1, 2, 4, 8, and 12 h. After 24 h, the polymers inside the membrane were self-assembled into blends. The solution was subsequently lyophilized after filtering through a 800 nm syringe filter. The proportion of blends was calculated by using 1H NMR test method.
To obtain drug-loaded blends, DOX (5 mg mL−1) and a certain amount PEG–GLY–RES were added into 20 mL of distilled water; meanwhile DOX (5 mg mL−1) was added to the above mPEG–PHIS in mixed solvent (DMSO/H2O, 1![[thin space (1/6-em)]](https://www.rsc.org/images/entities/char_2009.gif) :
:![[thin space (1/6-em)]](https://www.rsc.org/images/entities/char_2009.gif) 1, v/v) and then added into PEG–GLY–RES solution by the ultrasonication in the ice-water bath for 15 min and dialyzed against 10 mM PBS, pH 7.6, at room temperature for 24 h. The final blends were ready to use after filtration using 800 nm syringe filter.
1, v/v) and then added into PEG–GLY–RES solution by the ultrasonication in the ice-water bath for 15 min and dialyzed against 10 mM PBS, pH 7.6, at room temperature for 24 h. The final blends were ready to use after filtration using 800 nm syringe filter.
To measure DOX loading content and efficiency, the blends solution was diluted with acetonitrile prior to determination and the solution was assayed by UV-visible spectrophotometry (UV-2600, Shimadzu, Japan) at 480 nm. A drug-free copolymer acetonitrile solution was used as blank. The drug loading content (DLC%) and efficiency (DLE%) were calculated by the following equation:
2.5. Characterization of polymeric blends
NMR spectroscopy was performed on Bruker AV III 400 NMR spectrometer using the deuterated solvent as reference and a sample concentration of ca. 20 mg mL−1. The particle size and zeta potential of the prepared blends at different pH were measured in triplicate by dynamic light scattering (DLS) using a Malvern Zetasizer (Nano ZS-90, Malvern, UK) at 25 °C with 90° scattering angle. The pH was adjusted by 0.1 M HCl. Moreover, the morphology was observed by scanning electron microscopy (SEM, JSM-7800F, Japan) at an accelerating voltage of 10 kV and atomic force microscope (AFM, Nano Scope IIIa, Veeco, USA).2.6. In vitro drug release studies
The release profile of DOX and RES from blends was evaluated according to a dialysis method. Drug-loaded blends were placed in a mini dialysis kit (molecular cut-off: 3.5 kDa) and placed into a sealed tube containing 30 mL of phosphate buffer saline (PBS, pH 7.4, 6.5, 5.5) as release media. The system was maintained at 37.0 ± 0.5 °C with stirring rate of 100 rpm. The release media (3 mL) was sampled at predetermined time intervals and replaced with equal volume of fresh medium. The samples were analyzed for DOX and RES content by UV-visible spectrophotometry at 480 nm and 306 nm, respectively.2.7. Cytotoxicity assay
In this study, HeLa and MCF-7 cell lines were used. Cells were seeded in a 96-well bottom plate at a density of 4000 cells per well and incubated at 37 °C in a humidified atmosphere with 5% CO2 for 24 h. The medium was then replaced with 20 μL of medium containing drug-loaded blends. Control wells were treated with equivalent volume of drug free media. The cells were incubated at 37 °C for 72 h. After incubation, wells were rinsed with PBS, and then MTT (5 mg mL−1) solution was added to each well and the plate was incubated for 4 h, allowing the viable cells to reduce the yellow MTT into dark-blue formazan crystals, which were dissolved in 150 μL of dimethylsulphoxide (DMSO). The absorbance of individual wells was measured at 570 nm by a microplate reader (Thermo fisher, USA). All the results obtained from both cytotoxicity assays were confirmed by repeating the experiment on three independent occasions and testing in triplicate each time.2.8. Cellular uptake
To evaluate the intracellular behavior of blends, CLSM was used to examine the intracellular distribution of DOX. HeLa cells were seeded on slides on a 24-well plates at a density of 5.0 × 10⁴ cells per well in 1 mL of complete DMEM containing 10% FBS. The cells were cultured for 24 h at 37 °C in 5% CO2 atmosphere. The cells were then incubated with drug loaded blends at a final DOX concentration of 20 μg mL−1 in PBS (pH 7.4) for 4, 12 or 24 h at 37 °C. At each predetermined time, the culture media was subsequently removed and cells were washed with PBS (2 min × 3) to remove drug loaded blends that were not ingested by the cells. Therefore, the cells were fixed by 4% (w/v) polyoxymethylene aqueous solution for 10 min at room temperature. The slides were then rinsed with PBS (5 min × 3). Finally, the cells were stained with DAPI (5 μg mL−1 in PBS) at 37 °C for 8 min and the slides were rinsed with PBS (5 min × 3). The intracellular distribution of DOX was observed by a confocal laser scanning microscope (Leica TCS SP). DOX was excited at 488 nm with the emission at 575 nm.2.9. Evaluation of cellular uptake by FCM
Cellular uptake was quantitatively estimated by flow cytometry. HeLa cells were seeded in 6-well plates at a density of 1 × 10⁵ cells per well and cultured with 2 mL of DEME containing 10% FBS for 24 h at 37 °C in 5% CO2 atmosphere. Afterwards, the cells were incubated with blends in DMEM for 4, 12 or 24 h at 37 °C. At each predetermined time, the culture medium was removed and the cells were washed twice with PBS to remove drug loaded blends that were not ingested by the cells. The cells were detached using trypsin for 8 min, then terminated by complete DMEM containing 10% FBS. About 5 mL of PBS was added to each well and the cell suspension were centrifuged at 1500 rpm for 5 min. After removal of the supernatants, the cells were resuspended in 5 mL of PBS. The suspension were centrifuged again, and then the cells were suspended in 500 μL of PBS and filtered through a 40 μm nylon mesh to remove cell aggregates before measurements were made. The mean fluorescence intensity (MFI) of DOX in cells was analyzed by FCM with an excitation wavelength of 466 nm.2.10. CLSM observation of endocytosis inhibition
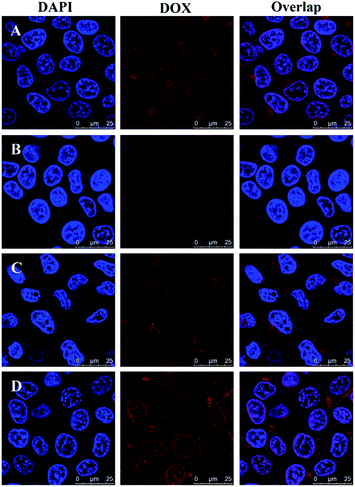
HeLa cells were seeded on slides on a 24-well plate at a density of 5.0 × 10⁴ cells per well in 1 mL of complete DMEM containing 10% FBS and cultured for 24 h at 37 °C in 5% CO2 atmosphere. The cells were prepared for 30 min with three different endocytosis inhibitor separately at concentration that were not toxic to the cells (5 mM methyl-β-cyclodextrin (MBCD), 0.45 M sucrose, or 5 μM cytochalasin D).37 Then, the drug-loaded blends were added at a final DOX concentration of 20 μg mL−1, followed by incubation for 4 h. The subsequent steps were similar to that described in Section 2.8. The group with test materials but without inhibitor treatment was used as a control.2.11. FCM analysis of endocytosis inhibition
HeLa cells were seeded in 6-well plates at a density of 1 × 10⁵ cells per well and cultured with 2 mL of DEME containing 10% FBS for 24 h at 37 °C in 5% CO2 atmosphere. To determine the effect of various inhibitors on blends uptake, the cells were pre-incubated for 30 min with three different endocytosis inhibitors separately at concentrations that were not toxic to the cells (5 mM methyl-β-cyclodextrin (MBCD), 0.45 M sucrose, or 5 μM cytochalasin D). Then, the drug loaded blends were added at a final DOX concentration of 20 μg mL−1, followed by incubation for 4 h. The subsequent steps were similar to that described in Section 2.9. The group without any treatment was used as a control in the FCM analysis.2.12. Statistical analysis
All the values were presented as mean ± standard deviation (SD) of at least three independent measurement. Statistical significance was tested by one-way ANOVA followed by a Student's t-test for multiple comparison tests. Difference characterized by *P < 0.05 were considered statistically significant. All statistical analysis was performed using SPSS, version 22.3. Results and discussion
3.1. Synthesis and characterization of PEG–GLY–RES and mPEG–PHIS
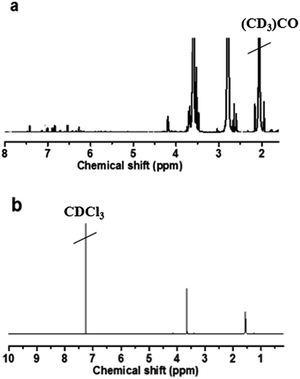
The chemical structure of each product was characterized by 1H NMR. PEG–GLY–RES was synthesized by the coupling of PEG with RES by using glycine as linking arms. As shown in Fig. 1a, peaks appeared at 3.62 (CH2 of PEG) and 4.16 (CH2 of glycine) ppm, which indicated the successful coupling of PEG and glycine. The peaks at 6.3–7.5 ppm indicated RES was conjugated to glycine. Through the NMR integration of RES-associated aromatic proton peaks at 6.3 ppm and PEG methylene proton at 3.6 ppm, the number of RES moieties linked to each PEG molecule was estimated to be 1.82 so that the content of RES was 17.7%. The mPEG–PHIS was synthesized by the coupling of mPEG–NHS and PHIS. The 1H NMR spectrum (CDCl3) of mPEG–PHIS (Fig. 1b) showed peaks at δ 1.52 ppm (CH of histidine) and δ 3.67 ppm (CH2 of PEG). The 1H NMR results confirmed the successful synthesis of PEG–GLY–RES and mPEG–PHIS.3.2. pH responsive behavior of polymeric blends
The fabrication of blends by mixing pH-sensitive polymer and pH-insensitive polymer may provide an innovative way of tuning the pH-sensitive of a mixed system. As was shown in our experiments with PEG–GLY–RES and PEG–PHIS mass ratios (3![[thin space (1/6-em)]](https://www.rsc.org/images/entities/char_2009.gif) :
:![[thin space (1/6-em)]](https://www.rsc.org/images/entities/char_2009.gif) 1, 1
1, 1![[thin space (1/6-em)]](https://www.rsc.org/images/entities/char_2009.gif) :
:![[thin space (1/6-em)]](https://www.rsc.org/images/entities/char_2009.gif) 1 and 1
1 and 1![[thin space (1/6-em)]](https://www.rsc.org/images/entities/char_2009.gif) :
:![[thin space (1/6-em)]](https://www.rsc.org/images/entities/char_2009.gif) 3) in Table 1, the size and zeta values of blends increased as pH decreased because of the imidazole ring of PHIS (pKa 6.0–6.5) being in a gradually deionized state in acid condition. The particle size and zeta of the blends were about 65 nm and +12 mV at pH 7.4. When pH drops, PHIS became partly protonated and its hydrophilicity increased. As pH went down to 5.5 (pH in endosomes), there was a significant size and zeta increase. Further protonated of PHIS made disruption of the blends core, which leaded to mPEG–PHIS dissociate from the blends. Thus, it made blends disintegrate into bigger formation. Meanwhile, the PHIS content seems to exert hardly any influence in zeta but has significant influence in size. The blends (RES/PHIS3) containing more PHIS showed more sensitive to stimulate response so that the size became larger. In contrary, the blends with high RES component wouldn't destabilize because the hydrophobic interactions between RES and histidine were still strong enough to maintain a homogenously-mixed core, so a little increase in the blends size takes place.
3) in Table 1, the size and zeta values of blends increased as pH decreased because of the imidazole ring of PHIS (pKa 6.0–6.5) being in a gradually deionized state in acid condition. The particle size and zeta of the blends were about 65 nm and +12 mV at pH 7.4. When pH drops, PHIS became partly protonated and its hydrophilicity increased. As pH went down to 5.5 (pH in endosomes), there was a significant size and zeta increase. Further protonated of PHIS made disruption of the blends core, which leaded to mPEG–PHIS dissociate from the blends. Thus, it made blends disintegrate into bigger formation. Meanwhile, the PHIS content seems to exert hardly any influence in zeta but has significant influence in size. The blends (RES/PHIS3) containing more PHIS showed more sensitive to stimulate response so that the size became larger. In contrary, the blends with high RES component wouldn't destabilize because the hydrophobic interactions between RES and histidine were still strong enough to maintain a homogenously-mixed core, so a little increase in the blends size takes place.
| Sample | Feed ratioa | Resultant ratiob | pH 7.4 | pH 6.5 | pH 5.5 | |||
|---|---|---|---|---|---|---|---|---|
| Size (nm) | Zeta (mV) | Size (nm) | Zeta (mV) | Size (nm) | Zeta (mV) | |||
| a Feed mass ratio of PEG–GLY–RES/PEG–PHIS.b Resultant mass ratio of PEG–GLY–RES/PEG–PHIS calculated by 1H NMR. | ||||||||
| RES/PHIS1 | 3/1 | 2.8/1 | 73 | 11 | 114 | 28 | 162 | 35 |
| RES/PHIS2 | 1/1 | 1.1/1 | 65 | 12 | 85 | 30 | 280 | 37 |
| RES/PHIS3 | 1/3 | 1/3.2 | 62 | 15 | 212 | 33 | 402 | 40 |
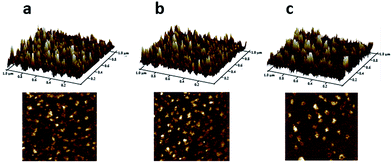
To further study the pH-sensitivity of blends, a visualized measurement by AFM was performed to monitor the morphological change of blends (RES/PHIS2) over time in different PBS solution. As shown in Fig. 2a, blends maintained structural integrity in pH 7.4 buffer solution, and there was no significant change in particle size for 2 h. With the decreasing of pH values to pH 6.5, there was no obviously change in size and morphology of RES blends. However, blends incubated in pH 5.5 increased in size over time. The obvious change of morphology in different PBS buffer solution was consistence with the result that was measured by DLS (Table 1). This result suggests that the RES blends with suitable proportions (PEG–GLY–RES![[thin space (1/6-em)]](https://www.rsc.org/images/entities/char_2009.gif) :
:![[thin space (1/6-em)]](https://www.rsc.org/images/entities/char_2009.gif) mPEG–PHIS = 1
mPEG–PHIS = 1![[thin space (1/6-em)]](https://www.rsc.org/images/entities/char_2009.gif) :
:![[thin space (1/6-em)]](https://www.rsc.org/images/entities/char_2009.gif) 1) could be stable at tumor pHe and be endocytosed as the nanoparticle entity.
1) could be stable at tumor pHe and be endocytosed as the nanoparticle entity.
3.3. Formation of drug-loaded polymeric blends
The effect of mass ratio of PEG–GLY–RES and mPEG–PHIS on drug loading efficiency was investigated and listed in Table 2. According to 1H NMR analysis (Fig. 1a), the RES content in PEG–GLY–RES was 17.7% so that the DLC of RES in the blends was calculated by the ratio of RES content in the total blends. Apparently, RES content was the highest in RES/PHIS1. The DLC and DLE of DOX mainly depended on the charge and hydrophobic effect of blends. With the high content of mPEG–PHIS, PHIS provided a strong positive charge so that two positively charged molecules (PHIS and DOX) are repelled by each other resulting in low content of DOX. As a result, the DLC and DLE values of DOX from RES/PHIS3 were 7.9% and 57%, which were lower than that of RES/PHIS1 and RES/PHIS2. On the other hand, it is difficult to form effective hydrophobic core for encapsulating drugs without enough contents of PEG–PHIS, which leads to low DLC and DLE of DOX from RES/PHIS1. Meanwhile, the low content of RES would also have an undesirable effect on the anticancer activity. Thinking about the contents of RES and DOX, RES/PHIS2 was used as the optimal blends in the further experiments.| Sample | Feed ratioa | Resultant ratiob | Drug loading content (%) | Drug loading efficiency (%) | |
|---|---|---|---|---|---|
| RES | DOX | DOX | |||
| a Feed mass ratio of PEG–GLY–RES/PEG–PHIS.b Resultant mass ratio of PEG–GLY–RES/PEG–PHIS calculated by 1H NMR. | |||||
| RES/PHIS1 | 3/1 | 2.8/1 | 13.0 | 8.9 | 65 |
| RES/PHIS2 | 1/1 | 1.1/1 | 9.3 | 12.0 | 83 |
| RES/PHIS3 | 1/3 | 1/3.2 | 4.2 | 7.9 | 57 |
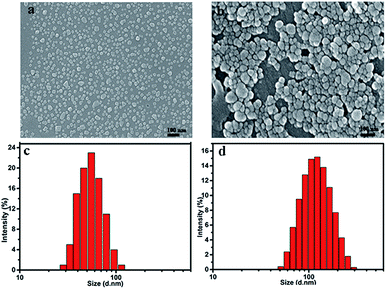
SEM image showed the RES/PHIS2 blends possessed an apparently spherical morphology with an average size of 45 nm. DLS test exhibited RES/PHIS2 blends had a narrow hydrodynamic size distribution with a mean size of 63 nm and PDI of 0.112. The drug loaded blends also possessed a uniformly spherical morphology with an average diameter of 80 nm, and their hydrodynamic size distribution was in the range of 60–120 nm with PDI of 0.181. The absolute particle size of the dry solid matrix structured nanoparticles observed in the SEM images was much smaller than that from the DLS results because of the collapse or shrinkage of the nanoparticles during the SEM sample preparation (Fig. 3).
3.4. In vitro drug release
According to our experimental design, the release behavior of RES and DOX from blends displayed marked difference. The DOX release was pH-dependent and controlled by the variable structure of blends. The DOX release rate can be altered rapidly via the deformation of the inner core induced by the changes in environmental conditions. As shown in Fig. 4a, DOX release exhibited a low efficacy release (40%) in the natural environment (pH 7.4), but much faster at either pH 6.5 or pH 5.5. The enhanced release in acidic solution (pH 5.5) culminated in 80% DOX elution after 12 h. As the poly-L-histidine was subject to acidic dissolution, the embedded DOX molecules were rapidly released owing to the core of blends gradually collapsed. In contrast, RES even exhibited an almost 35% release and displayed no obvious difference release in all pH buffers. Actually, the RES release is a two-stage process. The release of RES was not only dependent on the ester hydrolysis, but also affected by the blends. In the beginning, RES was firstly released by hydrolysis from PEG–GLY–RES. Then, the structure of blends also have effect on the release of RES just like DOX release, which was caused by RES being hydrophobic segment of PEG–GLY–RES so that encapsulated in the inner of blends. In short, the first step that RES hydrolysis could be accelerated in basic pH, and the second step that RES release from blends could be accelerated in acid pH. During to the two influence, the release of RES seems to be independent from the pH. Herein, it was also noted that as compared to DOX rapidly released in acidic solution, the RES continued to slow release. More importantly, the drug loaded blends had capacity to provide the controlled, sequential release of multiple drugs by different styles. In the system of drug loaded blends, DOX could have a rapid and target treatment effect while RES could achieve long-term and sustained treatment. Rather than using unaltered drug loaded ways, drug resistance could potentially overcome by dual drug loaded blends, which could help to restore the intracellular drug levels and induce cell apoptosis.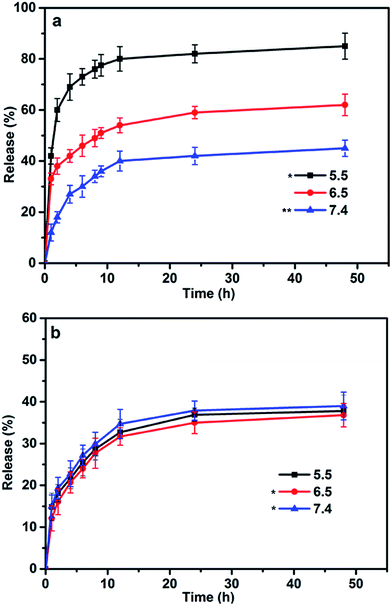 | ||
| Fig. 4 In vitro release profiles of DOX (a) and RES (b) from drug loaded-blends at different pH (7.4, 6.5, 5.5). Data represented as mean ± SD (n = 3).*P < 0.05, **P < 0.01. | ||
3.5. Cell toxicity
The overall cytotoxicity of drug loaded blends was evaluated using MTT assays in HeLa and MCF-7 cancer cell lines. As depicted in Fig. 5a and b, mPEG–PHIS showed almost no cytotoxicity to both HeLa and MCF-7 cancer cells, revealing remarkable safety and biocompatibility. Blends showed dose-dependent cytotoxicity to cancer cells, and the cell viability was 66% and 56% against HeLa and MCF-7 cells at dose of 900 μg mL−1. PEG–GLY–RES showed more cytotoxicity than blends because of high content of RES. The result indicated that PEG–GLY–RES provided anticancer activity in the blends and would be served as a component of combination therapy.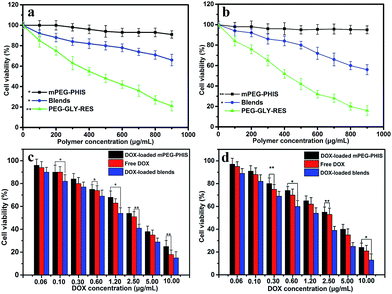 | ||
| Fig. 5 MTT results of blends, free DOX and drug-loaded blends against HeLa (a and c) and MCF-7 (b and d). Data represented as mean ± SD (n = 3).*P < 0.05, **P < 0.01. | ||
As shown in Fig. 5c and d, the significant proliferation inhibition effect was observed when the cells were treated with drug-loaded blends. The free DOX was used as control. The half maximal inhibitor concentration (IC50) was 2.4 μg mL−1 against HeLa cells for free DOX, and that of DOX loaded PEG–PHIS was 3.1 μg mL−1. The IC50 of drug loaded PEG–PHIS was higher than that of free DOX, which due to the higher and nonspecific cellular uptake of free DOX. In addition, DOX is a small molecule and hydrophilic, it is internalized in the cells easily and directly via the pinocytosis process.38 As expected, drug-loaded blends showed higher cytotoxicity than free DOX and DOX-loaded PEG–PHIS in all the doses tested in HeLa and MCF-7 cells. The IC50 of DOX-loaded blends was measured as 1.4 μg mL−1 against HeLa cells. This result indicated PEG–GLY–RES caused an increase in cytotoxicity. Similar results were observed when MCF-7 cells incubated with drugs. This finding is in agreement with the above results that RES blends formed nanoparticles severed as a carrier to delivery DOX into the cells, producing additive or synergistic anticancer effects.
3.6. Cellular uptake
To verify intracellular drug release, drug-loaded blends were monitored using CLSM after treatment with HeLa cells for 4, 12 and 24 h. As shown in Fig. 6, the blends showed a clearly time-dependent DOX accumulation in the nucleus, as observed by the red fluorescence localized in endosome/lysosome compartments after 4 h incubation and following colocalization of red fluorescence with that from DAPI after 12 and 24 h incubation. The intracellular drug release against HeLa cells incubated at different time was further studied by FCM in Fig. 7. The result was consistent with the CLSM outcomes. The fluorescence intensity of DOX increased with time in blends-treated cells. After incubated for 4 h, the MFI (Mean Fluorescence Intensity) of cells treated with drug-loaded blends was 9.24, which was weaker than that incubated for 12 h and 24 h. This indicates that the effective endosomal/lysosomal escape of the blends with incubation continues. The pH-sensitive blends based on PHIS have been previously reported to induce the endosomal/lysosomal escape and delivery drug into cytoplasm.39 The endosomal/lysosomal escape was probably attributed to the proton sponge effect caused by the PHIS block protonation in the acidic compartments of endosome or lysosome, leading to the endosome osmotic swelling, disruption of the endosomal/lysosomal membrane and cytoplasmic release of incorporated drug.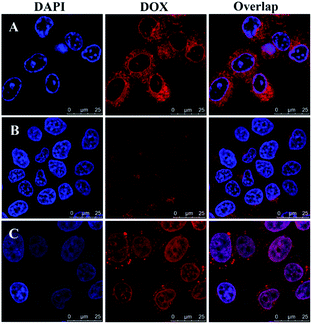 | ||
| Fig. 6 Confocal laser scanning microscopy of HeLa cells after treatment with drug-loaded blends at 37 °C for 4 h (A), 12 h (B), or 24 h (C). DOX dosage was 20 μg mL−1. Scale bar is 25 μm. | ||
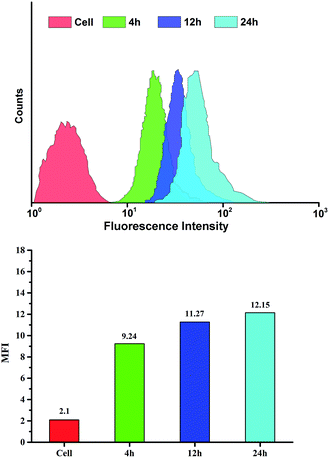 | ||
| Fig. 7 Flow cytometry analyse of HeLa cells incubated with drug-loaded blends at 37 °C for 4, 12 or 24 h. DOX dosage was 20 μg mL−1. | ||
3.7. Endocytosis inhibition
Given the cell uptake behaviors of blends, the endocytosis pathway of blends needs to be determined. Endocytosis is a specialized active cell transport mechanism of internalizing macromolecules, particles, and small molecules.40 The main endocytic pathways for macromolecules are macropinocytosis, clathrin-mediated endocytosis, and caveolae-mediated endocytosis. Macropinocytosis is an efficient pathway for the nonselective endocytosis of large-sized particles a process, which involves the formation of large vesicles by the closure of ruffling membrane domain.41 Clathrin-mediated endocytosis is the most prominent one for cellular entry and initiated by the formation of endosomes.42 Caveolae-mediated endocytosis always do not significantly contribute to constitutive endocytosis, and it occurs through a cholesterol sensitive route wherein caveolar vesicles are formed and fused with caveosomes.43In this study, we investigated the internalization pathways of blends using three different types of endocytosis inhibitor. We used 5 mM MBCD to inhibit caveolae-mediated endocytosis, 0.45 M hypertonic sucrose to inhibit clathrin-mediated endocytosis, and 5 mM cytochalasin D to inhibit macropinocytosis. The experiments were performed on HeLa cells using CLSM and FCM after incubation with drug-loaded blends with or without endocytosis inhibitors for 4 h.
As shown in Fig. 8, the DOX fluorescence of cells treated with cytochalasin D and sucrose were weaker than that of cells incubated without inhibitor, especially obviously for the cells cultured with cytochalasin D. Meanwhile, the DOX fluorescence intensity of cells in the presence of MBCD was similar to that of cells treated without inhibitor, indicating that blends entered the cells by macropinocytosis and clathrin-mediated endocytosis. However, the most prominent pathway was the macropinocytosis.
FCM result was consistent with CLSM observation. Fig. 9 showed the mean DOX fluorescence intensity in HeLa cells. The entry of blends was blocked in the presence of hypertonic sucrose and cytochalasin D, but little affected by MBCD. When treated with hypertonic sucrose, the cellular uptake efficiencies of blends decreased to 74%. However, after treatment with cytochalasin D, the cellular uptake efficiencies significantly decreased to 66%. Although MBCD had some effect on blends uptake, this effect was much less pronounced than that of hypertonic sucrose and cytochalasin D. The inhibition study showed that blends entered HeLa cells by clathrin-mediated endocytosis and macropinocytosis. The highest inhibition was observed with cytochalasin D, indicating that the most prominent pathway for micelle uptake was macropinocytosis.
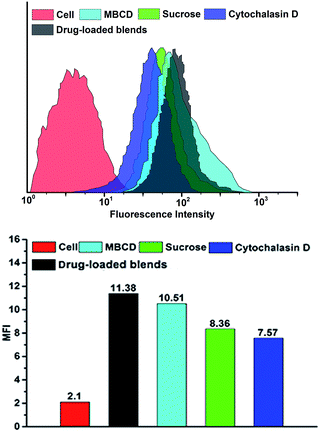 | ||
| Fig. 9 Flow cytometry analyse of HeLa cells incubated with drug-loaded blends containing different endocytosis inhibitor at 37 °C. DOX dosage was 20 μg mL−1. | ||
4. Conclusion
In this work, pH-responsive polymeric blends were prepared for co-delivering RES and DOX to overcome drug resistance and side effects of DOX. As a result of the pH-triggered structural variation, the release of loaded drug was apparently accelerated. An investigation of the MTT assays showed drug-loaded blends had higher cytotoxicity, suggesting a synergistic effect between the DOX and RES blends in vitro. Confocal laser scanning microscopy observation and flow cytometry analyses indicated that drug-loaded blends were efficiently internalized into HeLa cells, released DOX into the cytoplasm, and entered the nuclei. Endocytosis inhibition results indicated that RES blends entered HeLa cells mainly through the clathrin-mediated endocytosis and macropinocytosis. To summarize, we have developed a combined anticancer therapeutics using the RES blends as bioactive nanocarriers, which may open a new avenue for combined cancer therapy.Acknowledgements
This work was supported by National Key Basic Research Program of China (2015CB932100), Program for New Century Excellent Talents University of China (NCET-12-0760), and National “863” Program of China (No. 2013AA032201).Notes and references
- M. Jang, L. Cai, G. O. Undeani, K. V. Slowing, C. F. Thomas, C. W. Beecher, H. H. Fong, N. R. Farnsworth, A. D. Kinghorn, R. G. Mehta, R. C. Moon and J. Pezzuto, Science, 1997, 275, 218–220 CrossRef CAS PubMed.
- A. Mattarei, M. Azzolini, M. Carraro, N. Sassi, M. Zoratti, C. Paradisi and L. Biasutto, Mol. Pharmaceutics, 2013, 10, 2781–2792 CrossRef CAS PubMed.
- Q. S. Tang, G. W. Li, X. N. Wei, J. Zhang, J. F. Chiu, D. Hase- nmayer, D. Z. Zhang and H. Zhang, Cancer Lett., 2013, 336, 325–337 CrossRef CAS PubMed.
- T. Shen, X. N. Wang and H. X. Lou, Nat. Prod. Rep., 2009, 26, 916–935 RSC.
- K. B. Koronowski, K. R. Dave, I. Saul, V. Camarena, J. W. Thompson, J. T. Neumann, J. I. Young and M. A. Perez-Pinzon, Stroke, 2015, 8, 2293–2298 CrossRef PubMed.
- J. K. Kundu and Y. J. Surh, Cancer Lett., 2008, 269, 243 CrossRef CAS PubMed.
- N. N. Xiao, Biomol. Ther., 2015, 4, 374–378 CrossRef PubMed.
- R. Q. Lu and G. Serrero, Cell Physiol., 1999, 179, 297–304 CrossRef CAS.
- G. Murtaza, U. Latif, M. Najam-Ul-Haq, A. Sajjad, S. Karim and M. Akhtar, J. Food Drug Anal., 2013, 21, 1–12 CrossRef CAS.
- A. Amir, J. C. Chaumeil, S. Sfar and C. Charrueau, J. Controlled Release, 2012, 158, 182–193 CrossRef PubMed.
- T. Walle, F. Hsieh, M. H. DeLegge, J. E. Oatis and U. K. Walle, Drug Metab. Dispos., 2004, 32, 1377–1382 CrossRef CAS PubMed.
- E. Wenzel and V. Somoza, Mol. Nutr. Food Res., 2005, 49, 472–481 CAS.
- R. L. Momparler, M. Karon, S. E. Siegel and F. Avila, Cancer Res., 1976, 36, 2891–2895 CAS.
- T. M. Sun, Y. C. Wang, F. Wang, J. Z. Du, C. Q. Mao and C. Y. Sun, Biomaterials, 2014, 35, 836–845 CrossRef CAS PubMed.
- B. X. Pang, X. H. Qiao, L. Janssen, A. Velds, T. Groothuis and R. Kerkhoven, Nat. Commun., 2013, 4(5), 54–56 Search PubMed.
- A. Bodley, L. F. Liu, M. Israel, R. Seshadri, Y. Koseki and F. C. Giuliani, Cancer Res., 1989, 59, 5969–5978 Search PubMed.
- L. Dong, S. H. Xia, K. Wu, Z. Huang, H. Chen, J. N. Cheng and J. F. Zhang, Biomaterials, 2010, 31, 6309–6316 CrossRef CAS PubMed.
- A. C. Childs, S. L. Phaneuf, A. J. Dirks, T. Phillips and C. Leeuwenburgh, Cancer Res., 2002, 62, 4592–4598 CAS.
- C. Prahalathan, E. Selvakumar and P. Varalakshmi, Reprod. Toxicol., 2006, 21, 54–59 CrossRef CAS PubMed.
- H. J. Broxterman, K. J. Gotink and H. M. Verheul, Drug Resist. Updates, 2009, 12, 114–126 CrossRef CAS PubMed.
- M. Y. Hu, J. F. Zhu and L. Y. Qiu, RSC Adv., 2014, 4, 64151–64161 RSC.
- H. J. Zhu, H. B. Chen, X. W. Zeng, Z. Y. Wang, X. D. Zhang, Y. P. Wu, Y. F. Gao, J. X. Zhang, K. W. Liu, R. Y. Liu, L. T. Cai, L. Mei and S. S. Feng, Biomaterials, 2014, 35, 2391–4200 CrossRef CAS PubMed.
- V. T. DeVita Jr, R. C. Young and G. P. Canellos, Cancer, 1975, 35, 98–110 CrossRef CAS.
- M. A. Shah and G. K. Schwartz, Drug Resist. Updates, 2000, 3, 335–356 CrossRef CAS PubMed.
- M. Ferrari, Nat. Rev. Cancer, 2005, 5, 161–171 CrossRef CAS PubMed.
- R. Chatthongpisut, S. J. Schwartz and J. Yongsawatdigul, Food Chem., 2015, 188, 99–105 CrossRef CAS PubMed.
- J. Y. Chan, M. S. Phoo, M. V. Clement, S. Pervaiz and S. C. Lee, Cancer Biol. Ther., 2008, 7, 1305–1312 CrossRef CAS PubMed.
- G. Gatouillat, E. Balasse, D. Joseph-Pietras, H. Morjani and C. Madoulet, J. Cell. Biochem., 2010, 110, 893–902 CrossRef CAS PubMed.
- B. Cota, L. J. Carlson, D. A. Rao and A. W. G. Alani, J. Controlled Release, 2015, 213, 128–133 CrossRef PubMed.
- X. Guo, C. L. Shi, G. Yang, J. Wang, Z. H. Cai and S. B. Zhou, Chem. Mater., 2014, 26, 4405–4418 CrossRef CAS.
- J. C. Leroux, Adv. Drug Delivery Rev., 2004, 56, 925–926 CrossRef.
- K. C. R. Bahadur, B. Thapa and P. Xu, Mol. Pharm., 2012, 9, 2719–2729 CrossRef PubMed.
- Y. Liu, J. B. Li, J. Ren, C. Lin and J. Z. Leng, Mater. Lett., 2014, 127, 8–11 CrossRef CAS.
- S. Aryal, C. M. J. Hu and L. Zhang, ACS Nano, 2009, 4, 251–258 CrossRef PubMed.
- J. Zhang, R. Chen and X. Fang, Nano Res., 2015, 8, 201–218 CrossRef CAS.
- H. Wu, L. Zhu and V. P. Torchilin, Biomaterials, 2013, 34, 1213–1222 CrossRef CAS PubMed.
- G. Sahay, E. V. Batrakova and A. V. Kabanov, Bioconjugate Chem., 2008, 19, 2023–2029 CrossRef CAS PubMed.
- L. B. Luo, J. Tam, D. Maysinger and A. Eisenberg, Bioconjugate Chem., 2002, 13, 1259–1265 CrossRef CAS PubMed.
- L. T. Thuy, S. Mallick and J. S. Choi, Int. J. Pharm., 2015, 492, 233–243 CrossRef CAS PubMed.
- S. Sema, S. Sharon, M. Alexander, W. Renee, K. Maria, B. Volga and P. D. Thomas, Biomater. Sci., 2015, 3, 323–335 RSC.
- M. A. Soraj, L. He, K. Peynshaert, J. Cousaert, D. Vercauteren, K. Braeckmans, S. C. De Smedt and A. T. Jones, J. Controlled Release, 2012, 161, 132–141 CrossRef PubMed.
- S. H. Guo, X. H. Zhang, M. Zheng, X. W. Zhang, C. C. Min, Z. T. Wang, S. H. Cheon, M. H. Oak, S. Y. Nah and K. M. Kim, Biochim. Biophys. Acta, 2015, 10, 2101–2110 CrossRef PubMed.
- J. Russier, M. Grillaud and A. Bianco, Bioconjugate Chem., 2015, 26, 1484–1493 CrossRef CAS PubMed.
| This journal is © The Royal Society of Chemistry 2016 |

