 Open Access Article
On the synthesis and characterisation of luminescent hybrid particles: Mo6 metal cluster complex/SiO2†
Yuri A. Vorotnikovab,
Olga A. Efremova*c,
Natalya A. Vorotnikovaab,
Konstantin A. Brylevabd,
Mariya V. Edelevabe,
Alphiya R. Tsygankovaad,
Anton I. Smolentsevad,
Noboru Kitamuraf,
Yuri V. Mironovad and
Michael A. Shestopalov *abd
*abd
aNikolaev Institute of Inorganic Chemistry SB RAS, 3 Acad. Lavrentiev Ave., 630090 Novosibirsk, Russian Federation. E-mail: shtopy@niic.nsc.ru; Fax: +7-383-330-94-89; Tel: +7-383-330-92-53
bScientific Institute of Clinical and Experimental Lymphology, 2 Timakova St., 630060 Novosibirsk, Russian Federation
cDepartment of Chemistry, University of Hull, Cottingham Road, Hull, HU6 7RX, UK. E-mail: o.efremova@hull.ac.uk; Tel: +44 (0)1482 465417
dNovosibirsk State University, 2 Pirogova st., 630090 Novosibirsk, Russian Federation
eNovosibirsk Institute of Organic Chemistry SB RAS, 9 Acad. Lavrentiev ave., 630090 Novosibirsk, Russian Federation
fDepartment of Chemistry, Faculty of Science, Hokkaido University, 060-0810 Sapporo, Japan
First published on 20th April 2016
Abstract
Photoluminescent silica-based materials are used in applications in photonics, sensing, and biological and medical sciences. Specifically, hybrid particles based on silica doped by photoluminescent octahedral molybdenum metal cluster complexes are inexpensive and readily available via the Stöber process and thus are promising materials for diverse applications. We evaluated design of photoluminescent materials based on silica and {Mo6X8}4+ clusters (where X = Cl, Br, I), including how synthesis conditions (chemical composition of metal cluster precursors (Bu4N)2[{Mo6X8}(NO3)6], loading of the precursor and presence of a surfactant) influence key parameters of the final materials, such as phase composition, size and morphology of the particles and photophysical characteristics. Our study revealed that hydrolysis of the molybdenum cluster precursors during the Stöber process strongly affects both morphology and photophysical parameters of the materials, especially at high loadings. At relatively low loadings of the precursors, materials doped by {Mo6I8}4+ clusters demonstrated the most promising set of properties—the highest photoluminescence quantum yields and efficient singlet oxygen generation—while particle size and morphology remained the same as for undoped SiO2 materials.
1. Introduction
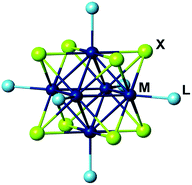
Hexanuclear molybdenum cluster complexes with the general formula [{Mo6X8}L6] (X = Cl, Br, or I; L = apical organic or inorganic ligands) (Fig. 1) offer an outstanding balance of photophysical and chemical properties that make them highly promising for applications in biomedical, sensing and optical technologies.1 These complexes demonstrate high chemical- and photo-stability of the cluster core {Mo6X8}4+ that are primarily responsible for their triplet excited-state photoluminescence (i.e., phosphorescence) with broad emission spectra extending in the red/near infra-red region (from ∼550 to >950 nm).2–10 The complexes are characterised by impressive photoluminescence quantum yields (PLQYs) for coordination compounds2,6 and can also act as powerful photosensitisers in generating singlet oxygen (1O2).6–9,11–14 Importantly, the photophysical properties of molybdenum metal cluster complexes are strongly dependent on the chemical environment of the cluster Mo6, that is, inner ligands X and apical ligands L.For any of the above applications, however, the molybdenum cluster complexes must be supported by a bespoke matrix. For example, to target biological applications, the matrix should offer biocompatibility, while for optical applications the matrix should be transparent.5,15–20 Silica is considered a universal matrix, as it can be used to target both biological21–25 and materials-based applications.26–29 Indeed, silica itself is a cheap, optically transparent, non-toxic and versatile material. It can be prepared with high specific surface area or be obtained in the form of nano/microparticles, surfaces or bulk.
In recent decades, several research efforts were devoted to synthesis of silica nanoparticles (SNPs), doped by molybdenum cluster compounds, such as Cs2[{Mo6X8}X6] (X = Cl, Br, I)30 and (Bu4N)2[{Mo6I8}(CF3COO)6]6 to target biological31 and optical applications.32 To incorporate hexamolybdenum cluster complexes into silica nanoparticles, they were added to a reaction mixture during the Stöber process (i.e., hydrolysis of tetraethoxysilane [TEOS] by ammonia solution) in a stabilised water-in-oil emulsion. Notably, Aubert et al. reported that apical ligands of [{Mo6Br8}Br6]2− were substituted during the hydrolysis of TEOS by either silanol (Si–O−) or hydroxo ligands.31 Despite the observed ability of molybdenum metal clusters, no studies were undertaken to establish (1) effects that ligand substitution or hydrolysis of the molybdenum cluster complexes during the Stöber process have on optical properties of the final material, especially photoluminescence quantum yields; (2) the highest loading of molybdenum metal cluster possible in SiO2; (3) how particle morphology is affected by doping with molybdenum cluster complexes; and (4) how particle size influences particle photophysical properties.
To answer these questions, we investigated in detail properties of silica microparticles (SMPs) that are realised when TEOS is hydrolysed by ammonia solution (Stöber process) in the presence of various quantities of molybdenum cluster complexes (Bu4N)2[{Mo6X8}(NO3)6] (where X is Cl (1), Br (2), or I (3)). 1–3 were selected due to the recognised ability of NO3− ligands to be easily substituted by other ligands, which likely results in covalent bonding between the molybdenum cluster core {Mo6X8}4+ and silica matrix. Specifically, we investigated morphology, structure, optical and physical properties of resultant materials using X-ray powder diffraction, electron microscopy techniques (including elemental mapping), photoluminescence spectroscopy, and elemental analysis. Finally, to assess the influence of particle size, we compared photophysical properties and singlet oxygen generation activity of SMPs with those of corresponding silica nanoparticles (SNPs), obtained via the Stöber process in water-in-oil emulsion.
2. Experimental section
2.1 Synthesis section
All reagents and solvents employed were commercially available and used as received without further purification. (Bu4N)2[{Mo6X8}(NO3)6], where X = Cl (1), Br (2), I (3), were prepared according to the described procedures.5,332.2 Analytical methods
The size and morphology of the nx@SiO2 micro- and nano-particles were characterized by scanning electron microscopy (SEM) using a JEOL JSM-5700 CarryScope microscope and by transmission electron microscopy (TEM) using a Libra 120 (Zeiss) TEM. Elemental maps in SMPs were recorded using the standard three-window technique described in Brydson, Electron Energy Loss Spectroscopy (Bios Scientific Publishers Ltd, 2001). Confocal imaging of SMPs was performed using a Zeiss LSM 780 NLO confocal microscope (Carl Zeiss Inc., Jena, Germany) based on an AxioObserver Z1 (Zeiss) microscope and equipped with a laser diode (405 nm) for fluorescence and with a APOCHROMAT 63×/1.4 Oil DIC LD Plan objective.The CHN elemental analyses were performed on a EuroVector EA3000 Elemental Analyser. Molybdenum content in samples was determined on a high-resolution spectrometer iCAP-6500 (Thermo Scientific) with a cyclone-type spray chamber and “SeaSpray” nebulizer. The spectra were obtained by axial plasma viewing. Standard operating conditions of the ICP-AES system follow: power = 1150 W, injector inner diameter = 3 mm, carrier argon flow = 0.7 L min−1, accessorial argon flow = 0.5 L min−1, cooling argon flow = 12 L min−1, number of parallel measurements = 3, and integration time = 5 s. Deionized water (R ≈ 18 MΩ) was used to prepare sample solutions. All chemical reagents were of analytical grade.
29Si CP-MAS solid-state NMR was recorded on the 500 MHz Bruker Advance II. The specific surface area of SMPs and SNPs was measured by a nitrogen cryoadsorption technique using Autosorb iQ (Quantachrome Instruments) at 77 K. The samples were first degassed in vacuum at 393 K overnight. N2 adsorption–desorption isotherms were measured within the range of relative pressures of 10−5 to 0.99 and calculated from the data obtained on the basis of the conventional BET model.
For emission measurements in solid state, powdered samples of compounds 1, 2 and 3, nx@SiO2 (both SMPs and SNPs) and An and B2 were placed between two non-fluorescent glass plates. The measurements were carried out at 298 K. The samples were excited by 355 nm laser pulses (6 ns duration, LOTIS TII, LS-2137/3). The corrected emission spectra were recorded on a red-light-sensitive multichannel photodetector (Hamamatsu Photonics, PMA-12). For emission decay measurements, the emission was analyzed by a streakscope system (Hamamatsu Photonics, C4334 and C5094). The emission quantum yields were determined by an Absolute Photo-Luminescence Quantum Yield Measurement System (Hamamatsu Photonics, C9920-03), which comprised an excitation Xenon light source (the excitation wavelength was 380 nm), an integrating sphere, and a red-sensitive multichannel photodetector (Hamamatsu Photonics, PMA-12).
3. Results and discussion
3.1 Synthesis
A range of molybdenum cluster-doped SMPs, nx@SiO2 (where n corresponds to complexes 1, 2, or 3; x is a loading of 1–3 in g per 1 g of final SiO2), were prepared by hydrolysis of TEOS with a 25% ammonia solution (i.e., by the Stöber process) in the presence of varying amounts of corresponding cluster complexes. Specifically, loadings of the cluster complexes (x) in the reaction mixture ranged from 0.0001 to 5 g per 1 g of resultant SiO2. However, in the case of cluster complex 1, the loading of the cluster was limited by x = 0.5. This is because 1x@SiO2 SMPs with x ≥ 0.5 had a grayish-blue colour, while the colour of other SMPs ranged from yellow to red solids depending on metal cluster loading.Several chemical processes and interactions relevant to formation of materials by the Stöber procedure in the presence of 1–3 should be considered:
To better understand the hydrolysis of 1–3 in an ammonia solution, we simulated the Stöber process conditions, but without TEOS in the reaction mixture. Specifically, we carried out the reactions of acetone solutions of 1–3 with an aqueous ammonia solution. After the reactants were mixed, we observed the quantitative formation of coloured precipitates. For further characterisation, the precipitates were isolated from the reaction mixtures after 12 h (labeled as precipitates An ), and after the complete evaporation of the solvents in air (labeled as precipitates Bn), where n relates to 1–3.
3.2 Materials composition and chemical structure
To establish whether some of the above processes and interactions really do take place in our system, we characterised both precipitates An and Bn and SMPs by a range of analytical methods. FTIR spectra of all obtained SMPs showed no vibration bands from both NO3− groups and tetrabutylammonium cations (see ESI, Fig. S1–S6†). Similarly, elemental (CHN) analyses did not detect any nitrogen and carbon in the prepared materials. FTIR spectra and CHN analyses of An precipitates also demonstrated the elimination of Bu4N+ cations and NO3− ligands in the reactions of 1–3 with ammonia solution. Together these observations strongly support the assumption that 1–3 were fully hydrolysed during the Stöber process and/or had bonded to the silica matrix.Hydrolysis of the starting cluster compounds via the simulated Stöber process was further confirmed by X-ray powder diffraction (XRPD) and thermogravimetric (TGA) analyses of precipitates An and Bn. The XRPD and TGA data for precipitates An and Bn are shown in ESI Fig. S7–S12.† The diffraction patterns of precipitates A1 and A2 have halo-like peaks with maxima at around 12.3 °C and 11.7 °C, respectively. The diffraction pattern of precipitate A3 also showed a halo pattern and several broadened peaks with sharp apexes at 11.4 °C, 12.2 and 13.4 °C, which could come from a phase with a low crystallinity. We found that these peaks coincided with peaks in the theoretical diffraction pattern of the [{Mo6I8}(H2O)2(OH)4]·2H2O (6·2H2O) phase (CSD-number 429142). A mass loss was observed in the TGA curves of precipitates An in the 60 °C to 200 °C temperature range. The mass loss correlates well with removal of two crystallisation and two coordinated water molecules from [{Mo6X8}(H2O)2(OH)4]·2H2O with the formation of the earlier described cluster compounds [{Mo6X8}(OH)4].36,37 Together these observations suggested that during the reaction of 1–3 with ammonia solution, we observe the formation of amorphous or lower crystallinity phases of [{Mo6X8}(H2O)2(OH)4]·2H2O (precipitates An).
The XRPD of precipitates Bn showed increased crystallinity in comparison with precipitates An. We consider this to be attributed to chemical ageing of the solids. Namely, in the case of precipitate B1, we found two weak peaks at 10.5 °C and 11.7 °C that corresponded to a theoretical diffraction pattern of the crystalline phase [{Mo6Cl8}(H2O)2(OH)4]·12H2O (4·12H2O)38 and a halo peak similar to precipitate A1. We also noticed some change in the colour of precipitate B1 associated with the formation of molybdenum blue species. The TGA confirmed that precipitate B1 still consisted mainly of amorphous 4·2H2O, while the content of 4·12H2O was below the detection limit of TGA.
The XRPD of precipitates B2 showed coexistence of two phases: amorphous and crystalline. The profile of the amorphous phase corresponded to that found in A2, while sharp peaks were assigned to formation of the crystalline [{Mo6Br8}(H2O)2(OH)4]·12H2O (5·12H2O), which is isostructural to 4·12H2O. Indeed, we found several crystals on vial walls that were suitable for X-ray structural analysis. Single-crystal XRD clearly confirmed that the crystalline phase in precipitate B2 corresponds to the proposed phase 5·12H2O (ESI, Table S1†). TGA of precipitate B2 showed the loss of six water molecules, which means that it consisted of a mechanical mixture of 3 equivalents of 5·2H2O and 2 equivalents of 5·12H2O.
XRPD of precipitates B3 showed a phase of high crystallinity with the pattern that coincided well with the theoretical diffraction pattern of 6·2H2O. TGA of precipitate B3 confirmed the composition of 6·2H2O. On the walls of the vial, we also found few crystals. Surprisingly, the crystal structure was that of 6·12H2O, which has a different X-ray powder pattern. Taking into account the TGA and XRPD data, we assumed that most of the precipitate B3 consisted of crystalline phase 6·2H2O with a minority admixture phase of crystalline 6·12H2O. Note that the content of the minor phase was below the detection limit of both TGA and XRPD methods.
Together the TGA and XRPD data of precipitates An and Bn suggest that hydrolysis of compounds 1–3 in ammonia solution occurs via the rapid formation of a metastable amorphous dihydrate phase. The ageing of these amorphous phases in aqueous media transforms them into more stable crystalline dodecahydrate or dihydrate phases.
In the powder diffraction patterns of neat SMPs and doped SMPs with x ≤ 0.1 (Fig. S13–S15†), the typical halo patterns of SiO2 glass at around 22 °C were observed.43,44 The increased cluster content above x = 0.1 in the particles prepared from 2 and 3 led to both the weakening of the halo peak and the appearance of the new reflection peaks, which corresponded to those found in diffraction patterns of precipitates A2 and B3, respectively. Namely, in the diffraction profile of 2x@SiO2, there was a broad halo peak around 11.7 °C, which narrowed with the increase in cluster loading of the SMPs. This peak was assigned to the formation of amorphous aquahydroxo complex 5·2H2O. In contrast to 2x@SiO2, the diffraction patterns of 3x@SiO2 (x ≥ 1) featured reflections of crystalline phase 6·2H2O (Fig. 2).
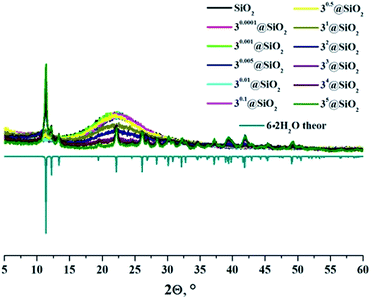 | ||
| Fig. 2 X-ray powder diffraction patterns of neat and cluster-doped SMPs and theoretical diffraction pattern of 6·2H2O. | ||
The selected area electron diffraction patterns of samples 3x@SiO2 (where x = 0.05, 0.5 and 5) further confirmed the amorphous state of the sample with low content of the cluster 3 (Fig. 3a), and the appearance of a crystalline phase in the samples with higher cluster content (Fig. 3b and c).
 | ||
| Fig. 3 Selected area electron diffraction patterns of samples 3x@SiO2 where x = 0.05 (a), 0.5 (b) and 5 (c). | ||
These observations signify that as metal-cluster complex loading increases above x = 0.1, the value z in the formula [{Mo6X8}(H2O)6−y−z(OH)y(OSi)z]4−y−z tends to 0.
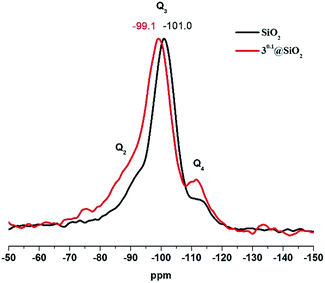
29Si CP MAS NMR of 30.1@SiO2, that is, the sample with the borderline content of the metal cluster complex, showed two noticeable changes in comparison to neat SiO2 SMPs (Fig. 4): deshielding of the Q3-type signal (i.e., Si–OH) by about 2 ppm and the increase in Q4/Q3 ratio. The change in the chemical environment of Si in the Q3-type can be explained by formation of hydrogen bonds between Si–OH and Mo–OH or Mo–OH2, while increased intensity of the Q4 signal is likely the result of Si–O–Mo bond formation, which is in agreement with earlier 29Si NMR data of doped silica materials.26–28
The UV/Vis diffuse reflectance spectra of SMPs (Fig. S16–S18†) displayed an enhanced optical absorption for cluster-doped particles in the visible region in comparison with neat SiO2 particles, due to the presence of molybdenum cluster complexes. This is in the agreement with the cluster-loading dependent colour of the samples. Note that in the spectra of both precipitate B1 and 1x@SiO2, where x ≥ 0.5, absorption in the red region (>600 nm) was also observed. This absorption is due to the formation of molybdenum blue species,45,46 as discussed above. The exact content (w/w) of molybdenum in SMPs was determined by ICP-AES analysis (see Fig. 5). The curves show the theoretical content calculated from the assumption that both cluster complexes 1–3 and TEOS are quantitatively hydrolysed to give [{Mo6X8}(H2O)2(OH)4]·2H2O and SiO2, respectively. The molybdenum contents in SMPs were found to be slightly lower than the theoretical ones. According to the TGA, this discrepancy is likely the result of 4–5% of water present in the samples (Fig. S19–S21†). The difference can also be the result of differences in hydrolysis kinetics of metal clusters and TEOS.
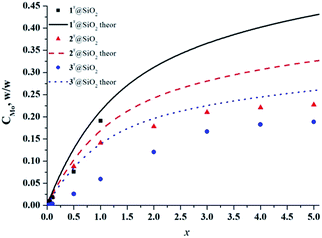 | ||
| Fig. 5 Content of molybdenum in nx@SiO2 determined by ICP-AES analysis versus loading of metal cluster in SMPs (x). | ||
3.3 Materials morphology
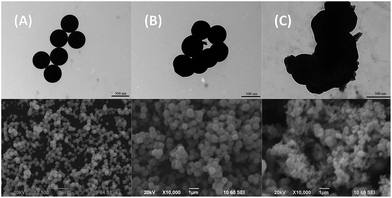
Recently, Aubert et al. studied the influence of cluster complex Cs2[{Mo6Br8}Br6] concentration in the reaction mixture on the size of obtained silica nanoparticles.31 They demonstrated that particle diameter increased with rising cluster complex concentration in the reaction mixture. However, they used only a maximum of 20 mg of Cs2[{Mo6Br8}Br6] per 1.5 mL of TEOS, which correlates with our sample 20.05@SiO2. In our research we wanted to understand what happens to particle shapes and morphology, when the loading of molybdenum cluster complexes is increased even more, that is, when formation of the phases of [{Mo6X8}(H2O)2(OH)4]·zH2O is apparent.The shapes and the morphology of all SMPs prepared here were characterised via TEM and the 3x@SiO2 series was also imaged by SEM (Fig. 6 and S22–S25†). The electron microscope images showed that both neat SiO2 and SMPs with metal cluster content up to x = 0.1 possessed spherical shapes with nearly equal sizes of 500 nm (Fig. 6A). However, the increasing molybdenum cluster loadings in the SMPs above x = 0.1 resulted in distortion of particle spherical shapes (Fig. 6B) until complete disappearance of sphericity in x ≥ 0.5 samples (Fig. 6C).
We also investigated the distribution of cluster complexes inside SMPs using electron energy-loss spectroscopy (EELS). Fig. S24† shows images of SMPs obtained via this technique, in which molybdenum atoms are depicted by red dots. The images demonstrate that molybdenum clusters are homogeneously distributed within the silica microbeads. Similarly, the confocal luminescence imaging of these SMPs (Fig. S26†) clearly showed that the emission from the molybdenum clusters was indeed uniformly distributed over all microparticles and they were localised within the microspheres.
3.4 Photophysical properties
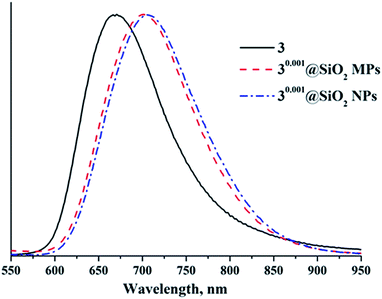
Since the apical nitrato ligands of cluster complexes 1–3 are substituted during the Stöber process, it is important to determine how the immobilisation affects photophysical properties of the initial cluster complex. Indeed, our recent work showed that photoluminescence properties of compounds 1–3 changed strongly (especially in 3), when they were incorporated into thiolated polystyrene microbeads. For example, incorporation of 3, the compound with the highest photoluminescence quantum yield (PLQY) for molybdenum clusters in a fully inorganic environment,5 led to slight broadening and red-shift of the luminescence spectrum and to an appreciable decrease of PLQY and emission lifetime values of the hybrid material. These changes were associated with the change in ligand environment around the {Mo6X8}4+ cluster core (i.e., substitution of six NO3− ligands by thiol groups in the polymer matrix). In addition, earlier works on the incorporation of Cs2[{Mo6X8}X6] and (Bu4N)2[{Mo6I8}(CF3CO2)6] into SiO2 demonstrated that emission spectra of the cluster doped-silica materials were somewhat shifted relative to those of starting cluster complexes. The reported emission lifetimes for these materials were shorter than those for starting complexes, while PLQYs were not reported.6,30,31Photoluminescence properties of SMPs were investigated on dry samples of nx@SiO2. Emission spectra of the SMPs are shown in Fig. 7 and S27–S29,† while emission maximum wavelengths (λem), PLQYs (Φem) and lifetimes (τem) are summarised in Table S2.† Photophysical characteristics (λem, τem, and Φem) of 1–3 are summarised in Table S3† for comparison. The data show that the photoluminescence properties of nx@SiO2 materials differ from those of starting compounds 1–3 (Fig. S30 and S31, Table S3†). Namely, the emission maxima showed bathochromic shifts of ∼60 nm for 1x@SiO2 and ∼85 nm for 2x@SiO2 and hypsochromic shift of ∼35 nm for 3x@SiO2 in comparison with corresponding starting complexes. Moreover, the increase in cluster loading of the SMPs independently on the cluster core composition led to the gradual bathochromic shift of the luminescence maxima (Table S3†). These shifts are due to changes in the apical ligand environment of the initial cluster complexes from (NO3)6 to (H2O)6−y−z(OH)y(OSi)z, where z is likely to depend on the metal cluster to TEOS ratio in the reaction mixture (i.e., the higher the ratio, the lower the z).
In addition to shifts in emission maxima, lifetimes and PLQYs were also significantly different. Similar to PLQY 3 versus that of 1 and 2, the PLQYs of 3x@SiO2 materials were significantly higher (up to 0.09) than that for any of the 1x@SiO2 and 2x@SiO2 SMPs (<0.01).
Detailed study of photophysical properties for a large series of 3x@SiO2 showed that the PLQYs appreciably decreased with an excessive increase in cluster loading of silica (Table S4†). Specifically, the materials 3x@SiO2, where x was in the 0.0002–0.002 range, showed the highest PLQY values up to 0.09, while further increase in cluster content led to the smooth decrease in PLQYs down to 0.01. Presumably, such a decrease in PLQYs is associated with formation of 6·2H2O crystallites in 3x@SiO2, when x ≥ 0.002. It is worth noting that PLQYs of 3x@SiO2, where x < 0.0002, also led to the decrease in PLQYs, probably due to insignificant quantities of cluster complexes.
To evaluate the influence of aquahydroxo complex formation in SMPs on the materials' photophysical characteristics, we also examined luminescence properties on precipitates A1–A3 and B2. Precipitates A1, A2 and B2 showed typical behaviour for octahedral molybdenum cluster complexes with broad emission bands, while precipitate A3 did not exhibit any luminescence at all (Fig. S32 and S33, Table S3†). The maximum wavelength emission of precipitates A1 and B1 were found to be ∼745 nm, while the PLQY was less than 0.01. Unexpectedly, we observed that the emission from precipitates A2 and B2 was slightly brighter than that from A1 and B1 or A3 and B3. Notably, the emission spectra profiles of precipitates A2 and B2 were somewhat different with maximum wavelengths of ∼715 and ∼705 nm and PLQYs of less than 0.01 and 0.02, respectively. These discrepancies between two chemically similar solids can be explained by either the influence of crystallisation water molecules on luminescence properties or by the effect of solids structure (amorphous 5·2H2O vs. mixture of amorphous 5·2H2O and crystalline 5·12H2O).
In summary, the poor emission of 1 and 2 and related aquahydroxo complexes resulted in SMP materials with very weak emissions, while the absence of photoluminescence in 6·2H2O (precipitates A3 and B3) explains well the decrease in both PLQYs and lifetimes for 3x@SiO2, when x ≥ 0.002. There is, however, a “sweet spot” in 3x@SiO2 series of SMPs: materials with x in the range 0.0002–0.002 have quite an intensive emission.
3.5 Singlet-oxygen generation
As previously mentioned, the luminescence from hexamolybdenum cluster complexes 1–3 is efficiently quenched by oxygen. The emission quenching is due to energy transfer from the excited cluster complex to triplet oxygen (3O2), which results in generation of 1O2.11,12 The organic compound 2,3-diphenyl-para-dioxene is well established as a singlet-oxygen trap (Scheme S1†), since it is easily oxidised by singlet oxygen.47,48 Fig. S34† demonstrates 1H NMR spectra of acetone solutions of 2,3-diphenyl-para-dioxene and the cluster complexes 1–3 after 3 h of radiation by light with λ ≥ 400 nm. The appearance of a singlet peak at 4.72 ppm that corresponds to the methylene protons of ethylene glycol dibenzoate (i.e., the product of oxidation of 2,3-diphenyl-para-dioxene by 1O2) indicates the generation of singlet oxygen during the photoirradiation of solutions containing cluster complexes. The resultant concentration of ethylene glycol dibenzoate and calculated conversion of 2,3-diphenyl-para-dioxene after photoirradiation are given in Table S5.† According to the data, complex 3 was the most powerful photosensitiser. As discussed above, it is also the most efficient luminophore. Interestingly, the oxidation of 2,3-diphenyl-para-dioxene in the presence of 1 and 2 was also efficient, despite weak luminescence properties of these complexes. Indeed, conversion of the singlet-oxygen trap in the presence of 1 and 2 was of the same order of magnitude as in the presence of 3.Photosensitizing ability of cluster-doped SMPs was also investigated. Fig. 8 shows graphs of 2,3-diphenyl-para-dioxene conversion versus illumination time in the presence of nine samples of various SMPs. According to the data obtained, the increase in illumination time led to the gradual increase of singlet-oxygen trap conversion. There was also a tendency for SMPs with higher loadings of the cluster complex (x = 0.05 and 0.1) to show a slight increase in conversion of the trap molecule.
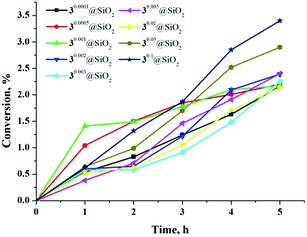 | ||
| Fig. 8 Conversion of 2,3-diphenyl-para-dioxene in presence of various SMPs versus illumination time. | ||
3.6 Influence of particle size on photophysical properties
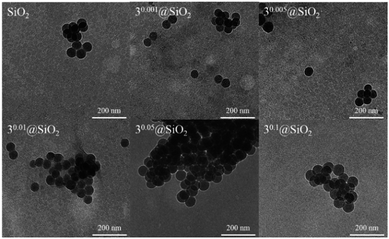
To obtain photoluminescent silica nanoparticles (SNPs) of composition 3x@SiO2 (where x = 0, 0.001, 0.005, 0.01, 0.05, 0.1) and monodisperse size distribution, the Stöber process was carried out in water-in-oil emulsion in the presence of compound 3 using a slightly modified synthetic protocol from Aubert et al.31FTIR spectra and elemental analyses of the obtained SNPs confirmed both successful displacement during reactions of all apical nitrato ligands and Bu4N+ cations in the initial cluster complex 3 and successful removal of all Brij®L4 surfactant during the washing of SNPs. TEM images showed that all SNPs had a perfectly spherical shape and increase in particle size from 55 nm to 65 nm with the increase of x (Fig. 9). In a similar manner as for SMPs, the set of analytical techniques (XRPD, FTIR, UV/Vis diffuse reflectance spectroscopies and elemental analysis) unambiguously confirmed the presence of the molybdenum cluster complex in the SNPs and the similar chemical environment of the molybdenum metal cluster in both SMPs and SNPs.
To evaluate the impact of particle size on the materials' luminescence properties, we also determined photophysical characteristics of 3x@SiO2 SNPs (Fig. 7 and S35, Table S3†). It was found that photoluminescence properties of the SNPs, when x ≤ 0.005, are similar to those of SMPs, while an increase in cluster loading above this value led to more significant reductions of both PLQY and photoluminescence lifetimes in the case of SNPs than for SMPs. This is likely to be connected with the higher degree of hydrolysis in the molybdenum cluster precursor for SNPs, due to longer reaction time. Indeed, according to ICP-AES, the actual content of molybdenum in SNPs, when x ≥ 0.01, is higher than that in corresponding SMPs (Table 1).
When we compared singlet-oxygen trap conversions in the presence of SNPs (3x@SiO2, x = 0.001, 0.005 and 0.01) with conversion in the presence of similar SMPs, we observed that not only did SNPs generate singlet oxygen, but also the efficiency of 1O2 generation by SNPs was approximately fourfold greater than by SMPs (Fig. 10). We believe that the reason for enhanced efficiency of singlet oxygen generation by SNPs is due to higher surface area of the material, which critically affects the rate of interaction of 3O2 with the cluster-doped silica. Indeed, the specific surface area of SMPs obtained by BET measurements was ∼60 m2 g−1, while it was ∼280 m2 g−1 for SNPs, that is, nearly 5 times higher. The nitrogen sorption isotherms are shown in Fig. S36.†
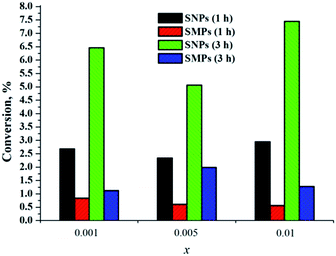 | ||
| Fig. 10 Singlet oxygen generation by SMPs and SNPs 3x@SiO2 (x = 0.001, 0.005 and 0.01) after 1 h and 3 h. | ||
4. Conclusions
In this work we have thoroughly studied the hybrid materials that are realised in the Stöber process in the presence of hexamolybdenum cluster complexes (Bu4N)2[{Mo6X8}(NO3)6] (X = Cl, Br, or I). We have shown that photoluminescence properties of resultant materials depend not only on composition of the cluster core {Mo6X8}4+, but also on loading of the metal cluster complex in the material. This is due to two processes that occur during material formation: substitution of nitrato ligands by silanol groups and hydrolysis of cluster complexes, which leads to formation of poorly luminescent compounds [{Mo6X8}(H2O)2(OH)4]·2H2O. Specifically, we have established that SMPs with composition 3x@SiO2, where x lies in the 0.0002–0.002 range, show the highest photoluminescence quantum yields. Formation of the corresponding aqua-hydroxo complex phase has also an effect on silica particle morphology, i.e., the spherical shape of the particles is significantly distorted when x ≥ 0.5.Comparison of microparticle photophysical properties with those of nanoparticles showed that size does not influence emission spectral shape, while luminescence quantum yields and SMP lifetimes are slightly higher and longer, respectively, than those from corresponding SNPs. This is due to greater surface area of the SNPs, which results in more significant quenching of photoluminescence by oxygen. This assumption is further confirmed by the higher singlet oxygen generation efficiency of SNPs in comparison with those of SMPs.
We suggest that photoluminescent particles of composition 3x@SiO2, where x is in the 0.0002–0.002 range are highly promising materials for applications such as agents for bioimaging, biolabeling or PDT. Indeed, these cluster-doped SMPs show appreciably bright photoluminescence within the optical tissue window and the ability to generate singlet oxygen. The relevant biological properties of these materials are currently under investigation.
Acknowledgements
We are grateful to the Russian Science Foundation for funding (grant 14-14-00192), to the Microscopic Centre of the Siberian Branch of the Russian Academy of Sciences for granting access to microscopic equipment, and to Dr K. A. Kovalenko (Nikolaev Institute of Inorganic Chemistry SB RAS) for nitrogen physisorption measurements. Dr K. A. Brylev thanks the Japan Society for the Promotion of Science (JSPS) for a post-doctoral fellowship for foreign researchers. Dr O. A. Efremova thanks the University of Hull for the academic starting grant.Notes and references
- S. Cordier, F. Grasset, Y. Molard, M. Amela-Cortes, R. Boukherroub, S. Ravaine, M. Mortier, N. Ohashi, N. Saito and H. Haneda, J. Inorg. Organomet. Polym. Mater., 2015, 25, 189–204 CrossRef CAS.
- M. N. Sokolov, M. A. Mihailov, E. V. Peresypkina, K. A. Brylev, N. Kitamura and V. P. Fedin, Dalton Trans., 2011, 40, 6375–6377 RSC.
- M. N. Sokolov, M. A. Mikhailov, K. A. Brylev, A. V. Virovets, C. Vicent, N. B. Kompankov, N. Kitamura and V. P. Fedin, Inorg. Chem., 2013, 52, 12477–12481 CrossRef CAS PubMed.
- M. N. Sokolov, M. A. Mikhailov, A. V. Virovets, K. A. Brylev, R. A. Bredikhin, A. M. Maksimov, V. E. Platonov and V. P. Fedin, Russ. Chem. Bull., 2013, 62, 1764–1767 CrossRef CAS.
- O. A. Efremova, M. A. Shestopalov, N. A. Chirtsova, A. I. Smolentsev, Y. V. Mironov, N. Kitamura, K. A. Brylev and A. J. Sutherland, Dalton Trans., 2014, 43, 6021–6025 RSC.
- K. Kirakci, P. Kubat, M. Dusek, K. Fejfarova, V. Sicha, J. Mosinger and K. Lang, Eur. J. Inorg. Chem., 2012, 3107–3111 CrossRef CAS.
- K. Kirakci, P. Kubat, J. Langmaier, T. Polivka, M. Fuciman, K. Fejfarova and K. Lang, Dalton Trans., 2013, 42, 7224–7232 RSC.
- K. Kirakci, K. Fejfarova, M. Kucerakova and K. Lang, Eur. J. Inorg. Chem., 2014, 2014, 2331–2336 CrossRef CAS.
- K. Kirakci, V. Sicha, J. Holub, P. Kubat and K. Lang, Inorg. Chem., 2014, 53, 13012–13018 CrossRef CAS PubMed.
- M. A. Mikhailov, K. A. Brylev, A. V. Virovets, M. R. Gallyamov, I. Novozhilov and M. N. Sokolov, New J. Chem., 2016, 40, 1162–1168 RSC.
- J. A. Jackson, M. D. Newsham, C. Worsham and D. G. Nocera, Chem. Mater., 1996, 8, 558–564 CrossRef CAS.
- J. A. Jackson, C. Turro, M. D. Newsham and D. G. Nocera, J. Phys. Chem., 1990, 94, 4500–4507 CrossRef CAS.
- K. Kirakci, P. Kubát, M. Kučeráková, V. Šícha, H. Gbelcová, P. Lovecká, P. Grznárová, T. Ruml and K. Lang, Inorg. Chim. Acta, 2016, 441, 42–49 CrossRef CAS.
- K. Kirakci, P. Kubát, K. Fejfarova, J. Martincik, M. Nikl and K. Lang, Inorg. Chem., 2016, 55, 803–809 CrossRef CAS PubMed.
- M. Amela-Cortes, A. Garreau, S. Cordier, E. Faulques, J. L. Duvail and Y. Molard, J. Mater. Chem. C, 2014, 2, 1545–1552 RSC.
- J. Elistratova, V. Burilov, A. Mustafina, M. Mikhailov, M. Sokolov, V. Fedin and A. Konovalov, Polymer, 2015, 72, 98–103 CrossRef CAS.
- A. Garreau, F. Massuyeau, S. Cordier, Y. Molard, E. Gautron, P. Bertoncini, E. Faulques, J. Wery, B. Humbrt, A. Bulou and J.-L. Duvail, ACS Nano, 2013, 7, 2977–2987 CrossRef CAS PubMed.
- Y. Molard, C. Labbé, J. Cardin and S. Cordier, Adv. Funct. Mater., 2013, 23, 4821–4824 CAS.
- O. A. Efremova, K. A. Brylev, Y. A. Vorotnikov, L. Vejsadová, M. A. Shestopalov, G. F. Chimonides, P. D. Topham, N. Kitamura and A. J. Sutherland, J. Mater. Chem. C, 2016, 4, 497–503 RSC.
- N. A. Vorotnikova, O. A. Efremova, A. R. Tsygankova, K. A. Brylev, M. V. Edeleva, O. G. Kurskaya, A. J. Sutherland, A. M. Shestopalov, Y. V. Mironov and M. A. Shestopalov, Polym. Adv. Technol., 2016 DOI:10.1002/pat.3749.
- D. Tarn, C. E. Ashley, M. Xue, E. C. Carnes, J. I. Zink and C. J. Brinker, Acc. Chem. Res., 2013, 46, 792–801 CrossRef CAS PubMed.
- J. Kim, Y. Piao and T. Hyeon, Chem. Soc. Rev., 2009, 38, 372–390 RSC.
- S. W. Bae, W. H. Tan and J. I. Hong, Chem. Commun., 2012, 48, 2270–2282 RSC.
- W. Arap, R. Pasqualini, M. Montalti, L. Petrizza, L. Prodi, E. Rampazzo, N. Zaccheroni and S. Marchio, Curr. Med. Chem., 2013, 20, 2195–2211 CrossRef CAS PubMed.
- S. Chinnathambi, S. Chen, S. Ganesan and N. Hanagata, Adv. Healthcare Mater., 2014, 3, 10–29 CrossRef CAS PubMed.
- C. D. Nunes, A. A. Valente, M. Pillinger, J. Rocha and I. S. Gonçalves, Chem.–Eur. J., 2003, 9, 4380–4390 CrossRef CAS PubMed.
- L. Hu, S. Ji, T. Xiao, C. Guo, P. Wu and P. Nie, J. Phys. Chem. B, 2007, 111, 3599–3608 CrossRef CAS PubMed.
- R. B. Watson and U. S. Ozkan, J. Phys. Chem. B, 2002, 106, 6930–6941 CrossRef CAS.
- M. Y. Kirillin, E. A. Sergeeva, P. D. Agrba, A. D. Krainov, A. A. Ezhov, D. V. Shuleiko, P. K. Kashkarov and S. V. Zabotnov, Laser Phys., 2015, 25, 075604 CrossRef.
- F. Grasset, F. Dorson, S. Cordier, Y. Molard, C. Perrin, A. M. Marie, T. Sasaki, H. Haneda, Y. Bando and M. Mortier, Adv. Mater., 2008, 20, 143–148 CrossRef CAS.
- T. Aubert, F. Cabello-Hurtado, M. A. Esnault, C. Neaime, D. Lebret-Chauvel, S. Jeanne, P. Pellen, C. Roiland, L. Le Polles, N. Saito, K. Kimoto, H. Haneda, N. Ohashi, F. Grasset and S. Cordier, J. Phys. Chem. C, 2013, 117, 20154–20163 CAS.
- J.-F. Dechézelles, T. Aubert, F. Grasset, S. Cordier, C. Barthou, C. Schwob, A. Maître, R. A. Vallée, H. Cramail and S. Ravaine, Phys. Chem. Chem. Phys., 2010, 12, 11993–11999 RSC.
- P. Braack, M. K. Simsek and W. Preetz, Z. Anorg. Allg. Chem., 1998, 624, 375–380 CrossRef CAS.
- R. K. Summerbell and D. R. Berger, J. Am. Chem. Soc., 1959, 81, 633–639 CrossRef CAS.
- J. C. Sheldon, Nature, 1959, 184, 1210–1213 CrossRef CAS.
- J. C. Sheldon, J. Chem. Soc., 1962, 410–415 RSC.
- J. C. Sheldon, J. Chem. Soc., 1960, 1007–1014 RSC.
- C. Brosset, Ark. Kemi, Mineral. Geol., 1945, 20, 1–16 Search PubMed.
- J. C. Sheldon, Chem. Ind., 1961, 323 CAS.
- J. C. Sheldon, J. Chem. Soc., 1963, 4183–4186 RSC.
- J. C. Sheldon, J. Chem. Soc., 1964, 1287–1291 RSC.
- L. M. Robinson, H. Lu, J. T. Hupp and D. F. Shriver, Chem. Mater., 1995, 7, 43–49 CrossRef CAS.
- B. P. Zhang, H. Masumoto, Y. Someno and T. Goto, Mater. Trans., 2003, 44, 215–219 CrossRef CAS.
- X. J. Zhang and H. G. Zheng, Bull. Mater. Sci., 2008, 31, 787–790 CrossRef CAS.
- B. Botar, A. Ellern and P. Kogerler, Dalton Trans., 2012, 41, 8951–8959 RSC.
- J. Jonca, C. Barus, W. Giraud, D. Thouron, V. Garcon and M. Comtat, Int. J. Electrochem. Sci., 2012, 7, 7325–7348 CAS.
- L. Gao, M. A. Peay and T. G. Gray, Chem. Mater., 2010, 22, 6240–6245 CrossRef CAS.
- M. A. Shestopalov, K. E. Zubareva, O. P. Khripko, Y. I. Khripko, A. O. Solovieva, N. V. Kuratieva, Y. V. Mironov, N. Kitamura, V. E. Fedorov and K. A. Brylev, Inorg. Chem., 2014, 53, 9006–9013 CrossRef CAS PubMed.
Footnote |
| † Electronic supplementary information (ESI) available: Experimental section, CIF files with crystallographic data (CSD-429897; CSD-429898); figures, tables, FTIR, UV/Vis diffuse reflectance, 1H NMR and photoemission spectra, TEM, SEM and confocal laser scanning microscopy images, TG and DTG curves. See DOI: 10.1039/c6ra04321f |
| This journal is © The Royal Society of Chemistry 2016 |

