
Synthesis and characterization of carbosilane dendrimer–sodium montmorillonite clay nanocomposites. Experimental and theoretical studies†
Tomáš Strašák*ab,
Marek Malý*b,
Monika Müllerováa,
Jan Čermákac,
Martin Kormundab,
Pavla Čapkováb,
Jindřich Matoušekb,
Lucie Červenková Šťastnáa,
Jaroslav Rejnekc,
Jana Holubovád,
Věra Jandováa and
Klára Čépee
aInstitute of Chemical Process Fundamentals of the CAS, v.v.i, Prague, Czech Republic. E-mail: strasak@icpf.cas.cz
bDepartment of Physics, Faculty of Science, University of J.E. Purkinje, Usti N/L, Czech Republic
cDepartment of Chemistry, Faculty of Science, University of J.E. Purkinje, Usti N/L, Czech Republic
dDepartment of General and Inorganic Chemistry, University of Pardubice, Pardubice, Czech Republic
eRegional Centre of Advanced Technologies and Materials, Department of Physical Chemistry, Faculty of Science, Palacký University in Olomouc, Olomouc, Czech Republic
First published on 25th April 2016
Abstract
Novel organic/inorganic hybrid materials with carbosilane fillers were developed. New carbosilane dendrimers of the first (Dm1) and second (Dm2) generations bearing four and eight cationic ammonium groups on their periphery were synthesized first. Their structure was elucidated by NMR spectroscopy and ESI-HRMS whereas their thermal stability was confirmed by TGA. Both dendrimers were used as organic components in the preparation of organoclays. A series of nanocomposites Dm1Mt and Dm2Mt with varied contents of dendrimers were prepared and characterized by a wide variety of analytical techniques. The analytical data show that the structure of organoclays and the ability of dendrimers to effectively interact with montmorillonite are strongly affected by their generation. Both species Dm1 and Dm2 intercalated into the interlayer space of montmorillonite increase correspondingly the basal spacing of Mt. In contrast to Dm2, increased loadings of Dm1 in suspension during the intercalation process have a negligible effect on d-spacing in the studied concentration range, as confirmed by XRD analysis. Besides unmodified Mt we also studied the interactions of dendrimers with plasma treated Mt and the results are presented. Computer modelling based mainly on Molecular Dynamics has shown the non-linear dependence of the d-spacing on the amount of dendrimers in the interlayer space within the studied dendrimer/montmorillonite mass ratio interval. The filling capacity of plasma unmodified montmorillonite with respect to both dendrimers was estimated using a combination of experimental and theoretical results.
Introduction
Modification of clays by organic molecules to obtain materials suited for specific use was described in the literature with the use of a number of diverse strategies. Owing to their useful properties these materials found numerous applications in catalysis,1,2 materials chemistry,3,4 or in biosciences.5 In all these applications, the properties and behaviour of the organoclays strongly depend on the molecular environment and the structure of the organic molecules within the galleries.The standard and well explored procedure for montmorillonite (Mt) modification is the intercalation of quaternary ammonium salts containing one or more longer alkyl chains leading to lipophilic materials which exfoliate particular sheets during the polymerization process.6 The polymeric systems filled by organoclays display significant improvements in the tensile, thermal, and mechanical properties.7
Clay modification with additives such as ionic liquids8,9 or polyhedral oligomeric silsesquioxanes (POSS)10,11 resulted in significantly greater thermal stability than that of montmorillonite conventionally modified with long chain quaternary ammonium ions.
Dendrimer–clay interactions have attracted only limited experimental and theoretical attention although dendritic surfactants can offer an interesting energetic and structural challenge to the formation of organoclay composites. Commercially available poly(amidoamine) (PAMAM) dendrimers12,13 or polyolic Boldorn dendrimers14 were studied most frequently.
Dendrimers as a class of macromolecular compounds, in contrast to the conventional linear and branched polymers, are prepared step-by-step by suitable selected synthetic steps and are thus hyperbranched and mono-disperse macromolecules with well-defined size, molecular weight, internal connectivity, and exact number of end groups. Carbosilane dendrimers are a subclass of dendritic compounds with silicon as a branching point between the generations.15 Highly flexible, nonpolar, and both thermally and chemically stable skeleton together with variability of the synthetic pathway and ease of peripheral functionalization make them suitable for many applications ranging from catalysis16,17 to receptors and biomedicine.18
According to our best knowledge no organoclay composite materials containing carbosilane materials (whether polymers or dendrimers) were published up to date. In this work we would like to fill in this gap. We present the first results obtained by intercalation of the first and second generations of carbosilane dendrimers into interlayer space of natural montmorillonite. Dendrimers Dm1 with four and Dm2 with eight cationic groups on their periphery were prepared by synthetic modification of substrates which we previously used as a scaffold for titanium complexes.19,20 For investigation of interaction of dendrimers with montmorillonite we used a variety of relevant experimental approaches. We found considerable differences between Dm1 and Dm2 dendrimers during intercalation process into the inorganic layers. To better understand the nature of dendrimer–montmorillonite interactions computational calculations were performed and correlated with experimental results.
Experimental
Materials and methods
Natural montmorillonite (Mt) with the basal spacing d = 12.5 Å was obtained from Alfa Aesar and used without further purification. All other chemicals and reagents were purchased from Sigma-Aldrich or Acros Organics. All syntheses of dendrimers were carried out under an argon atmosphere using Schlenk or drybox techniques, if needed. The organic solvents used were dried and purified according to standard procedures and stored under argon atmosphere. Allyl terminated carbosilane dendrimers were prepared by standard iterative procedures alternating hydrosilylation with dichloro(methyl)silane catalysed with Karstedt catalyst (platinum(0) tetramethyldivinyldisiloxane complex) and nucleophilic displacement of a chlorine with allylmagnesium bromide.21Instrumentation and techniques

Schematic drawing of the fluidized bed reactor. G – pressure gauge, C – cyclone (protects pump from the excessive powder), V – valve, P – rotary vane pump, Ar – Ar bottle, MFC – mass flow controller, RF – generator with matching network and electrodes.
Syntheses of carbosilane dendrimers
Preparation of organoclays
Modified clays containing cationic dendrimers Dm1 and Dm2 were separately prepared by standard cation exchange technique. Pristine Mt (1 g) were suspended in mixture of deionised water and methanol (1/1) and the mixture was stirred for 2 h. Solution of dendrimer (Dm1, Dm2; 0.1, 0.2 and 0.5 g) in 5 ml of methanol was added and the mixture was stirred for 24 h. The suspension was then centrifuged at 6000 rpm for 15 min then washed by deionised water several times until no precipitate formed on reaction with dilute AgNO3. The purified organoclays were dried in vacuum at 60 °C for 6 h. Organoclays are denoted XDmYMt where X is loading of dendrimer during preparation (weight ratio Dm/Mt (g g−1)) and Y indicates his generation.Computer modelling
Computer models of dendrimer–montmorillonite (D–Mt) systems were created and simulated using Materials Studio from BIOVIA (formerly Accelrys). Dendrimers were created using polymer builder and the Mt layers were obtained as the supercell, based on unit cell structure with registration number 9002779 (triclinic lattice type, symmetry space group P1, a = 5.18 Å, b = 8.98 Å, c = 15 Å, α = 90°, β = 90°, γ = 90°) deposited in Crystallography Open Database23 which was replicated in a (9×) and b (5×) directions. The initial models of intercalated Mt structures were assembled. Partial charges of montmorillonite and dendrimer atoms were calculated using Charge Equilibration Method (QEq). In case of water we used charges from SPC/E water model. Universal force field was used for all components (Mt, dendrimers, water). Then the molecular systems were subjected to several-stages simulation processing which combined geometry optimisations and Molecular Dynamic (NVT, NPT) runs during which the molecular systems were brought into their thermodynamic equilibrium with respect to desired pressure and temperature. Then d-spacing parameter was calculated based on simulated X-ray analysis which was done with Reflex module from Materials Studio. For more details see ESI.†24–30Results and discussion
Synthesis and characterization of carbosilane dendrimers Dm1 and Dm2
The interior of carbosilane dendrimers was prepared by the conventional divergent method. Hydrosilylation step using dichloromethylsilane was followed by alkenylation step with allylmagnesium bromide. In the final hydrosilylation step leading to the dendrimer of the desired generation chloromethyldimethylsilane was used as the reagent. Chloromethyl functionality was subsequently transformed to iodomethyl by Finkelstein reaction.31,32 Introduction of diethylamino groups onto the periphery of dendrimers was accomplished by reaction with diethylamine followed by the addition of K2CO3 solution to release amine from its hydroiodide. Treatment of dendrimers 3 and 4 with methyliodide in acetonitrile for 48 hours caused the quaternization of the peripheral amines to give the cationic dendrimers. Scheme 1 shows this sequence of reactions. Structural characterization of dendrimers 1–4, Dm1 and Dm2 has been carried out using 1H, 13C and 29Si-NMR spectroscopy and HRMS. | ||
| Scheme 1 Syntheses of cationic carbosilane dendrimers Dm1 and Dm2. | ||
Fig. 1 shows thermogravimetric analysis (TGA) of carbosilane dendrimers Dm1 and Dm1. Their thermal degradation process included two separated rapid weight losses. Compounds started to decompose at 190 °C. Within a short interval between 200 °C and 250 °C deamination of the exterior of dendrimers proceeded. The rate of the process was likely increased by the activating effect of silane in α-position. This fast event was followed by a delay between approx. 300 °C and 400 °C. The second mass loss in the interval 400–500 °C was caused by degradation of the carbosilane interior of the dendrimers. The high temperature of degradation pointed to excellent thermal stability of carbosilane scaffold. The thermal stability of the dendrimers was almost independent of their generation. The significant difference was in the position of delays between two weight losses relative to total mass. The delay on the curve of the dendrimer of the first generation followed after 72% mass loss while with the dendrimer of the second generation after 61%. This is in agreement with wt ratio of peripheral ammonium groups to carbosilane interior. Triethylammonium groups in Dm1 occupy 65% of the total mass while in Dm2 the value is 59%.
 | ||
| Fig. 1 TGA of dendrimers Dm1 and Dm2. | ||
Organoclays
 | ||
| Fig. 2 X-ray diffractograms of the basal reflections of montmorillonite intercalated by dendrimers (Dm1 and Dm2). Example of 0.2Dm1Mt (dashed line) is given (the other concentrations have the same result). The intensity of the 0.2Dm1Mt spectrum is also decreased in this graph for better clarity of the Dm2Mt spectra. | ||
 | ||
| Fig. 3 Details of the ATR spectra of the Mt after various treatments. Dm1 and Dm2 stands for spectra of pure dendrimers. The spectrum of the plasma treated Mt is not shown for clarity (spectrum is very similar to plasma untreated). | ||
 | ||
| Fig. 4 TEM images: (a) 0.5Dm1Mt and (b) 0.5Dm2Mt. | ||
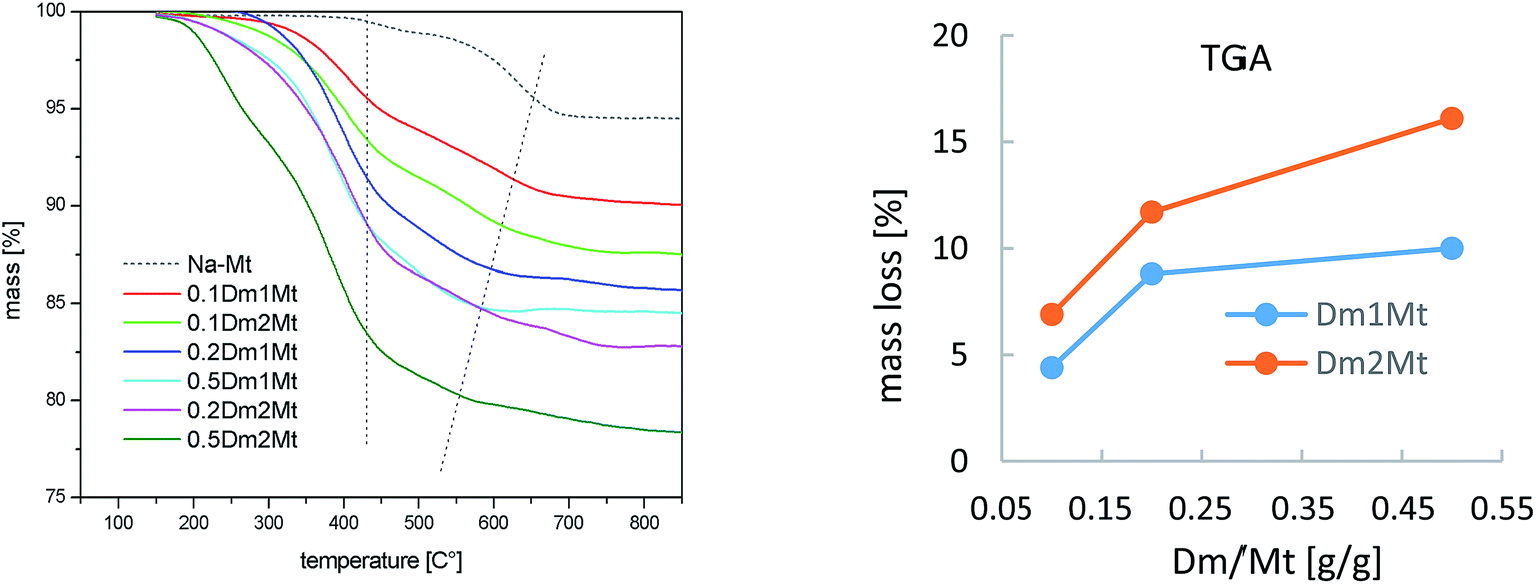 | ||
| Fig. 5 Results of TGA for Dm1Mt and Dm2Mt. | ||
EDX values were calculated as an average value of three independent measurements for a given sample. Nevertheless, these values did not differ from each other more than by 10%. The homogeneity of samples is evident from SEM images (see Fig. S3 in the ESI†).
 | ||
| Fig. 6 29Si MAS NMR of pristine Mt, 0.2Dm1Mt and 0.5Dm2Mt. | ||
Intercalation of plasma treated montmorillonite
A parallel experiment with intercalation of Dm1 and Dm2 into plasma treated montmorillonite has been carried out. Plasma treatment of pristine montmorillonite led to dehydration and partial dehydroxylation accompanied with strong decrease of basal spacing from 12.5 Å to 10.2 Å, as one can see in Fig. 7. The line profile of pristine montmorillonite was broadened after the plasma treatment and shifted towards higher angle corresponding to ∼10.2 Å. Following intercalation of plasma treated montmorillonite with 0.2 Dm1/Mt (g g−1) led again to sharpening of the XRD profile. In case of dendrimer Dm2 broader reflection profile is observed and the maximum stays close to the Dm1 treated Mt. The profile is asymmetric but not so strongly as in case of plasma untreated Mt.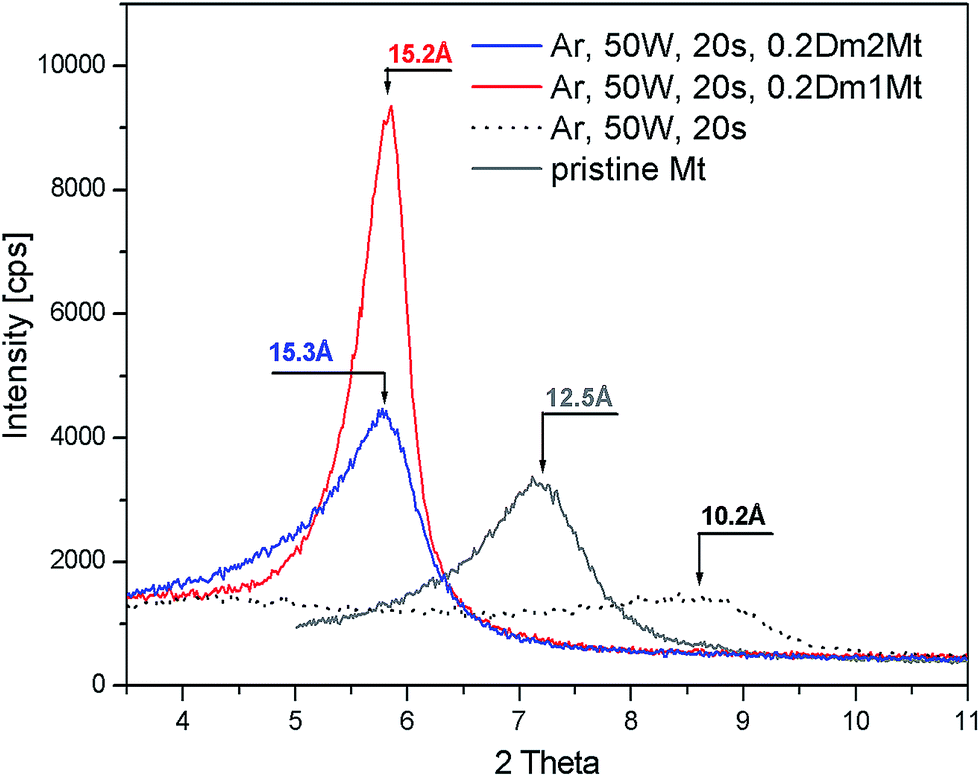 | ||
| Fig. 7 X-ray diffractograms of the plasma treated Mt intercalated by dendrimers Dm1 and Dm2. | ||
There is a big difference in intercalation behaviour of pristine and plasma treated montmorillonite in case of Dm2. For the same concentration of Dm2 in intercalation solution – 20% we can observe lower basal spacing as shown in Fig. 7. This result indicates a reduction of cation exchange capacity by plasma treatment and subsequent lower Dm2 content in the interlayer space.
Computer modelling
The following notation will be used. Nanocomposites obtained experimentally will be marked in the same way as in the previous part. Computational results were obtained for dendrimers without anions. These will be denoted D1 and D2 for Dm1 without four iodides and Dm2 without eight iodides, respectively. Similar system will be used for composite systems, e.g. 2×D2Mt stands for composite model with 2 molecules of D2 per one modelled Mt platelet.Computer modelling was used to better understand experimental results. First, the initial configurations of the DMt systems were created and then, after several simulation steps (see the relevant experimental section for more details), the final (equilibrated) molecular configurations were obtained – see Fig. S4.† The main simulation results are summarized in Table 1.
| Num. Den. (m(D1)/m(Mt)) | d [Å] | QD (QD in %) | NW |
|---|---|---|---|
| 0 (0) | 12.31 (0.04), 9.37 (0.01) | 0 (0) | 190 (0.102), 0 (0) |
![[thin space (1/6-em)]](https://www.rsc.org/images/entities/char_2009.gif) |
|||
| D1 | |||
| 1 (0.0245) | 14.26 (0.07) | 4 (8.51) | 178 (0.096) |
| 2 (0.0490) | 14.70 (0.03) | 8 (17.02) | 166 (0.089) |
| 3 (0.0735) | 14.87 (0.05) | 12 (25.53) | 153 (0.082) |
| 4 (0.0980) | 15.34 (0.10) | 16 (34.04) | 141 (0.076) |
| 5 (0.1225) | 17.85 (0.23) | 20 (42.55) | 129 (0.070) |
| 6 (0.1471) | 17.94 (0.31) | 24 (51.06) | 117 (0.063) |
| 7 (0.1716) | 19.22 (0.90) | 28 (59.57) | 105 (0.057) |
| 8 (0.1961) | 20.04 (0.20) | 32 (68.09) | 92 (0.05) |
|
|||
| D2 | |||
| 1 (0.0576) | 14.95 (0.13) | 8 (17.02) | 160 (0.086) |
| 2 (0.1153) | 18.02 (0.23) | 16 (34.04) | 131 (0.071) |
| 3 (0.1729) | 19.20 (0.34) | 24 (51.06) | 101 (0.054) |
| 4 (0.2305) | 21.37 (0.57) | 32 (68.09) | 72 (0.039) |
The second column shows complete series of d-spacing values covering cases of 1–8×D1 and 1–4×D2 dendrimers in each interlayer space of our modelled Mt system as well as the pristine Mt cases. This column presents results obtained from simulations of DMt composites in the presence of water molecules in each interlayer space and also results for pristine Mt with and without water. In case of pristine Mt with water, 190 molecules of water were added into each interlayer space. This water amount corresponds to mass ratio 0.102 (water/(Mt sheets)). Good agreement of d-spacing obtained from simulations (d = 12.31 Å) with our experimental result (dexp = 12.5 Å) in case of pristine Mt for this water content stems from the fact that we used this dendrimer free system to determine proper number of water molecules. Nevertheless, the fact that d-spacing around 12.3 Å corresponds to the water/(Mt sheets) mass ratio around 0.1 is in agreement with published results25,39 and confirms that the used parameterization as well as the whole simulation methodology may provide realistic results. The obtained value of 9.37 Å for absolutely dry Mt again confirms sufficient reliability of the chosen methodology.25
In general, in both cases (D1Mt and D2Mt) with increasing number of dendrimers in interlayer space the distance between layers was growing, however, in case D1 there were areas where the dependence of d-spacing on the number of internalised dendrimers was near the constant function. In this dendrimer case we could see just small differences in d-spacing between the numbers of intercalated dendrimers (per one Mt layer) 2, 3 and 4, the corresponding mass ratios D1/Mt were 0.049, 0.0735 and 0.098. The negligible difference in d-spacing was found here also between the dendrimer numbers 5 and 6 which corresponded to mass ratios 0.1225 and 0.1471 – see Table 1 and Fig. S9 in the ESI.† Since D1Mt and D2Mt cases with similar D/Mt ratio have similar d-spacing, this parameter seems to depend on the dendrimer mass regardless of dendrimer generation.
The experimental data were compared with those obtained from simulations. Experimental results for Dm1 showed that almost independently on the Dm1/Mt mass ratio in the solution, which was changing from 0.1 to 0.5, the d-spacing was near 15 Å in all the cases. Considering our in silico results this experimental behaviour may be explained as follows. With increasing Dm1/Mt (g g−1) from 0.1 to 0.5 the number of dendrimers which get into the interlayer spaces increases but is still within the D1/Mt range estimated by simulation roughly as the interval D1/Mt (g g−1) 0.049–0.098.
Values near 15 Å were obtained for 0.1Dm2Mt and 0.2Dm2Mt, for 0.2Dm2Mt the peak corresponding to d = 17.4 Å was also detected.
The result obtained from computer simulation (see Table 1, Fig. S9†) for the lowest D2/Mt ratio 0.0576 (i.e. one dendrimer per one Mt layer of our model) corresponded well with experimental results. When in experiment the total Dm2/Mt (g g−1) was increased to 0.5, d-spacing reached saturated value 19.7 Å. The closest d value obtained from the simulations was 19.2 Å which corresponded to our simulated 3 molecules of D2 per one Mt layer and to D/Mt (g g−1) = 0.1729. For 4×D2Mt (mass ratio 0.2305) the d-spacing 21.37 Å was obtained from simulations. By the linear interpolation between cases 3×D2Mt and 4×D2Mt we obtain for d = 19.7 Å corresponding D2/Mt value 0.1862. Therefore we could estimate that the value ca. 0.1862 (which corresponded to 3.23 D2 per simulated Mt layer) was the maximum D2/Mt ratio which was possible to reach inside Mt using the given approach under the given thermodynamic conditions. As we can see (Fig. 8) in case of 3×D2Mt, there was evident partial mutual overlap of molecules D2 between two layers of Mt. If we compare saturated D/Mt values of both dendrimers, we obtain, that the saturated D/Mt in case of D2 is ca. 1.9 times higher than this value for D1 (0.1862/0.0980 = 1.9). This is qualitatively in accordance with the TGA and EDX experimental data. Moreover the similar phenomenon was also reported in analogical PAMAM/Mt systems.12
 | ||
| Fig. 8 Top (top) and side (bottom) view of the final configuration of 4×D1Mt (left) and 3×D2Mt (right) simulated systems (systems with d-parameter closest to average value were chosen for visualization). Just one layer visualized. For the better clarity dendrimers are black, brown, grey and steel blue with the exception of N atoms which are always blue. Ca2+ – dark green, K+ – dark orange, Na+ – purple, Si atoms (Mt) – dark yellow, Al – magenta, Mg – light green, O – red, H (non-dendrimer) – white. Mt is shown in polyhedron style. In top views oxygens from water molecules are highlighted using CPK style (in bottom views is water in stick style). | ||
Calculated potential energies of simulated systems suggest that the reason for the above mentioned phenomenon is probably not based on the fact that the group of D2 dendrimers of the given mass is able to interact with Mt (to get lower total energy) significantly more effectively than the group of D1 dendrimers of the same or similar mass (and so also approximately the same/similar charge). We defined dE as difference between the potential energy of the given dendrimer–montmorillonite system E(DMt) and potential energy of the pure (hydrated) montmorillonite E(Mt): dE = E(DMt) − E(Mt) (see Fig. S10† for the full context). Positive value of dE and dH indicates the increase of potential energy and enthalpy of the Mt after dendrimer intercalation. Removing of dendrimers (those transferred into Mt) from water solution and release of adequate number of cations (Na+, K+, Ca2+) and adsorbed water molecules from Mt energetically compensates this increase. If we assume that D1 dendrimers are transferred inside the Mt in significantly smaller amounts than D2 because they are not able to interact with Mt as well as D2, we should obtain for the same D/Mt significantly higher dE (as “penalty” – increase of the Mt potential energy) in D1 case. Fig. S6† documents that for the given D/Mt there is (starting with D/Mt = ca. 0.12) really dE(D1) > dE(D2) but the reason here is most likely just the difference in the exchanged charge (not significantly worse interaction or the packing ability of D1 compared to D2 – see more in discussion in ESI†). When experimental and simulation results were combined, we obtained the saturated D2/Mt ratio around 0.1729 which corresponds to 3 dendrimers (and exchanged charge 24) per one layer of simulated Mt system. Fig. S6† shows that results for 6×D1 (corresponding to the same exchanged charge) would pay ca. 500 kcal mol−1 lower dE penalty than those for 3×D2 but in spite of this fact the real maximum of D/Mt in case of D1 seems to be significantly lower than 6×D1 (ca. 3×D1). Thus the reason of relatively high difference between D1 and D2 in estimated maximum D/Mt values seems to be rather of other origin than significant differences in ability to accommodate inside Mt and effectively interact with it (when comparing the same/similar amounts). The same trends as in case of dE are evident also in case of analogically defined enthalpy penalty dH (D/Mt and charge dependencies – see Fig. S7†). It seems that D1 is “pushed” into Mt noticeably less than D2.
It is well known that polymer intercalation into Mt is more or less (depending on the particular system) an entropy driven process.40 Intercalated polymer molecules contribute to the increase of the overall entropy through desorption of adsorbed (surface/internal) water molecules and cations. By increasing of distances between Mt layers polymers may increase also degrees of freedom of eventual surfactants, the rest of cations and slightly also mobility of Mt layers. On the other hand, favourable interaction of dendrimers with Mt decreases the overall entropy as the dendrimers degrees of freedom are reduced (“binding entropy penalty”), nevertheless this effect should be here more than compensated by those above described. If we compare the entropy penalty of the same weight amounts of dendrimers D1 and D2 after intercalation, we might deduce that it will be higher for D1 since in this case we have material almost of the same chemical composition and very similar structure as in D2 case, but distributed into about 2.35 times higher number of individual particles (molecules) hence also with extra degrees of freedom (translational and rotational) comparing to D2 case. In fact we calculated in our other study the entropy (normal mode analysis) of quite similar carbosilane dendrimers generations 1 and 2. Here indeed the given mass of D1 had higher entropy that the same mass of D2 but in case of charge equivalent amounts (e.g. 2×D1 comparing to 1×D2) there was slightly more entropy obtained in 1×D2 case since D2 has still more atoms than 2×D1 so more vibrational entropy which more than compensated lack of translational and rotational degrees of freedom comparing to 2×D1. But the “entropy penalty” of both dendrimers after their intercalation into Mt is of course not only question of their total entropy in free state (i.e. maximum entropy they can loose if they become 100% fixed), it also depends on degree of their fixing after they bind to Mt. Degrees of freedom of D2 might be reduced less in Mt composite, than in case of D1. Moreover, however there is no obvious reason to assume that the same amounts of D1 and D2 will significantly differ in their ability to induce above described entropy gain (desorption of adsorbed (surface/internal) water molecules and cations) after their binding to Mt it could be that D2 is better “entropy generator”. During the process of preparation of the D–Mt composite in water solution, Mt is significantly more hydrated than we used for our calculations for determining d-spacing parameter so validity of our arguments in “dE-discussion” is limited by the assumption that if we do the same analysis of the simulated systems with more hydrated Mt we obtain similar behaviour as described in Fig. S6 and S7 in the ESI† and which corresponds to Mt case with hydration 0.102 (mass (H2O)/mass (Mt sheets)).
Conclusion
In summary, we describe preparation and characterization of carbosilane dendrimers of the first and second generations containing ionic ammonium groups on their periphery and showing high thermal stability of carbosilane scaffold as confirmed by TGA. Dendrimers were intercalated into an interlayer space of natural montmorillonite through ion exchange reaction. In a series of experiments, the first examples of organo-montmorillonite composite materials containing carbosilane materials as organic fillers were prepared in this way. Using Dm1 dendrimer we were able to increase d-spacing of the new materials to ca. 15 Å independently on initial dendrimer loading in solution as is evident from XRD analysis. Interlayer space of Dm2Mt nanocomposites is modulated by loading of Dm2 and increase of d-spacing up to ca. 20 Å was possible to achieve with higher amount of dendrimer. Furthermore, according to TGA and EDX analysis of nanocomposites Dm1Mt and Dm2Mt, considerably lower ability of Dm1 to fill an interlayer space of Mt was recorded. A parallel experiment with intercalation of Dm1 and Dm2 into plasma treated montmorillonite has been carried out and we found considerable difference in intercalation behaviour in comparison with unmodified Mt.Computer simulations which combined geometry optimisations and Molecular Dynamic were performed to better understand the phenomenon we observed in our heterogeneous systems experimentally. In case of D1Mt system it was confirmed that there exist areas where the dependence of d-spacing on the number of internalised dendrimers is almost constant function, which correlates with the similar observation related to experimentally determined dependence of d-spacing as the function of the concentration of dendrimers in parent solution. Filling capacity of plasma unmodified montmorillonite with respect to both dendrimers was estimated (max. bound dendrimer/montmorillonite mass ratios – D1/Mtmax = 0.098, D2/Mtmax = 0.1862) using combination of experimental and theoretical data. Energetic analysis of simulated systems suggests that entropy might play the important role in different ability of dendrimers to fill montmorillonite interlayer spaces.
Acknowledgements
This work was supported by the GACR project no. 13-06989S. Access to computing and storage facilities owned by parties and projects contributing to the National Grid Infrastructure MetaCentrum, provided under the programme “Projects of Large Infrastructure for Research, Development, and Innovations” (LM2010005), is greatly appreciated. The authors acknowledge the assistance provided by the Research Infrastructure NanoEnviCz, supported by the Ministry of Education, Youth and Sports of the Czech Republic under Project No. LM2015073.References
- Q. Hao, Z. Liu, B. Zhang, G. Wang, C. Ma, W. Frandsen, J. Li, Z. Liu, Z. Hao and D. Su, Chem. Mater., 2012, 24, 972–974 CrossRef CAS.
- G. B. B. Varadwaj, S. Rana, K. Parida and B. B. Nayak, J. Mater. Chem. A, 2014, 2, 7526–7534 CAS.
- Y.-C. Li, J. Schulz, S. Mannen, C. Delhom, B. Condon, S. Chang, M. Zammarano and J. C. Grunlan, ACS Nano, 2010, 4, 3325–3337 CrossRef CAS PubMed.
- M. A. Priolo, D. Gamboa and J. C. Grunlan, ACS Appl. Mater. Interfaces, 2010, 2, 312–320 CAS.
- M. Ikeda, T. Yoshii, T. Matsui, T. Tanida, H. Komatsu and I. Hamachi, J. Am. Chem. Soc., 2011, 133, 1670–1673 CrossRef CAS PubMed.
- A. Usuki, N. Hasegawa and M. Kato, Adv. Polym. Sci., 2005, 179, 135–195 CrossRef CAS.
- A. Okada and A. Usuki, Macromol. Mater. Eng., 2006, 291, 1449–1476 CrossRef CAS.
- S. Livi, G. Sar, V. Bugatti, E. Espuche and J. Duchet-Rumeau, RSC Adv., 2014, 4, 26452–26461 RSC.
- N. H. Kim, S. V. Malhotra and M. Xanthos, Microporous Mesoporous Mater., 2006, 96, 29–35 CrossRef CAS.
- H. Liu, W. Zhang and S. Zheng, Polymer, 2005, 46, 157–165 CrossRef CAS.
- D. M. Fox, P. H. Maupin, R. H. Harris, J. W. Gilman, D. V. Eldred, D. Katsoulis, P. C. Trulove and H. C. De Long, Langmuir, 2007, 23, 7707–7714 CrossRef CAS PubMed.
- U. Liyanage, E. U. Ikhuoria, A. A. Adenuga, V. T. Remcho and M. M. Lerner, Inorg. Chem., 2013, 52, 4603–4610 CrossRef PubMed.
- K. J. Shah, T. Imae and A. Shukla, RSC Adv., 2015, 5, 35985–35992 RSC.
- A. Azzouz, E. Assaad, A.-V. Ursu, T. Sajin, D. Nistor and R. Roy, Appl. Clay Sci., 2010, 48, 133–137 CrossRef CAS.
- J. Roovers and J. Ding, in Silicon-Containing Dendritic Polymers, ed. P. Dvornic and M. J. Owen, Springer, 2009, pp. 31–96 Search PubMed.
- J. W. J. Knapen, A. W. van der Made, J. C. de Wilde, P. W. N. M. van Leeuwen, P. Wijkens, D. M. Grove and G. van Koten, Nature, 1994, 372, 659–663 CrossRef CAS.
- R. van Heerbeek, P. C. J. Kamer, P. W. N. M. van Leeuwen and J. N. H. Reek, Chem. Rev., 2002, 102, 3717–3756 CrossRef CAS PubMed.
- K. Hatano, K. Matsuoka and D. Terunuma, Chem. Soc. Rev., 2013, 42, 4574–4598 RSC.
- T. Strašák, J. Čermák, J. Sýkora, J. Horský, Z. Walterová, F. Jaroschik and D. Harakat, Organometallics, 2012, 31, 6779–6786 CrossRef.
- T. Strašák, F. Jaroschik, M. Malý, J. Čermák, J. Sýkora, R. Fajgar, J. Karban and D. Harakat, Inorg. Chim. Acta, 2014, 409, 137–146 CrossRef.
- L. L. Zhou and J. Roovers, Macromolecules, 1993, 26, 963–968 CrossRef CAS.
- J. Rocha and J. Klinowski, J. Magn. Reson., 1990, 90, 567–568 CAS.
- A. Viani, A. Gualtieri and G. Artioli, Am. Mineral., 2002, 87, 966–975 CrossRef CAS.
- K. Rappe and W. A. Goddard, J. Phys. Chem., 1991, 95, 3358–3363 CrossRef.
- L. Sun, J. T. Tanskanen, J. T. Hirvi, S. Kasa, T. Schatz and T. A. Pakkanen, Chem. Phys., 2015, 455, 23–31 CrossRef CAS.
- J. W. Chu, B. L. Trout and B. R. Brooks, J. Chem. Phys., 2003, 119, 12708–12717 CrossRef CAS.
- N. Karasawa and W. A. Goddard, J. Phys. Chem., 1989, 93, 7320–7327 CrossRef CAS.
- S. Nosé, J. Chem. Phys., 1984, 81, 511–519 CrossRef.
- G. J. Martyna, D. J. Tobias and M. L. Klein, J. Chem. Phys., 1994, 101, 4177–4189 CrossRef CAS.
- R. Torrence Martin, Clays Clay Miner., 1960, 9, 28–70 Search PubMed.
- B. A. Omotowa and J. M. Shreeve, Macromolecules, 2003, 36, 8336–8345 CrossRef CAS.
- R. Meijboom, M. J. Overett and J. R. Moss, J. Organomet. Chem., 2004, 689, 987–991 CrossRef CAS.
- H. Zhong, Z. Qiu, W. Huang, D. Sun, D. Zhang and J. Cao, Appl. Clay Sci., 2015, 114, 359–369 CrossRef CAS.
- V. Balek, Z. Malek, S. Yariv and G. Matuschek, J. Therm. Anal. Calorim., 1999, 56, 67–76 CrossRef CAS.
- R. J. P. Corriu, Angew. Chem., Int. Ed., 2000, 39, 1376–1398 CrossRef CAS.
- A. Kowalewska, W. Fortuniak, K. Rózga-Wijas and B. Handke, Thermochim. Acta, 2009, 494, 45–53 CrossRef CAS.
- D. M. Fox, P. H. Maupin, R. H. Harris, J. W. Gilman, D. V. Eldred, D. Katsoulis, P. C. Trulove and H. C. De Long, Langmuir, 2007, 23, 7707–7714 CrossRef CAS PubMed.
- E. Lippmaa, M. Magi, A. Samoson, G. Engelhardt and A. R. Grimmer, J. Am. Chem. Soc., 1980, 102, 4889–4898 CrossRef CAS.
- R. K. Hawkins and P. A. Egelstaff, Clays Clay Miner., 1980, 28, 19–28 CAS.
- S. S. Ray and M. Okamoto, Prog. Polym. Sci., 2003, 28, 1539–1641 CrossRef CAS.
Footnote |
| † Electronic supplementary information (ESI) available. See DOI: 10.1039/c6ra04442e |
| This journal is © The Royal Society of Chemistry 2016 |