Green synthesized nanospherical silver for selective and sensitive sensing of Cd2+ colorimetrically
Balakumar Vellaichamy and
Prakash Periakaruppan*
Department of Chemistry, Thiagarajar College, Madurai-625 009, Tamil Nadu, India. E-mail: kmpprakash@gmail.com; Fax: +91 4522312375; Tel: +91 9842993931
First published on 1st April 2016
Abstract
We report here a facile, green and one-pot synthesis of nano-spherical silver (NSS) using Bombax ceiba leaf extract (BCLE) as both a reducing and stabilizing agent. The synthesized NSS has been characterized using UV-visible, FT-IR, XRD, HR-TEM, EDX, SEM and EDX mapping analysis and the formation and stabilization mechanism are discussed. The green synthesized NSS was tested for selective and sensitive sensing of Cd2+ colorimetrically in the presence of interfering metal ions. The limit of detection (LOD) for Cd2+ is found to be 1.5 × 10⁻⁹ mol L−1. This proposed method can be successfully applied to determine the concentration of Cd2+ in water samples at the nano-molar level.
Introduction
The ever increasing environmental pollution caused mainly by human activities has posed serious health problems in various places of the world. Heavy metal pollution is a global problem and it causes threats to the environment and human beings.1 Some heavy metals are reported to be highly toxic and harmful to health even at trace level concentrations. Additionally, heavy metals are non-biodegradable and tend to accumulate in living organisms, which can cause severe problems to both human health and wildlife.1–3 Among them, cadmium (Cd) has received much attention due to its high toxicity and bio-accumulative properties. Cd is one of the most toxic heavy metal in surface water and soil.4 In general, human exposure to and contamination by Cd is possible due to environmental sources such as air, water, soil and food.5 According to Food and Agriculture Organization, Environmental Protection Agency and World Health Organization, Cd is immediate concern due to the fact that it easily enters into the food chain and imposes severe human health hazards. The drinking water guideline value recommended for Cd is strictly restricted to 0.003 to 0.005 mg L−1.6–8 The symptoms of Cd poisoning are instantaneous hypertension, shortening of life-span, kidney damage, bronchitis, retardation of growth, gross abnormalities of the vital organs and the risk of prostatic cancer.9–11 Cd can accumulate in kidneys which becomes mostly fatal. Therefore, it is necessary to develop selective and sensitive determination of Cd in environmental samples to establish a simple inexpensive method.Many methods have been described in the literature for the determination of heavy metals including inductively coupled plasma mass spectrometry,12 atomic absorption spectrometry,13 instrumental neutron activation analysis,14 surface-enhanced Raman spectroscopy,15 electrochemical sensor16 and fluorescence turn on and off sensing techniques.17,18 However, these methods have several disadvantages, such as high cost and are not easily adaptable for online monitoring, long analysis time, requirement for sample pre-treatment, low sensitivity and selectivity.19 On the other hand, colorimetric method has several advantages over other methods which include simplicity, rapidity, high sensitivity, less time consumption and also real time detection either by naked eye or using a simple spectrophotometer.
Green nanotechnology field has been growing rapidly throughout the world. The “green synthesis” of metal nanoparticles receives a greater attention due to their unusual optical, chemical, photo-chemical and electronic properties.20 Noble metal nanoparticles are prepared by using various physical, chemical and lately developed biological methods. Most of the chemogenic metal nanoparticles are cytotoxic and non-biocompatible due to contamination from chemical precursors, residual solvent toxicity and generation of hazardous by-products.21 Hence it is imperative to employ non-toxic stabilizing agents of eco-friendly nature for the synthesis of metal nanoparticles. In this regard, biological methods have received considerable significance owing to the natural abundance of renewable, cost-effective and biodegradable materials, thus implementing the green chemistry principles.22,23 Silver nanoparticles (AgNPs) has drawn remarkable interest in the past few years as it exhibits strong absorption of electromagnetic waves in the visible region due to surface plasmon resonance.24 Biogenic AgNPs with uniform size, shape, surface nature and distance between particles leads to tunable changes in their optical properties,25,26 which find some potential applications including catalysis,27 bioimaging,28 drug delivery,29 DNA sequencing,30 electrochemical sensors,31 colorimetric sensors,32,33 and so on.
In the present investigation, we report a simple and green synthesis of nanospherical silver (NSS) for colorimetric determination of Cd2+ in aqueous medium. The prepared NSS has been characterized using various instrumental techniques and is found to sense Cd2+ with excellent selectivity and sensitivity in the presence of interfering metal ions. To date, no work has been carried out on sensing of Cd2+ using green synthesized nano spherical silver.
Experimental section
Chemicals
All chemicals used were of analytical grade or of the highest purity available. All solutions were prepared with double-distilled deionized water. The silver nitrate (AgNO3) was purchased from Sigma-Aldrich, India and used as received. The fresh Bombax ceiba (BC) leaf was collected in Thiagarajar College campus, Madurai, India. Li+, Na+, K+, Mg2+, Ca2+, Cd2+, Mn2+, Ni2+, Cu2+, Co2+, Hg2+, Pb2+, As2+ and Bi2+ were purchased from Merck, India and used as received.Preparation of BCLE
The fresh and healthy BC leaf was finely cut into small pieces and washed several times with deionized water to remove all the dust and other adherent materials. 100 mg of BC leaf was boiled with 100 mL of deionized water at 90 °C for 15 min and the extract was twice filtered using Whatmann filter paper no. 1. The filtered BCLE was pale yellow in color and it was used as reducing as well as stabilizing agent for the synthesis of NSS.34–36 The filtrate was stored in the refrigerator at 4 °C for further experiments.Green synthesis of NSS
5 mL of BCLE was mixed with 10 mL of aqueous solution of 1 mM AgNO3 solution at room temperature. The pale yellow color solution becomes deeper brown within 48 min and no noticeable difference in the color of aqueous silver colloids is observed, which indicates that the bio-reduction process is over within 48 min. The color change indicates the formation of NSS in aqueous solution due to excitation of surface plasmon vibration in the metal nanoparticles.The synthesized NSS was collected by centrifugation at 2000 rpm for 15 min and then the filtrate was re-dispersed in water and centrifuged for several times to remove any excess amount of organic contents. Finally, the dark brown NSS was lyophilized in ambient condition. After lyophilisation, the NSS was stored in screw cap bottle for further characterization.
Procedure for colorimetric sensing of Cd2+
Colorimetric sensor studies were carried out by adding different metal ions into the green synthesized colloidal NSS. To investigate the sensing ability of NSS, representative alkali (Li+, Na+, K+), alkaline earth (Mg2+, Ca2+) and transition-metal ions (Mn2+, Ni2+, Cu2+, Cd2+ Co2+, Hg2+, Pb2+, As2+, Bi2+) at the same conditions and of the same concentration (0.5 mL, 100 μM) were added into the green synthesized NSS solution respectively. The color changes and UV-visible absorption spectra were performed and monitored at room temperature. The photographs were taken with a digital camera after 3 min of mixing.Instrumentation
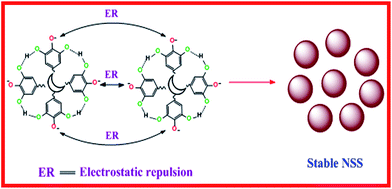
The formation of green synthesized NSS was preliminarily characterized by visual observation of the brown color of the solution and further confirmed by the UV-visible absorption spectra which were recorded using a Jasco (V-560) model double beam spectrophotometer with 3 mL quartz cuvette. The FT-IR spectral measurements were recorded using KBr disc on a JASCO FT-IR 460 Plus spectrophotometer. XRD analysis was carried out in X-ray diffraction unit, Cu Kα radiation (λ = 1.5418 Å) on JEOL JDX 8030 X-ray diffractometer. The size and morphology of the NSS were examined by transmission electron microscopy (TEM, JEOL JEM 2100 model instrument). Energy dispersive X-ray (EDX) spectrometer attached to the transmission electron microscope and scanning electron microscope (VEGA3 TESCAN model) were used for elemental analysis. All experiments were carried out at room temperature. Scheme 1 illustrates the formation mechanism of the green synthesized NSS and their sensing properties of Cd2+.Results and discussion
Characterization
UV-visible spectroscopy has been proven to be a useful spectroscopic method for the detection of prepared metallic nanoparticles. Fig. 1a shows two absorption maxima at 275 and 324 nm corresponding to proteins and phenolic glycosides present in the leaf extract solutions.34 The UV-visible absorbance spectra for the reduction of NSS, as a function of time, (Fig. 1b) shows a well-defined surface plasmon at 435 nm, which is in very good agreement with the earlier reported SPR band of silver nanospheres.27 Fig. 1b shows the intensity of sharp SPR band centered at 435 nm which increases with increasing time and gets stabilized after 48 min of reaction indicating the complete formation of Ag0 nanoparticles via the active molecules present in the leaf extract. The increase in absorption reflects the increasing number of such small silver particles over time. The shift to the blue or red in the λmax of the SPR peak could be related to obtaining silver nanoparticles at various shapes, sizes or extract dependencies of formed NSS. In the present work, the SPR band characteristics of NSS is detected at 435 nm only, which strongly suggests that the formation of NSS is spherical in shape and is confirmed by TEM results.The formation of NSS was visually identified by means of change in color of reaction mixture from pale yellow to light brown to dark brown, depending on the intensity and the number of nanoparticles. The absorption peak steadily increases and after 48 min there is no increase, which confirms that the reaction is completed within 48 min. The intensity of color does not intensify after 48 min which is established by Fig. 1c. The absorption spectra recorded after 48 min and 24 h shows almost the same intensity as shown in Fig. 1d.
The dual nature of plant extract as a bio-reductant and stabilizer for the formation of NSS, which was examined by FT-IR analysis. Fig. 2 shows the FT-IR peaks of dried BC leaf and synthesized NSS at different reaction time. The characteristic peak appearing in FT-IR spectra are shown in Fig. 2a. The existence of peak at 3447 cm−1 is due to the –OH stretching vibration of alcohols and phenols or bending stretching of hydrogen-bonded alcohols and phenols present in the leaf extract molecules.
 | ||
| Fig. 2 FT-IR spectra of BCL (a), having added AgNO3 to BCLE after 10 min (b), 30 min (c) and 48 min (d). | ||
The peak at 1659 cm−1 is the C![[double bond, length as m-dash]](https://www.rsc.org/images/entities/char_e001.gif) O stretching vibration of carbonyl and carboxylic group of amide I linkage of the proteins.35,36 The peak at 610 cm−1 is the plane bending vibration of N–H groups in the proteins. After reduction with the silver ions (Fig. 2b–d) the strength of the peak at 3447 cm−1 decreases and finally disappears.
O stretching vibration of carbonyl and carboxylic group of amide I linkage of the proteins.35,36 The peak at 610 cm−1 is the plane bending vibration of N–H groups in the proteins. After reduction with the silver ions (Fig. 2b–d) the strength of the peak at 3447 cm−1 decreases and finally disappears.
Also the C![[double bond, length as m-dash]](https://www.rsc.org/images/entities/char_e001.gif) O stretching vibration of carbonyl and carboxylic group (1659 cm−1) and plane bending vibration of N–H group (610 cm−1) of amide I linkage of the protein peaks decrease or weaken. As indicated by the FT-IR data, the plant extract contains phyto-chemicals and functional groups like alcohol or phenol and amide-I linkage of the protein groups which are responsible for the reduction and stabilization of NSS. The reaction for the formation of silver metal from silver nitrate in the presence of alcohol or phenolic present in the BCLE can be represented as:
O stretching vibration of carbonyl and carboxylic group (1659 cm−1) and plane bending vibration of N–H group (610 cm−1) of amide I linkage of the protein peaks decrease or weaken. As indicated by the FT-IR data, the plant extract contains phyto-chemicals and functional groups like alcohol or phenol and amide-I linkage of the protein groups which are responsible for the reduction and stabilization of NSS. The reaction for the formation of silver metal from silver nitrate in the presence of alcohol or phenolic present in the BCLE can be represented as:
| 2AgNO3 + 2ROH → 2Ag0 + 2RO− + 2HNO3 |
The results suggest that phenolic compounds of BCLE extract can act as the reducing and stabilizing agent for the synthesis of NSS. During the formation of green synthesized NSS, it is expected that one end of the alcoholic or phenolic groups present in BCLE chemisorb on Ag0 while the other end of the alcoholic or phenolic groups, which is pointing away from the Ag0 surface stabilizes the NSS by strong electrostatic repulsion as shown in Scheme 2.
XRD is used for the phase identification and characterization of the crystal structure and composition of the NSS. XRD patterns for the prepared NSS are shown in Fig. 3a–c. The results reveal four sharp diffraction peaks at 2θ values: 37.89, 44.63, 64.72 and 77.69 which can be attributed to (1 1 1), (2 0 0), (2 2 0) and (3 1 1) crystallographic planes of face centered cubic (fcc) structure of metallic silver. The obtained results are good in agreement with reference to the unit cell of the fcc structure and is consistent with Joint Committee on Powder Diffraction Standards (JCPDS) data file [no. 04-0783]. The XRD pattern was taken for NSS synthesized at different time intervals of 10, 30 and 48 min. In addition to the Bragg peaks representative of NSS, additional peaks are also observed at (Fig. 3 curve a and b) 27.89, 32.24, 46.26, and 54.79. These peaks are due to the crystallization of bioorganic phases which are present in the extract and responsible for silver ions reduction and stabilization of resultant nanospheres. The results are consistent with previous studies reporting similar diffraction peaks for silver nanoparticles obtained by green synthesis.27
 | ||
| Fig. 3 XRD patterns for NSS synthesized at different time intervals (a) 10 min, (b) 30 min and (c) 48 min. | ||
The XRD pattern thus clearly illustrates that the NSS formed in this study are crystalline in nature. The formation of metallic silver is evident from four crystalline peaks and there does not appear any extra peak which indicates that there is no other impurity present as evidenced from Fig. 3 (curve c). As time increases, the formation of NSS planes increases and the unassigned peaks decrease and finally disappear. These results clearly suggest that the green synthesized NSS lattice is unaffected by other molecules in the plant extract. Among the lattice planes, the peak corresponding to (1 1 1) plane is more intense than other planes suggesting it as a predominant orientation. The width of the (1 1 1) peak was employed to calculate the average crystalline size of the NSS using the Scherrer formula. The calculated average size of the NSS is 21.72 nm, which precisely matches with the particle size obtained from HR-TEM image (Fig. 4a–c).
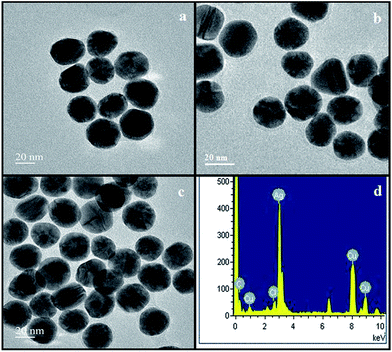 | ||
| Fig. 4 HR-TEM images of NSS synthesized at different time intervals (a) 10 min, (b) 30 min and (c) 48 min and (d) EDX spectrum of NSS. | ||
HR-TEM analysis is one of the most widely used techniques applied for the study of surface properties and morphology of nanomaterials. The surface morphology, size, shape and dispersion of biogenic NSS were confirmed by HR-TEM images of NSS synthesized at different time intervals of 10 min, 30 min and 48 min (Fig. 4a–c). The micrographs clearly indicate that the NSS possess homogeneous size distribution of nano-spheres with the size of 22 nm. As the time increases, the formation of NSS also increases. Fig. 4d shows the elemental analysis of the synthesized NSS by means of EDX which confirms the existence of Ag.
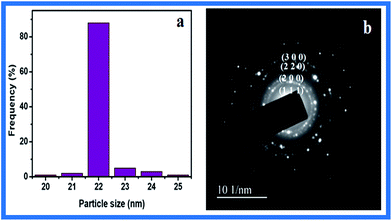
The average particle size of the NSS was calculated to be 22 nm by size distribution histogram as shown in (Fig. 5a) which is in agreement with the particle size calculated from XRD spectra. Furthermore Fig. 5b shows a SAED pattern recorded by directing the electron beam perpendicular to one of the individual nano-spherical particles. The characteristic bright circular fringes can be indexed to (1 1 1), (2 0 0), (2 2 0) and (3 1 1) of the pure face centered cubic (fcc) lattice structure.
Colorimetric sensing of Cd2+
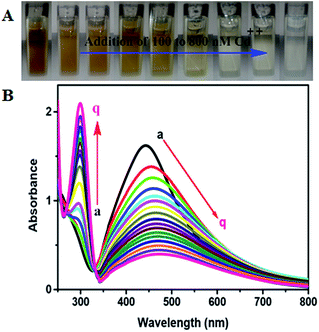
The colorimetric method has been extensively used for the determination of biological and toxic chemicals. Therefore, we have attempted to employ this method for the determination of Cd2+ using green synthesized NSS. The shift in the SPR band of the NSS is sensitive to the presence of adsorbed substances and as a result appreciable changes in color and optical properties of the NSS may occur. Studies have revealed that changes in the SPR of metal nanoparticles can be used for the detection of specific chemicals. The green synthesized NSS solution was pale brown in the absence of Cd2+ and when mixed with 100 μM concentrations of Cd2+, the SPR intensity decreases (Fig. 6) and color of the NSS solutions turns from brown to colorless as shown in Fig. 6 (inset). To evaluate the sensitivity of this method and investigate the minimum detectable concentration of Cd2+ in aqueous solution by color change of the system and monitoring the UV-visible absorbance values, different concentrations (0 to 800 × 10−9 mol L−1) of aqueous solution of Cd2+ were added to a solution of the NSS at room temperature as shown in Fig. 7A. The colloidal solution of NSS shows the SPR band at 435 nm (Fig. 7B curve a) and displays a pale brown color. After adding Cd2+ ion, the SPR intensity decreases accompanying the broadening and new peak appear at 297 nm (Fig. 7B (curves b–q)) and color changes from brown to colorless (Fig. 7A). The observed spectral and color changes are mainly due to the direct redox reaction between Ag0 and Cd2+ ions, where the NSS is oxidized to form Ag+ and Cd2+ ions are reduced to Cd atom.33 This was confirmed by HR-TEM, EDX and mapping analysis. The HR-TEM images obtained for green synthesized NSS before and after the addition of 800 nM Cd2+ are shown in Fig. 8. As can be seen, while well-defined NSS appears before addition (Fig. 8a), it disappears after the addition of Cd2+ (Fig. 8b), which directly evidences a redox reaction between Ag0 and Cd2+ ions, where the NSS is oxidized to form Ag+ and Cd2+ ions are reduced to Cd.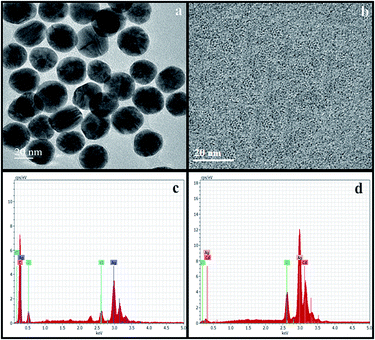 | ||
| Fig. 8 (a and b) TEM image of NSS before and after adding Cd2+ and (c and d) EDX spectra of NSS before and after adding Cd2+. | ||
Fig. 8c shows the elemental analysis of the green synthesized NSS by means of EDX which confirms the existence of Ag and Fig. 8d confirms the existence of Ag and Cd after sensing Cd2+. Fig. 9a shows the SEM image of NSS after addition of Cd2+ and Fig. 9b, a mapping image clearly demonstrates that the existence of Ag and Cd elements. As indicated in Fig. 10, the absorbance peak of NSS decreases by increasing the concentration of Cd2+ ion and there is a linear relationship (R2 = 0.9864) between the absorbance intensity changes and the concentration of Cd2+ ion over the range from 50 to 800 nM at 435 nm. The lowest limit of detection can be calculated as:
| LOD = 3S/b |
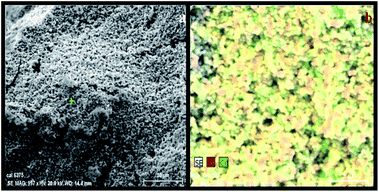 | ||
| Fig. 9 SEM image of NSS after addition of 800 nM Cd2+ (a) and SEM mapping image of NSS (red color) after addition of 800 nM Cd2+ (green color) (b). | ||
| S. No. | Materials | Size | Shape | Linearity coefficient (R2) | Linear range | LOD | References |
|---|---|---|---|---|---|---|---|
| 1 | Silver nanoparticles | 10 nm | — | 0.9980 | 5 mM to 2.5 μM | 2.00 × 10⁻⁵ | 37 |
| 2 | Silver nanoparticles | 8 nm | Spherical | 0.9936 | 0.05–1.1 μM | 3.00 × 10⁻⁹ | 38 |
| 3 | Gold nanoparticles | 10–30 nm | Spherical | 0.9606 | 0–0.4 mM | 0.07 × 10⁻³ | 39 |
| 4 | Gold nanoparticles | — | — | 1 to 50 μM | 5.00 × 10⁻⁶ | 40 | |
| 5 | Gold nanoparticles | 19 nm | Spherical | — | 60–480 nM | 30.0 × 10⁻⁹ | 41 |
| 6 | Gold nanoparticles | — | — | 0.9976 | 200–1700 nM | 100 × 10−9 | 42 |
| 7 | Gold nanoparticles | — | — | — | 0–3000 nM | 50.0 × 10⁻⁹ | 43 |
| 8 | Gold nanoparticles | 30 nm | Spherical | — | 0.5 to 16 μM | 16.6 × 10⁻⁹ | 44 |
| 9 | Nano-spherical silver | 22 nm | Spherical | 0.9864 | 50–800 nM | 1.50 × 10⁻⁹ | Present work |
Effect of interferences
The effect of various metal ions on the determination of Cd2+ was investigated by analyzing the sample solutions containing 800 nM Cd2+. The effect of interfering ions including alkali metals (Li+, Na+, K+), alkaline earth metals (Mg2+, Ca2+), and transition-metal ions (Mn2+, Ni2+, Cu2+, Co2+, Hg2+, Pb2+, As2+, Bi2+) on the color and SPR band of NSS solution is very negligible as indicated in Fig. 11a–c. The results demonstrate that the addition of a known concentration of Li+, Na+, K+, Mg2+, Ca2+, Mn2+, Ni2+, Cu2+, Co2+, Hg2+, Pb2+, As2+ and Bi2+ has no effect on the SPR band and color of NSS as compared to 800 nM Cd2+ which makes the color of solution to change from brown to colorless, indicating that the assay approach has very high selectivity and sensitivity toward Cd2+ and green synthesized NSS is not significantly sensitive to other transition, alkali and alkaline earth metal ions under similar conditions (Fig. 12). | ||
| Fig. 12 The colorimetric response of NSS to various transition, alkali and alkaline earth metal ions. | ||
Conclusion
In conclusion, we report a facile, green and one-pot synthesis of nano-spherical silver using Bombax ceiba leaf extract as both reducing and stabilizing agents. The synthesized NSS can be used as a colorimetric sensor for Cd2+ in aqueous medium. The synthesized NSS is highly selective and sensitive for the detection of Cd2+ in the presence of interfering metal ions. This colorimetric sensor can be used in detection of Cd2+ ions with the lowest detection limit (1.5 × 10⁻⁹ mol L−1) and also can be easily visualized with the naked eye or by using UV-visible spectrometer.References
- G. K. Derbha, A. K. Sing, U. S. Rai, E. Yu, H. Yu and P. C. Ray, J. Am. Chem. Soc., 2008, 130, 8038–8043 CrossRef PubMed.
- Agency for Toxic Substances and Disease Registry (ATSDR), Toxicological Profile for Cadmium, Draft for Public Comment, Public Health Service, U.S. Department of Health and Human Services, Atlanta, GA, 1997 Search PubMed.
- Y. Fang, X. Sun, W. Yang, N. Ma, Z. Xin, J. Fu, X. Liu, M. Liu, A. M. Mariga, X. Zhu and Q. Hu, Food Chem., 2014, 147, 147–151 CrossRef CAS PubMed.
- A. Sepúlveda, M. Schluep, F. G. Renaud, M. Streicher, R. Kuehr and C. Hageluken, Environ. Impact Assess. Rev., 2010, 30, 28–41 CrossRef.
- Y. Wang, L. Wang, T. Tian, X. Hu, Q. Xu and C. Yang, Anal. Methods, 2013, 5, 1856–1862 RSC.
- H. N. Kim, W. X. Ren, J. S. Kim and J. Yoon, Chem. Soc. Rev., 2012, 41, 3210–3244 RSC.
- EPA, The Provision and Quality of Drinking Water in Ireland: A Report for the Year 2008–2009, EPA, 2008, vol. 345, p. 102 Search PubMed.
- WHO, in Guidelines for Drinking Water Quality: Recommendations, WHO, Geneva, 2008, vol. 343, pp. 317–318 Search PubMed.
- R. Kumar and J. Chawla, Water Qual., Exposure Health, 2014, 5, 215–226 CrossRef CAS.
- A. Sheoran and V. Sheoran, Miner. Eng., 2006, 19, 105–116 CrossRef CAS.
- J. E. Fergusson, The toxicity of heavy elements to human beings in: The Heavy Elements: Chemistry, Environmental Impact and Health Effects, Pergamon Press, Oxford, 1989, p. 548 Search PubMed.
- R. S. Houk, Acc. Chem. Res., 1994, 27, 333–339 CrossRef CAS.
- V. Iyengar and J. Woittiez, Clin. Chem., 1988, 34, 474–481 CAS.
- S. Landsberger, S. Larson and D. Wu, Anal. Chem., 1993, 65, 1506–1509 CrossRef CAS PubMed.
- S. S. R. Dasary, Y. K. Jones, S. L. Barnes, P. C. Ray and A. K. Singh, Sens. Actuators, B, 2016, 224, 65–72 CrossRef CAS PubMed.
- S. Senthilkumar and R. Saraswathi, Sens. Actuators, B, 2009, 141, 65–75 CrossRef CAS.
- T. Cheng, Y. Xu, S. Zhang, W. Zhu, X. Qian and L. Duan, J. Am. Chem. Soc., 2008, 130, 16160–16161 CrossRef CAS PubMed.
- S. B. Maity, S. Banerjee, K. Sunwoo, J. S. Kim and P. K. Bharadwaj, Inorg. Chem., 2005, 54, 3929–3936 CrossRef PubMed.
- D. Hu, Z. Sheng, P. Gong, P. Zhang and L. Cai, Analyst, 2010, 135, 1411–1416 RSC.
- P. Mohanpuria, N. K. Rana and S. K. Yadav, J. Nanopart. Res., 2008, 10, 507–517 CrossRef CAS.
- K. N. Thakkar, S. S. Mhatre and R. Y. Parikh, Nanomedicine: Nanotechnology, Biology and Medicine, 2010, 6, 257–262 CrossRef CAS PubMed.
- A. J. Kora and R. B. Sashidhar, J. Antibiot., 2014, 1–10 Search PubMed.
- M. S. Akhtar, J. Panwar and Y. S. Yun, ACS Sustainable Chem. Eng., 2013, 1, 591–602 CrossRef CAS.
- C. Burda, X. Chen, R. Narayanan and M. A. El-Sayed, Chem. Rev., 2005, 105, 1025–1102 CrossRef CAS PubMed.
- L. M. Liz-Marzan, Langmuir, 2006, 22, 32–41 CrossRef CAS PubMed.
- K. L. Kelly, E. Coronado, L. L. Zhao and G. C. Schatz, J. Phys. Chem. B, 2003, 107, 668–677 CrossRef CAS.
- V. Balakumar and P. Prakash, RSC Adv., 2015, 5, 105917–105924 RSC.
- N. Erathodiyil and J. Y. Ying, Acc. Chem. Res., 2011, 44, 925–935 CrossRef CAS PubMed.
- C. M. Raucci, M. G. De, F. D. Gaaetano and A. J. Marotta, J. Mater. Sci.: Mater. Med., 2005, 16, 261–265 CrossRef PubMed.
- Y. W. Cao, R. Jin and C. A. Mirkin, J. Am. Chem. Soc., 2001, 123, 7961–7962 CrossRef CAS PubMed.
- P. Miao, K. Han, H. Sun, J. Yin, J. Zhao, B. Wang and Y. Tang, ACS Appl. Mater. Interfaces, 2014, 6, 8667–8672 CAS.
- P. Miao, T. Liu, X. Li, L. Ning, J. Yin and K. Han, Biosens. Bioelectron., 2013, 49, 20–24 CrossRef CAS PubMed.
- M. Annadhasan, T. Muthukumarasamyvel, V. R. Sankar Babu and N. Rajendiran, ACS Sustainable Chem. Eng., 2014, 2, 887–896 CrossRef CAS.
- S. Li, Y. Shen, A. Xie, X. Yu, L. Qiu, L. Zhang and Q. Zhang, Green Chem., 2007, 9, 852–858 RSC.
- R. Emmanuel, K. Chelladurai, S.-M. Chen, P. Selvakumar, S. Padmavathy and P. Prakash, J. Hazard. Mater., 2014, 279, 117–124 CrossRef CAS PubMed.
- A. Bankar, B. Joshi, A. R. Kumar and S. Zinjarde, Colloids Surf., A, 2010, 368, 58–63 CrossRef CAS.
- H. Li, Y. Yao, C. Han and J. Zhan, Chem. Commun., 2009, 4812–4814 RSC.
- W. Jin, P. Huang, F. Wu and L.-H. Ma, Analyst, 2015, 140, 3507–3513 RSC.
- N. Chen, J. Chen, J.-H. Yang, L.-Y. Bai and Y.-P. Zhang, J. Nanosci. Nanotechnol., 2016, 16, 840–843 CrossRef.
- Y. Guo, Y. Zhang, H. Shao, Z. Wang, X. Wang and X. Jiang, Anal. Chem., 2014, 86, 8530–8534 CrossRef CAS PubMed.
- A.-J. Wang, H. Guo, M. Zhang, D.-L. Zhou, R.-Z. Wang and J.-J. Feng, Microchim. Acta, 2013, 180, 1051–1057 CrossRef CAS.
- Y. Xue, H. Zhao, Z. Wu, X. Li, Y. He and Z. Yuan, Analyst, 2011, 136, 3725–3730 RSC.
- M. Zhang, Y.-Q. Liu and B.-C. Ye, Analyst, 2012, 137, 601–607 RSC.
- Y.-M. Sung and S.-P. Wu, Sens. Actuators, B, 2014, 201, 86–91 CrossRef CAS.
| This journal is © The Royal Society of Chemistry 2016 |


