High pressure studies of Ni3[(C2H5N5)6(H2O)6](NO3)6·1.5H2O by Raman scattering, IR absorption, and synchrotron X-ray diffraction
Junru Jianga,
Jianguo Zhang*b,
Peifen Zhuc,
Jianfu Lid,
Xiaoli Wangd,
Dongmei Lia,
Bingbing Liua,
Qiliang Cuia and
Hongyang Zhu*a
aState Key Laboratory of Superhard Materials, Jilin University, Changchun, Jilin 130012, China. E-mail: hongyangzhu@jlu.edu.cn; Fax: +86 43185168881; Tel: +86 43185168881
bState Key Laboratory of Explosion Science and Technology, Beijing Institute of Technology, Beijing, China. E-mail: zjgbit@bit.edu.cn
cDepartment of Physics and Engineering Physics, The University of Tulsa, Tulsa, OK 74104, USA
dInstitute of Condensed Matter Physics, Linyi University, Linyi, 276005, China
First published on 22nd June 2016
Abstract
Herein, we report the high-pressure studies of Ni3[(C2H5N5)6(H2O)6](NO3)6·1.5H2O (1) by in situ Raman scattering, infrared absorption, and synchrotron angle-dispersive X-ray diffraction techniques up to ∼22 GPa at room temperature. We assigned all the vibration modes of 1 at ambient conditions. Detailed spectroscopy analyses revealed a chemical transformation at ∼0.75 GPa and a phase transition at ∼4.7 GPa, which are related to the behaviors of energetic ligands and flexible structures. Upon compression, the distortion of the energetic ligand induced the disconnection of NH2 and the triazole ring at 0.75 GPa. Further analyses of the N–H vibration modes indicated the phase transition at 4.7 GPa accompanied with the rearrangement of hydrogen bonds. In addition, the lattice structure abnormally expanded above 8.6 GPa due to the deformation of nitrate ions and the extension of the triazole ring. This study helps to understand the properties and the behavior of energetic coordination complexes under high pressure.
Introduction
Energetic coordination complexes are a vibrant class of metal–organic hybrid materials with intriguing structures and unique properties that have attracted considerable interest among many disciplines.1–3 The wide variety of unique functional properties exhibits promising applications in the area of low signature propellant and pyrotechnic composition. Recently, nitrogen-rich energetic materials have attracted considerable attention as potential precursors to synthesize novel high energy density materials (HEDM) under high pressure.4–7 Coordination complexes, with nitrogen-rich heterocyclic groups and nontoxic metal centers, have become attractive candidates due to their flexible structures and favorable energetic properties.7 Furthermore, coordination complexes contain ligand and various supramolecular interactions, such as hydrogen bonds, CH⋯π or π⋯π stacking, van der Waals contacts or a combination of these, that intensively affect the properties of substances under high pressure.8–11 Previous high pressure studies on coordination complexes have found various phenomena, including piezochromism, isomerizations, and spin crossover effect.12–14 However, few high pressure studies of energetic coordination complexes have been reported, and high pressure studies of energetic coordination complexes have other problems that we need to resolve are as follows: (1) the behavior of energetic ligands under pressure and (2) the relationship between flexible structures and pressure. It is rather significant to explore the high-pressure behavior of the energetic coordination complexes, which may bring in some new structures and new properties in energetic materials for a broader range of applications.Ni3[(C2H5N5)6(H2O)6](NO3)6·1.5H2O (1) comprises metal Ni as the center cation and 3,4-diamino-1,2,4-triazole as a ligand and is coordinated by nitrates and water molecules forming a 3-D network of eco-friendly energetic coordination complexes. 1 crystallizes in a monoclinic structure with space group P21/n and four molecular moieties in the unit cell. The molecular structure and packing diagram of 1 are shown in Fig. 1. The 3,4-diamino-1,2,4-triazole ligand is one of the nitrogen-rich heterocyclic linkers, which has high enthalpy of formation and a compact structure.1 The bonding interaction is between the metal center and the organic linker. The average bond energies of C–N (273 kJ mol−1) and N–N (160 kJ mol−1) make a great contribution to the energetic characteristics of 1.15 In addition, 1 has intra- and inter-molecular hydrogen bonds between the nitrate ion and DATr (the abbreviation of 3,4-diamino-1,2,4-triazole) ligand, which can be considered as a model of hydrogen-bonded system.16 Herein, we investigate 1 by in situ Raman scattering, infrared absorption, and synchrotron angle-dispersive X-ray diffraction (ADXRD) techniques at room temperature up to ∼22 GPa. Detailed analyses on the vibrational assignment, the behaviors of the energetic ligand and nitrate ion under pressure, and the relationship between flexible structure and pressure at the vibrational spectra level are discussed and presented. The appearance of the expansion effect enables 1 to become a promising candidate in energetic materials.
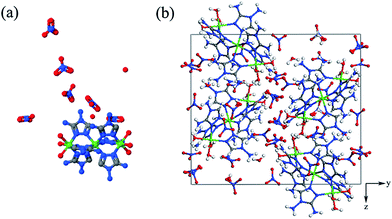 | ||
| Fig. 1 Molecular structure (a) and packing diagram (b) of 1. The green, grey, blue, red, and white spheres denote Ni, C, N, O, and H atoms, respectively. | ||
Experimental details
The sample was synthesized according to the literature.16 High-pressure was generated by a symmetric diamond anvil cell (DAC) with 300 μm culet diamonds. A T301 steel gasket was pre-indented to about 60 μm in thickness, and a 100 μm diameter hole was drilled in the gasket center to serve as a sample chamber. The pressures were calibrated by the ruby fluorescence R1 lines. For the Raman and ADXRD experiments, a mixture of methanol and ethanol with 4![[thin space (1/6-em)]](https://www.rsc.org/images/entities/char_2009.gif) :
:![[thin space (1/6-em)]](https://www.rsc.org/images/entities/char_2009.gif) 1 volume ratio was selected as the pressure-transmitting medium. Raman scattering spectra were obtained by a liquid nitrogen-cooled CCD camera equipped with an Acton SpectraPro 500i spectrometer with a 1800 groove per mm grating. The 532 nm wavelength line from the frequency-doubled diode-pumped neodymium–vanadate laser was applied as an excitation source. Infrared spectra were obtained by a Bruker Vertex 80V infrared spectrometer and KBr powder was used as a pressure-transmitting medium. The range of the mid-IR spectra was within 500–4000 cm−1 and the spectral resolution for all measurements was 2 cm−1. Ambient pressure XRD measurement was collected on a Shimadzu XRD-6000 instrument with Cu Kα radiation wavelength of 1.5406 Å. High pressure ADXRD measurements were conducted at beamline X17C of the National Synchrotron Light Source Brookhaven National Laboratory with a wavelength of 0.405238 Å. The diffraction patterns were collected using a MAR165 image plate detector. We analyzed the two-dimensional XRD images using FIT2D software. High-pressure structural information was analyzed by the Pawley refinement method.
1 volume ratio was selected as the pressure-transmitting medium. Raman scattering spectra were obtained by a liquid nitrogen-cooled CCD camera equipped with an Acton SpectraPro 500i spectrometer with a 1800 groove per mm grating. The 532 nm wavelength line from the frequency-doubled diode-pumped neodymium–vanadate laser was applied as an excitation source. Infrared spectra were obtained by a Bruker Vertex 80V infrared spectrometer and KBr powder was used as a pressure-transmitting medium. The range of the mid-IR spectra was within 500–4000 cm−1 and the spectral resolution for all measurements was 2 cm−1. Ambient pressure XRD measurement was collected on a Shimadzu XRD-6000 instrument with Cu Kα radiation wavelength of 1.5406 Å. High pressure ADXRD measurements were conducted at beamline X17C of the National Synchrotron Light Source Brookhaven National Laboratory with a wavelength of 0.405238 Å. The diffraction patterns were collected using a MAR165 image plate detector. We analyzed the two-dimensional XRD images using FIT2D software. High-pressure structural information was analyzed by the Pawley refinement method.
Results and discussion
A. The assignment of vibrational modes
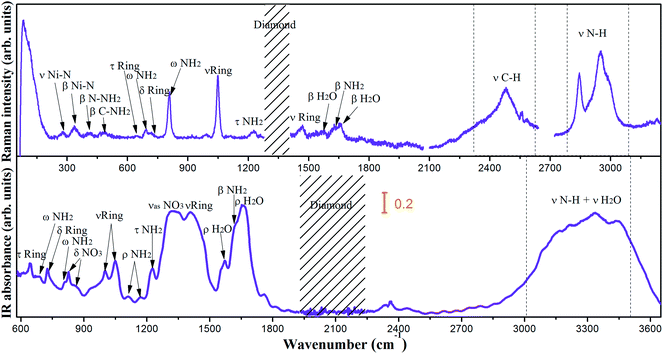
The vibrational modes of groups have approximate characteristic frequencies in different chemical environments. Thus, the internal vibrations of 1 can be assigned on the basis of the corresponding vibrations of the DATr and the nitrate ions. The Raman and mid-IR spectra at ambient pressure are depicted in Fig. 2 and the corresponding assignments are summarized in Table 1.| Raman frequencies (cm−1) | Infrared frequencies (cm−1) | Assignment |
|---|---|---|
| a τ, twisting; β, bending; δ, out-of-plane bending; ω, wagging; ν, stretching; ρ, rocking; νas, asymmetric stretching. | ||
| 280 | ν Ni–N | |
| 336 | β Ni–N | |
| 412 | β N–NH2 | |
| 481 | β C–NH2 | |
| 646 | 643 | δ ring |
| 691 | 681 | ω NH2 |
| 722 | 727 | δ ring |
| 807 | 808 | ω NH2 |
| 826 | δ NO3 | |
| 856 | δ NO3 | |
| 1000 | ν ring | |
| 1048 | 1049 | ν ring |
| 1113 | ρ NH2 | |
| 1169 | ρ NH2 | |
| 1226 | 1226 | τ NH2 |
| 1310 | νas NO3 | |
| 1352 | νas NO3 | |
| 1464 | 1408 | ν ring |
| 1554 | 1554 | β H2O |
| 1573 | 1572 | β H2O |
| 1629 | 1623 | β NH2 |
| 1656 | 1659 | β H2O |
| 2480 | ν C–H | |
| 2553 | ν C–H | |
| 2560 | ν C–H | |
| 2581 | ν C–H | |
| 2843 | ν N–H | |
| 2948 | ν N–H | |
| 2989 | ν N–H | |
| 3089 | ν N–H | |
| 3154 | ν H2O | |
| 3213 | ν H2O | |
| 3277 | ν H2O | |
| 3328 | ν H2O | |
| 3439 | ν H2O | |
According to the vibrational spectra of 1,2,4-triazole and 3,5-diamino-1,2,4-triazole, the N–H stretching vibrations occur in a strong and broad region of 2500–3500 cm−1.17–19 As shown in Fig. 2, the N–H stretching vibrations appear at 2843/2948/2989 cm−1 in the Raman spectra and mix with the H2O stretching vibrations (3000–3500 cm−1) in the IR spectra. The C–H stretching vibrations are observed at 2480–2581 cm−1 in the Raman spectra that show pronounced shifts of the hydrogen-bond species.20 The infrared spectra at 1623 cm−1 and the Raman spectra at 1629 cm−1 are assigned to the bending vibrations of the NH2 group, which are in accordance with the region of 1600–1700 cm−1 in the literature.21 In addition, another characteristic frequency of the NH2 group appeared at 1226 cm−1 in the Raman and IR spectra, which is attributed to the twisting modes. It was reported that the NH2 wagging mode in 3,5-diamino-1,2,4-triazole is at 668 cm−1.19 The observed Raman peaks at 691 cm−1 and infrared spectra at 681 cm−1 correspond to the NH2 wagging modes, in good agreement with the results in literature. The ring out of plane bending modes is at 643/727 cm−1 in the infrared spectra and 646/722 cm−1 in the Raman spectra. The ring stretching modes are at 1000/1049/1408 cm−1 in the infrared spectra and 1048/1464 cm−1 in the Raman spectra, respectively. The infrared peaks at 1113/1169 cm−1 correspond to the NH2 rocking mode, which are in accordance with the peak of 1123 cm−1 in 3,5-diamino-1,2,4-triazole.
Free nitrate ion has a molecular point group of D3h with A1 Raman active (symmetric stretching) only, A2 IR active (out of plane bending) only, and 2E both Raman and IR active (asymmetric stretching and bending).22,23 In 1, the out of plane bending modes are observed at 826/856 cm−1 in the infrared spectra. The peaks at 1310/1352 cm−1 in the infrared spectra are ascribed to the asymmetric stretching mode. The asymmetric bending mode at around 680 cm−1 is in the spectra region of NH2 wagging mode. The H2O vibrational modes are associated with the hydrogen bonds in the inter- and intra-molecular interactions. The observed infrared peaks at 1554/1573/1656 cm−1 and Raman peaks at 1554/1572/1659 cm−1 are found to be the H2O bending modes.
B. Raman spectra under compression
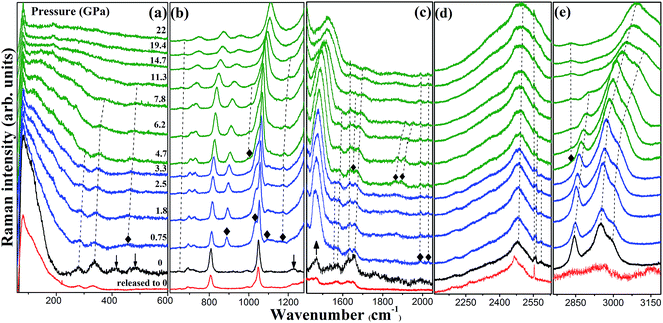
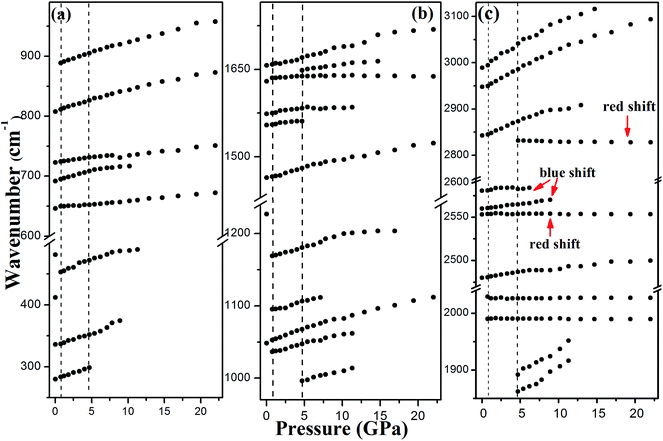
The Raman internal modes reflect local variations of the chemical environment around specific groups. The pressure dependence of Raman spectra and their frequency shifts versus pressure is shown in Fig. 3 and 4.As shown in Fig. 3, the changes of the vibration modes occur in the pressure region of 0.75–1.8 GPa. At this pressure region, the N–NH2 and C–NH2 bending and NH2 twisting modes, marked by the down arrows in the plot of 0 GPa, disappeared suggesting the disconnection of NH2 and triazole ring. In addition, the intensity of the ring-stretching mode (at 1464 cm−1 labeled with up arrow) increased. This indicates that the molecular structure of the triazole ring changed from a nonplanar to a planar geometry; a similar phenomenon is also observed in other organic materials.24,25 Changes in the molecular structure of triazole ring are likely to evolve into a distorted state of DATr ligand, as shown in Fig. 5. The new peaks at 888/1035 cm−1 are in the spectra region of triazole ring vibrations and others at 1095/1167 cm−1 are assigned to NH2 vibration modes, which result from the distortion of the DATr ligand. Therefore, we can infer that the distortion of the DATr ligand leads to a chemical transformation, which involves breaking of bonds between NH2 and triazole ring.
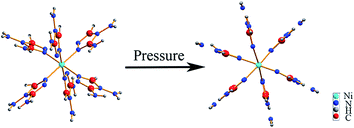 | ||
| Fig. 5 The schematic (view along the direction of Ni3) of the separation of NH2 and triazole ring and the change of molecular structure of the triazole rings from a nonplanar to a planar at 0.75 GPa. | ||
Other new vibration modes appear at 4.7 GPa, indicating the existence of a phase transition. The new peaks at 1648 and 2831 cm−1 are in the spectral region of NH2 bending and NH2 stretching modes, respectively, implying the construction of new N–H⋯O hydrogen bonds.26,27 Because NH2 and triazole ring are separated after the first phase transition, the NH2 groups have more freedom to rearrange the hydrogen bonds in the crystal. Then, new hydrogen bonds generate and the phase transition begins. The intensity of the new NH2 stretching mode is enhanced progressively, whereas the original NH2 stretching modes broadens and weakens with increasing pressure. The changes of the N–H vibration modes can be explained by the rearrangement of hydrogen bonds, which lead to the phase transition at 4.7 GPa. The evolution of the vibration modes of phase II does not reveal any remarkable changes from 4.7 to 22 GPa, suggesting that phase II is stable up to 22 GPa, i.e., the highest pressure of this experiment. Phase II has similar profiles as phase I, revealing that the phase transition is not reconstructed and the two phases are correlative. In Fig. 4c, one of the C–H stretching modes exhibits red shift and the other two show blue shift with increasing pressure. It means that the C–H⋯O hydrogen bond in the crystal has two forms, weak and strong.28 Moreover, the new NH2 stretching mode exhibits red shift under pressure, illustrating that the new N–H⋯O hydrogen bond is weak or of medium strength. In the decompression process to 0 GPa, the vibration modes recovered, which signifies that the transition is reversible.
C. Infrared spectra under compression
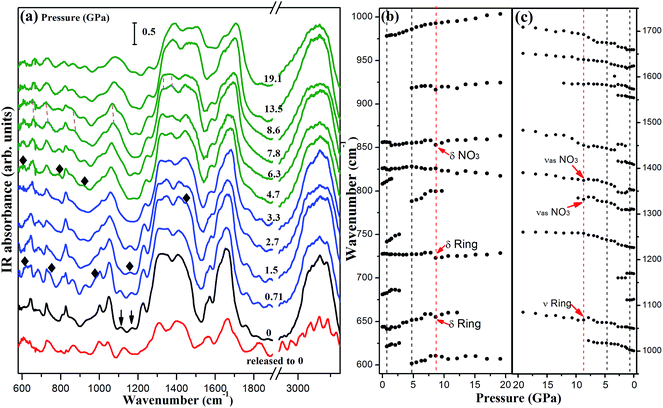
Because the mid-infrared spectra are more sensitive to the internal vibrations of the organic ligand, they offer more structural information on the organic linker. We carried out the high pressure mid-infrared absorption measurement for further monitoring the behaviors of flexible structure and energetic ligand in 1. Selected infrared spectra and their frequency shifts versus pressure are summarized in Fig. 6. In Fig. 6a, some peaks disappear and new peaks emerge as marked by the down arrows and solid diamonds, respectively, manifesting a chemical transformation in the pressure region of 0.71–1.5 GPa. New peaks at 977/1449 and 1157 cm−1 are ascribed to the ring stretching vibration mode and NH2 rocking vibration mode, respectively, which is consistent with Raman result of the distortion of DATr ligand. With increasing pressure to 4.7 GPa, the appearance of new peaks indicate the occurrence of a phase transition in accordance with the proposed phase transition in Raman spectra.Importantly, several vibration modes of NO3 and triazole ring labeled with red arrows shift to lower frequencies at 8.6 GPa in Fig. 6b and (c). The vibration modes of NO3 exhibit an abnormal red shift, implying the deformation of the nitrate ion. At the same time, the red shifts of triazole ring stretching vibration modes indicate that the triazole ring is extended. From the Raman spectra analyses, we know that the triazole ring is difficult to be compressed under the actions of a variety of hydrogen bonds. After the phase transition, more hydrogen bonds were constructed, which play an important role in the crystal, resulting in the extension of the triazole ring instead of contraction. Thus, the infrared data suggest that 1 undergoes an expansion effect at 8.6 GPa due to the deformation of nitrate ions and the extension of triazole ring.
D. High pressure X-ray diffraction pattern
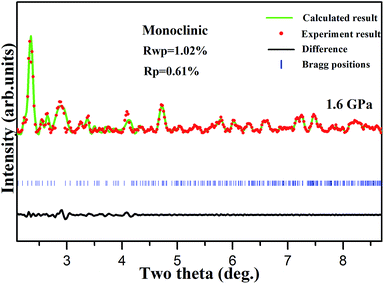
To obtain the structural information of 1, we performed high pressure synchrotron angle-dispersive X-ray diffraction (ADXRD) experiment. Fig. 7 shows the representative diffraction patterns from ambient pressure up to 21.8 GPa. At 0.77 GPa, the splitting of (020) Bragg peak implies the beginning of chemical transformation, which is directly related to the distortion of the energetic ligand along b-axis. The (101) Bragg peak becomes asymmetric and a peak emerges with increasing pressure up to 1.6 GPa and the transformation completes at this pressure. This is consistent with the spectra results. All indexing solutions led to a monoclinic structure, and the Pawley refinement result is shown in Fig. 8. No obvious change of the XRD pattern at 4.7 GPa was observed, whereas in pressure, a phase transition occurred in the vibrational spectra. This is because the phase transition is isostructural and related to the rearrangement of hydrogen bonds, which is not enough to cause obvious structural phase transition. In addition, X-ray is not sensitive to light elements, such as C, H, O, and N, in the present material. Below 8.9 GPa, all the diffraction peaks present blue shift with increasing pressure arising from the contraction of the cell volume and the corresponding d-spacing. Nevertheless, with further compression, the Bragg peaks start to shift toward low angles until the highest pressure of 21.8 GPa. This means that the cell volume and the lattice start to increase with compression and the structure tends to expand gradually. The abnormal expansion of structure confirms the red shift of nitrate ion and triazole ring vibration modes in mid-infrared spectra.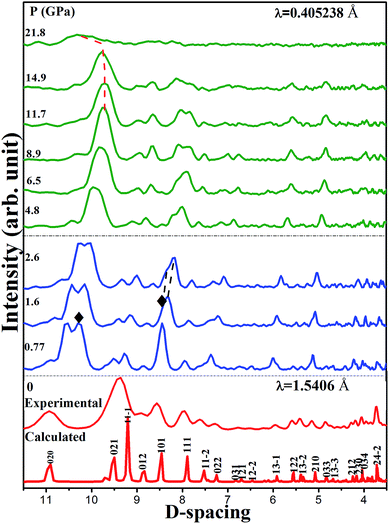 | ||
| Fig. 7 Representative synchrotron X-ray diffraction patterns of 1 at different pressures. The solid diamonds (◆) denote the new peaks. | ||
Conclusions
In summary, we studied 1 using Raman and infrared spectroscopy measurements and ADXRD techniques. Two transitions and an expansion effect in 1 to extreme compression were observed. The whole fundamental vibrational modes of 1 at ambient pressure were assigned. The chemical transformation in the pressure range of 0.75–1.8 GPa was induced by the distortion of the energetic ligand. The separation of triazole ring and NH2 group is crucial for hydrogen bonds to rearrange in the crystal. The changes of the NH2 vibration modes suggest the rearrangement of the hydrogen bonds leading to the phase transition at 4.7 GPa. Furthermore, XRD results indicate that 1 underwent an expansion effect at 8.6 GPa and this confirms the red shifts of the NO3 and triazole ring vibration modes in the infrared spectra. A growing number of intermolecular interactions in the crystal prompt the deformation of nitrate ion and the extension of triazole ring, resulting in the expansion effect of the crystal structure.Acknowledgements
This study is supported by the National Natural Science Foundation of China (11304111, 11304139), the Graduate Innovation Fund of Jilin University (2015080), and the Natural Science Foundation of Shandong Province (ZR2014JL005). ADXRD measurements were performed at beamline X17C of the National Synchrotron Light Source, Brookhaven National Laboratory.References
- J. G. Haasnoot, Coord. Chem. Rev., 2000, 200–202, 131–185 CrossRef CAS.
- S. Jurisson, D. Berning, W. Jia and D. Ma, Chem. Rev., 1993, 93, 1137–1158 CrossRef CAS.
- C. A. Daul and I. Ciofini, Coord. Chem. Rev., 2003, 238–239, 187–209 Search PubMed.
- C. Ji, R. Zheng, D. Hou, H. Zhu, J. Wu, M. C. Chyu and Y. Ma, J. Appl. Phys., 2012, 111, 112613 CrossRef.
- H. Zhu, F. Zhang, C. Ji, D. Hou, J. Wu, T. Hannon and Y. Ma, J. Appl. Phys., 2013, 113, 033511 CrossRef.
- D. Li, X. Wu, J. Jiang, X. Wang, J. Zhang, Q. Cui and H. Zhu, Appl. Phys. Lett., 2014, 105, 071903 CrossRef.
- M. A. Petrie, J. A. Sheehy, J. A. Boatz, G. Rasul, G. K. S. Prakash, G. A. Olah and K. O. Christe, J. Am. Chem. Soc., 1997, 119, 8802–8808 CrossRef CAS.
- X. Wu, F. Ma, C. Ma, H. Cui, Z. Liu, H. Zhu, X. Wang and Q. Cui, J. Chem. Phys., 2014, 141, 024703 CrossRef PubMed.
- X. Wu, H. Cui, J. Zhang, R. Cong, H. Zhu and Q. Cui, Appl. Phys. Lett., 2013, 102, 121902 CrossRef.
- Z. Wang, C. Schliehe, T. Wang, Y. Nagaoka, Y. C. Cao, W. A. Bassett, H. Wu, H. Fan and H. Weller, J. Am. Chem. Soc., 2011, 133, 14484–14487 CrossRef CAS PubMed.
- Z. Wang, X. Wen, R. Hoffmann, J. Son, R. Li, C. Fang, D. Smilgies and T. Hyeon, PANS, 2010, 107, 17119–17124 CrossRef CAS PubMed.
- H. J. Shepherd, P. Rosa, L. Vendier, N. Casati, J. F. Letard, A. Bousseksou, P. Guionneau and G. Molnar, Phys. Chem. Chem. Phys., 2012, 14, 5265–5271 RSC.
- H. C. Drickamer and K. L. Bray, J. Phys. Chem., 1991, 95, 559–562 CrossRef.
- K. L. Bray and H. G. Drickamer, Acc. Chem. Res., 1990, 23, 51–65 Search PubMed.
- B. Wu, T. Zhang, Y. Li, W. Tong, Z. Zhou, J. Zhang and Y. Li, Z. Anorg. Allg. Chem., 2013, 639, 2209–2215 CrossRef CAS.
- X. Jin, J. Zhang, C. Xu, X. Yin, P. He and Q. Qin, J. Coord. Chem., 2014, 67, 3202–3215 CrossRef CAS.
- D. Bougeard, N. L. Calve, B. S. Roch and A. Novak, J. Chem. Phys., 1976, 64, 5152 CrossRef CAS.
- V. K. Kumar, G. Keresztury, T. Sundius and R. J. Xavier, Spectrochim. Acta, Part A, 2005, 61, 261–267 CrossRef PubMed.
- L. Guennoun, J. E. Jastimi, F. Guedira, K. Marakchi, O. K. Kabbaj, A. E. Hajji and S. Zaydoun, Spectrochim. Acta, Part A, 2011, 78, 347–353 CrossRef CAS PubMed.
- G. Varsányi, Assignments for Vibrational Spectra of Seven Hundred Benzene Derivatives, Halsted Press, 1974 Search PubMed.
- S. George, Infrared and Raman Characteristic Group Frequencies, John Wiley & Sons Ltd, 2001 Search PubMed.
- J. T. Kloprogge, D. Wharton, L. Hickey and R. L. Frost, Am. Mineral., 2002, 87, 623–629 CrossRef CAS.
- B. Kim, P. L. Hunter and H. S. Johnston, J. Chem. Phys., 1992, 96, 4057 CrossRef CAS.
- S. Guha, W. Graupner, R. Resel, M. Chandrasekhar, H. R. Chandrasekhar, R. Glaser and G. Leising, Phys. Rev. Lett., 1999, 82, 3625–3628 CrossRef CAS.
- J. Jiang, X. Wu, D. Li, B. Ma, R. Liu, X. Wang, J. Zhang, H. Zhu and Q. Cui, J. Phys. Chem. B, 2015, 119, 513–518 CrossRef CAS PubMed.
- E. C. Spencer, M. S. Kiran, W. Li, U. Ramamurty, N. L. Ross and A. K. Cheetham, Angew. Chem., Int. Ed., 2014, 53, 5583–5586 CrossRef CAS PubMed.
- Q. Li, S. Li, K. Wang, X. Li, J. Liu, B. Liu, G. Zou and B. Zou, J. Chem. Phys., 2013, 138, 214505 CrossRef PubMed.
- M. Linton and S. D. Hamann, Aust. J. Chem., 1976, 29, 1641–1647 CrossRef.
| This journal is © The Royal Society of Chemistry 2016 |

