A highly sensitive benzimidazole-based chemosensor for the colorimetric detection of Fe(II) and Fe(III) and the fluorometric detection of Zn(II) in aqueous media†
Yong Sung Kim,
Jae Jun Lee,
Sun Young Lee,
Tae Geun Jo and
Cheal Kim*
Department of Fine Chemistry, Seoul National University of Science and Technology, Seoul 139-743, Korea. E-mail: chealkim@seoultech.ac.kr; Fax: +82-2-973-9149; Tel: +82-2-970-6693
First published on 20th June 2016
Abstract
A new dual chemosensor 1 for the colorimetric detection of Fe2+/3+ and the fluorometric detection of Zn2+ has been developed and characterized. The sensor 1 has proven to be highly selective to Fe2+/3+ with a color change from colorless to dark green in a near-perfect aqueous solution. 1 had low detection limits (1.21 μM for Fe3+ and 1.18 μM for Fe2+), which are lower than the World Health Organization guideline (5.36 μM) for drinking water. Moreover, 1 showed a selective detecting ability for Zn2+ by ‘OFF–ON’ fluorescent response in aqueous solution. The detection limit (1.05 μM) of 1 for Zn2+ was much lower than World Health Organization guideline (76 μM) for drinking water. Interestingly, it could be recycled simply through treatment with an appropriate reagent such as EDTA (ethylenediaminetetraacetic acid). The sensing mechanism of 1 for Zn2+ was explained by the theoretical calculations. In particular, the sensor 1 could be used to quantify iron and zinc in water samples.
1. Introduction
The development of colorimetric and fluorescent sensors for biologically active metal ions has attracted a great deal of attention due to their potential applications in chemistry, life science, medicine and biotechnology.1–6 In addition, colorimetric and fluorescent methods in conjunction with sensors are attractive approaches for the measurement of metal ions because of their visual simplicity, instant response, as well as on site and real time monitoring.2–4Iron is one of the most essential metal ions and plays a pivotal role for many living organisms by participating in a wide range of metabolic processes such as cellular metabolism and enzyme catalysis.7–9 Especially, iron acts as an oxygen carrier in hemoglobin and is involved in several electron transfer reactions.10 Fe3+ deficiency is the most common cause of anemia in the world.11 Based on the various functions of iron, detecting traces of iron in medicinal and environmental chemistry and in biology is an important topic.12,13
In human body zinc is the second most abundant element after iron.14–16 Zn2+ plays pivotal roles in numerous biological processes including brain activity, gene transcription, and immune function, etc.17–20 However, excessive Zn2+ ion would cause imbalance in cellular processes, resulting in neurodegenerative diseases such as Menkes and Wilson diseases, Alzheimer's disease, Parkinson's disease, prostate cancer and diabetes.21–24 Therefore, several studies on improving the sensitivity and selectivity of fluorescent probes for Zn2+ have been reported in the literatures.25–31 In particular, the development of chemosensors that can discriminate Zn2+ from Cd2+ is still a huge challenge as they are in the same group of the periodic table and have similar properties.32–34 Thus, low cost and easily prepared Zn2+ fluorescence chemosensors are needed for convenience.35–42
Benzimidazole derivatives provide a good possibility to chelation with transition metal ions, which displays excellent fluorogenic properties.43–45 Also, 4-diethylaminosalicylaldehyde moiety is a well-known fluorophore and many chemosensors with this moiety are water-soluble.46,47 Therefore, we designed and synthesized a new chemosensor 1 based on the benzimidazole and 4-diethylaminosalicylaldehyde moieties, and tested its sensing ability to various metal ions.
Herein, we report a dual chemosensor 1 based on benzimidazole and 4-diethylaminosalicylaldehyde, which can be used for chromogenic and fluorescent recognition. Receptor 1 could detect Fe2+ and Fe3+ by color change from colorless to dark green in a near-perfect aqueous environment, and showed a fluorescent response toward Zn2+ in aqueous media. In order to understand their sensing mechanisms, various analytical studies such as Job plot, UV-vis titration, ESI-mass spectrometry analysis and 1H NMR titration were carried out.
2. Results and discussion
2.1. Synthesis
A new chemosensor 1 was obtained by the condensation reaction of 2-(aminomethyl)benzimidazole dihydrochloride with 4-diethylaminosalicylaldehyde in methanol at room temperature (Scheme 1), and characterized by 1H NMR, 13C NMR, ESI-mass spectrometry analysis and elemental analysis.2.2. Colorimetric sensing of 1 for iron
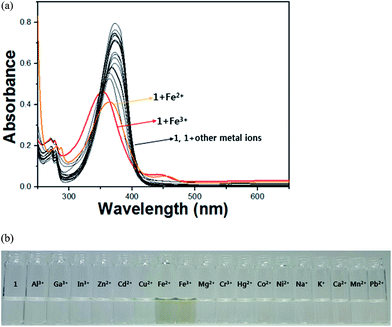
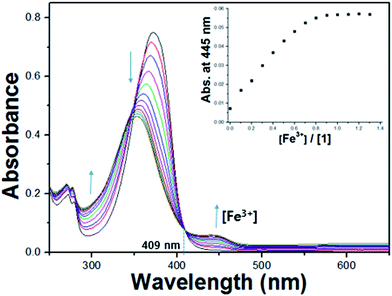
The colorimetric selective sensing abilities of receptor 1 with various metal ions in bis-tris buffer solution (10 mM, pH 7.0) were monitored by UV-vis absorption spectrometry (Fig. 1a). Only the addition of iron(II) and iron(III) ions induced distinct spectral changes while other metal ions such as Al3+, Ga3+, In3+, Zn2+, Cd2+, Cu2+, Mg2+, Cr3+, Hg2+, Co2+, Ni2+, Na+, K+, Ca2+, Mn2+ and Pb2+ did induced little or small spectral changes. Consistent with the change of the UV-vis spectra, the solution colors of 1 in the presence of the iron(II) and iron(III) ions changed immediately from colorless to dark green (Fig. 1b). This result indicated that receptor 1 can serve as a potential candidate of a “naked-eye” chemosensor for iron(II) and iron(III) in aqueous solution. These peaks (445 nm) with molar extinction coefficients in the thousands, 2.6 × 10³ M−1 cm−1 (ε445 nm) for Fe2+ and 3.0 × 10³ M−1 cm−1 (ε445 nm) for Fe3+, are too large to be Fe based d–d transition. Therefore, the peaks might be attributed to a metal-to-ligand charge-transfer (MLCT),48 which is responsible for the dark green color of the solution.UV-vis spectral variation of receptor 1 was monitored during titration with different concentrations of Fe3+ (Fig. 2). Upon the addition of Fe3+ to the solution of 1, the absorbance at 380 nm decreased significantly, while the one at 445 nm increased up to 1.0 equiv. of Fe3+, which induced a color change from colorless to dark green. An isosbestic point was observed at 409 nm, indicating the formation of the only one product.
To examine the ratio of the complexation of 1 with Fe3+, the Job plot49 was established from UV-vis spectra of 1 and Fe3+. As shown in Fig. S1,† the result indicated a 2![[thin space (1/6-em)]](https://www.rsc.org/images/entities/char_2009.gif) :
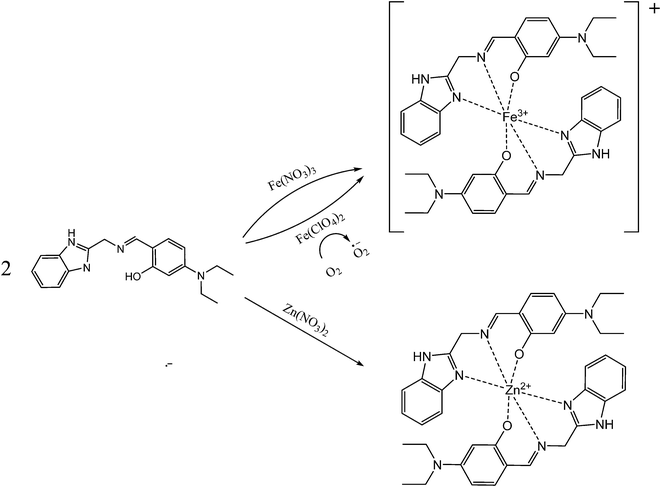
:![[thin space (1/6-em)]](https://www.rsc.org/images/entities/char_2009.gif) 1 binding interaction between the receptor 1 and Fe3+, which was further confirmed by ESI-mass spectrometry analysis. The positive ion mass spectrum of 1 upon the addition of 1 equiv. of Fe3+ indicated the formation of the 2·1 + Fe3+–2H+ complex [m/z: 698.30; calcd, 698.28] (Fig. 3). Based on the UV-vis titration, Job plot and ESI-mass analysis, we propose the sensing mechanism of Fe3+ by 1, as shown in Scheme 2.
1 binding interaction between the receptor 1 and Fe3+, which was further confirmed by ESI-mass spectrometry analysis. The positive ion mass spectrum of 1 upon the addition of 1 equiv. of Fe3+ indicated the formation of the 2·1 + Fe3+–2H+ complex [m/z: 698.30; calcd, 698.28] (Fig. 3). Based on the UV-vis titration, Job plot and ESI-mass analysis, we propose the sensing mechanism of Fe3+ by 1, as shown in Scheme 2.
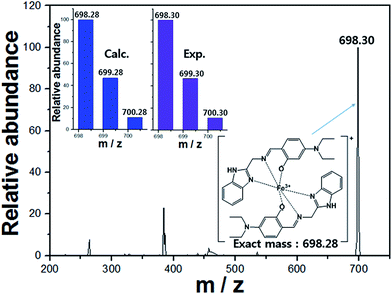 | ||
| Fig. 3 Positive-ion electrospray ionization mass spectrum of 1 (0.1 mM) upon addition of Fe3+ (0.1 mM). | ||
On the basis of the UV-vis titration of 1 with Fe3+, the association constant (K) of 1 with Fe3+ was found to be 6.0 × 10⁹ M−1 by using Li's equation (Fig. S2†).50 The detection limit51 (DL) of receptor 1 was calculated to be 1.18 μM for the Fe3+ (DL = 3σ/k, k = slope, σ is standard deviation) (Fig. S3†). DL of 1 for Fe3+ is lower than that (5.36 μM) recommended by WHO in drinking water.
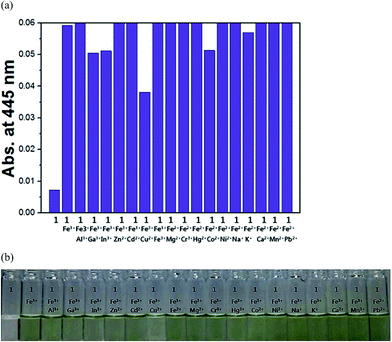
To examine the interference of other metal ions on Fe3+–2·1 complexation, the competition experiments were performed in the presence of Fe3+ mixed with other metal ions such as Al3+, Ga3+, In3+, Zn2+, Cd2+, Cu2+, Mg2+, Cr3+, Hg2+, Co2+, Ni2+, Na2+, K+, Ca2+, Mn2+, and Pb2+ (Fig. 4). Upon the addition of 1.0 equiv. of Fe3+ ion in the presence of the same concentration of other metal ions, the coexistent metal ions did not interfere with naked-eye detection of Fe3+ by the receptor 1 in aqueous media, while Cu2+ inhibited slightly.
The reversibility of the chemosensor is one of the essential aspects for sensor applications. Therefore, we performed the reversibility of receptor 1 by the alternate addition of Fe3+ and a metal chelator DFO (deferoxamine) (Fig. S4†). The Fe3+–2·1 complex was reversible with DFO for several cycles.
The effect of pH on the absorption response of receptor 1 to Fe3+ ions was investigated in the pH range of 2 to 12 (Fig. 5). The color of the 1–Fe3+ complex was intense and stable between pH 6 and pH 11.
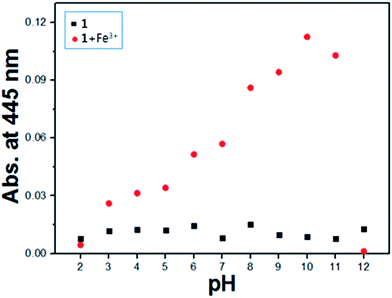 | ||
| Fig. 5 Absorbance (445 nm) of Fe3+–2·1 complex at different pH values (2–12) in bis-tris buffer solution (10 mM, pH 7.0). | ||
In order to examine the applicability of the chemosensor 1 in environmental samples, we constructed a calibration curve for the determination of Fe3+ (Fig. S5†), which exhibited a good linear relationship between the UV-vis intensity of 1 and Fe3+ concentration (0–5.0 μM) with a correlation coefficient of R2 = 0.9934 (n = 3). Then, the chemosensor was applied for the determination of iron in water samples which were prepared by adding various metal ions known as being in industrial processes into deionized water. The results were summarized in Table 1, which exhibited a satisfactory recovery and R.S.D. values for the water samples.
| Sample | Fe(III) added (μmol L−1) | Fe(III) found (μmol L−1) | Recovery (%) | R.S.D. (n = 3) (%) |
|---|---|---|---|---|
| a Synthesized by deionized water, 6.00 μmol L−1 Zn(II), 10 μmol L−1 Cd(II), Pb(II), Na(I), K(I), Ca(II), Mg(II). Conditions: [1] = 10 μmol L−1 in bis-tris buffer solution (10 mM, pH 7.0). | ||||
| Water samplea | 4.00 | 3.66 | 91.5 | 1.6 |
Next, UV-vis titrations of 1 with Fe2+ were performed to understand the binding property of 1 with Fe2+ (Fig. S6†). The results were nearly identical to those obtained in the sensing test of 1 with Fe3+. Based on these results and our previous study, we propose that as soon as Fe2+ reacts with 1, Fe2+ of the 2·1–Fe2+ complex might be oxidized to Fe3+. To prove for the oxidation of Fe2+ to Fe3+, we carried out ESI-mass spectrometry analysis (Fig. S7†). The positive-ion mass spectrum of 1 upon the addition of 1 equiv. of Fe2+ showed similar ESI-mass patterns as shown in the Fe3+–2·1 complex.
Stoichiometry of the 1 with Fe2+ ion was determined by Job plot which revealed a 2![[thin space (1/6-em)]](https://www.rsc.org/images/entities/char_2009.gif) :
:![[thin space (1/6-em)]](https://www.rsc.org/images/entities/char_2009.gif) 1 ratio as shown in the Fe3+–2·1 complex (Fig. S8†). Based on the UV-vis titration, Job plot and ESI-mass analysis, we also propose the sensing mechanism of Fe2+ by 1, as shown in Scheme 2. Based on UV-vis titration, the association constant (K) of 1 with Fe2+ ion was calculated as 3.0 × 10⁹ using Li's equation50 (Fig. S9†), which is nearly identical to that of the 1–Fe3+ complex. The detection limit51 of receptor 1 as a colorimetric sensor for the analysis of Fe2+ ions was found to be 1.21 μM (Fig. S10†), which is also nearly close to that of the Fe3+–2·1 complex.
1 ratio as shown in the Fe3+–2·1 complex (Fig. S8†). Based on the UV-vis titration, Job plot and ESI-mass analysis, we also propose the sensing mechanism of Fe2+ by 1, as shown in Scheme 2. Based on UV-vis titration, the association constant (K) of 1 with Fe2+ ion was calculated as 3.0 × 10⁹ using Li's equation50 (Fig. S9†), which is nearly identical to that of the 1–Fe3+ complex. The detection limit51 of receptor 1 as a colorimetric sensor for the analysis of Fe2+ ions was found to be 1.21 μM (Fig. S10†), which is also nearly close to that of the Fe3+–2·1 complex.
On the other hand, we carried out the FT-IR measurements for 1, Fe2+–2·1, Fe3+–2·1 and Zn2+–2·1 species (Fig. S11†), in order to further examine a possibility for the oxidation of the phenolic ring of sensor 1 in the presence of Fe3+ and O2. Fe2+–2·1 complex showed the band at 1065 cm−1 associated with the counter anion ClO4−. Fe3+–2·1 and Zn2+–2·1 complexes displayed the bands at 1280 cm−1 and 1294 cm−1 related to the counter anion NO3−. There was no significant band for the oxidized form quinone of the phenolic ring.
2.3. Fluorometric sensing of 1 for zinc
We have also examined the selectivity of 1 toward a variety of metal ions through fluorescence emission in DMF![[thin space (1/6-em)]](https://www.rsc.org/images/entities/char_2009.gif) :
:![[thin space (1/6-em)]](https://www.rsc.org/images/entities/char_2009.gif) bis-tris buffer solution (v/v, 1
bis-tris buffer solution (v/v, 1![[thin space (1/6-em)]](https://www.rsc.org/images/entities/char_2009.gif) :
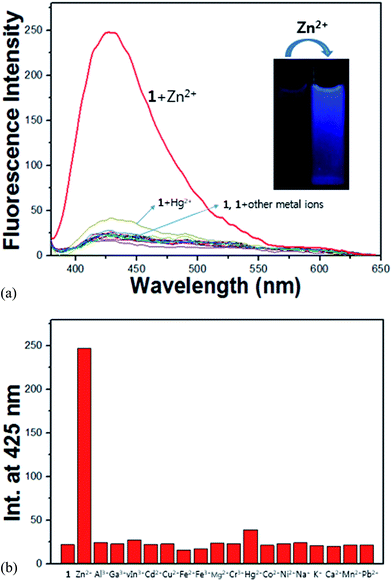
:![[thin space (1/6-em)]](https://www.rsc.org/images/entities/char_2009.gif) 1, 10 mM, pH 7.0) at room temperature. As shown in Fig. 6a, the receptor 1 alone has a very weak fluorescence emission with an excitation of 365 nm. When 1.1 equiv. of various metal ions such as Al3+, Ga3+, In3+, Zn2+, Cd2+, Cu2+, Fe2+, Fe3+, Mg2+, Cr3+, Hg2+, Co2+, Ni2+, Na+, K+, Ca2+, Mn2+ and Pb2+ was added to the receptor 1, it was found that the solution of 1 exhibited no or a small significant increase of the fluorescence. By contrast, the addition of Zn2+ resulted immediately in a drastic enhancement of the emission intensity at 425 nm (11 folds, Fig. 6b). These results indicate that receptor 1 could be used as a fluorescence chemosensor for Zn2+. Importantly, 1 can clearly distinguish Zn2+ from Cd2+, while the discrimination of Zn2+ from Cd2+ is well known to be a major problem.52–54 The selective fluorescence enhancement by Zn2+ might be due to the effective coordination of Zn2+ with 1 over other metal ions, which causes the zinc complex to be a more rigid structure than 1 itself (this refers to chelation-enhanced fluorescence (CHEF) effect).55,56 In addition, receptor 1 is poorly fluorescent in part due to isomerization of the C
1, 10 mM, pH 7.0) at room temperature. As shown in Fig. 6a, the receptor 1 alone has a very weak fluorescence emission with an excitation of 365 nm. When 1.1 equiv. of various metal ions such as Al3+, Ga3+, In3+, Zn2+, Cd2+, Cu2+, Fe2+, Fe3+, Mg2+, Cr3+, Hg2+, Co2+, Ni2+, Na+, K+, Ca2+, Mn2+ and Pb2+ was added to the receptor 1, it was found that the solution of 1 exhibited no or a small significant increase of the fluorescence. By contrast, the addition of Zn2+ resulted immediately in a drastic enhancement of the emission intensity at 425 nm (11 folds, Fig. 6b). These results indicate that receptor 1 could be used as a fluorescence chemosensor for Zn2+. Importantly, 1 can clearly distinguish Zn2+ from Cd2+, while the discrimination of Zn2+ from Cd2+ is well known to be a major problem.52–54 The selective fluorescence enhancement by Zn2+ might be due to the effective coordination of Zn2+ with 1 over other metal ions, which causes the zinc complex to be a more rigid structure than 1 itself (this refers to chelation-enhanced fluorescence (CHEF) effect).55,56 In addition, receptor 1 is poorly fluorescent in part due to isomerization of the C![[double bond, length as m-dash]](https://www.rsc.org/images/entities/char_e001.gif) N double bond in the excited state and in part due to excited-state intramolecular proton transfer (ESIPT) involving the phenolic protons.57 Upon stable chelation with zinc ion, the C
N double bond in the excited state and in part due to excited-state intramolecular proton transfer (ESIPT) involving the phenolic protons.57 Upon stable chelation with zinc ion, the C![[double bond, length as m-dash]](https://www.rsc.org/images/entities/char_e001.gif) N isomerization and ESIPT might be inhibited, leading to the fluorescence enhancement.
N isomerization and ESIPT might be inhibited, leading to the fluorescence enhancement.
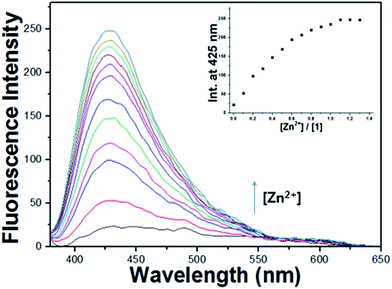
To further investigate the chemosensing properties of 1 toward Zn2+, fluorescence titration of the receptor 1 with Zn2+ ion was performed (Fig. 7). Upon the addition of Zn2+ to 1, fluorescence intensity increased gradually and was saturated at 1.1 equiv. of Zn2+. The photophysical properties of 1 were also examined using UV-vis spectrometry (Fig. S12†). Upon addition of Zn2+ ions to a solution of 1, the absorption band at 362 nm decreased and a new absorbance intensity at 370 nm increased with an isosbestic point at 406 nm, which indicates that only one product was generated from the interaction of 1 with Zn2+.
The binding mode between 1 and Zn2+ was determined by using Job plot analysis.49 As shown in Fig. S13,† the Job plot exhibited a 2![[thin space (1/6-em)]](https://www.rsc.org/images/entities/char_2009.gif) :
:![[thin space (1/6-em)]](https://www.rsc.org/images/entities/char_2009.gif) 1 complexation stoichiometry for 1 with Zn2+. The formation of Zn2+–2·1 complex was further confirmed by ESI-mass spectrometry analysis (Fig. S14†). The m/z peak at 707.30 appeared, which corresponds to the molecular ion peak of the 2·1 + Zn2+–H+ complex [calcd, 707.28]. From the results of fluorescence titration, the association constant of the Zn2+–2·1 complex was determined as 4.0 × 10⁹ M−1 on the basis of Li's equation50 (Fig. S15†). This value is within the range of those (1.0–1.0 × 10¹²) reported for Zn2+-chemosensors.58 For practical application, the detection limit51 was also an important parameter. Thus, we calculated the detection limit of receptor 1 for the analysis of Zn2+ (DL = 1.05 μM) (Fig. S16†), which is far lower than the WHO guideline (76 μM) for Zn2+ in drinking water.59
1 complexation stoichiometry for 1 with Zn2+. The formation of Zn2+–2·1 complex was further confirmed by ESI-mass spectrometry analysis (Fig. S14†). The m/z peak at 707.30 appeared, which corresponds to the molecular ion peak of the 2·1 + Zn2+–H+ complex [calcd, 707.28]. From the results of fluorescence titration, the association constant of the Zn2+–2·1 complex was determined as 4.0 × 10⁹ M−1 on the basis of Li's equation50 (Fig. S15†). This value is within the range of those (1.0–1.0 × 10¹²) reported for Zn2+-chemosensors.58 For practical application, the detection limit51 was also an important parameter. Thus, we calculated the detection limit of receptor 1 for the analysis of Zn2+ (DL = 1.05 μM) (Fig. S16†), which is far lower than the WHO guideline (76 μM) for Zn2+ in drinking water.59
To check the practical applicability of 1 as a selective fluorescence sensor for Zn2+, the competition experiments were conducted in the presence of Zn2+ mixed with other relevant metal ions, such as Al3+, Ga3+, In3+, Cd2+, Cu2+, Fe2+, Fe3+, Mg2+, Cr3+, Hg2+, Ag+, Co2+, Ni2+, Na+, K+, Ca2+, Mn2+ and Pb2+. When 1 was treated with 1.1 equiv. of Zn2+ in the presence of the same concentration of other metal ions (Fig. 8), the coexistent metal ions had a small and negligible effect on the emission intensity of the Zn2+–2·1 complexation, except for Cu2+, Fe2+ and Fe3+. They inhibited about 34, 61 and 43% of the emission intensity, respectively, but are still discernible. In particular, it is worth noting that cadmium ion hardly inhibited the fluorescence intensity of the Zn2+–2·1 complex. These results indicate that 1 could be a good Zn2+ sensor which could distinguish Zn2+ from Cd2+ commonly having similar properties.
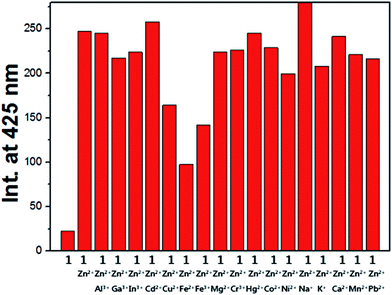 | ||
Fig. 8 (a) Competitive selectivity of 1 (20 μM) towards Zn2+ (1.1 equiv.) in the presence of other metal ions (1.1 equiv.) in DMF![[thin space (1/6-em)]](https://www.rsc.org/images/entities/char_2009.gif) : :![[thin space (1/6-em)]](https://www.rsc.org/images/entities/char_2009.gif) bis-tris buffer solution (v/v, 1 bis-tris buffer solution (v/v, 1![[thin space (1/6-em)]](https://www.rsc.org/images/entities/char_2009.gif) : :![[thin space (1/6-em)]](https://www.rsc.org/images/entities/char_2009.gif) 1, 10 mM, pH 7.0). 1, 10 mM, pH 7.0). | ||
We investigated the effect of pH on the fluorescence response of receptor 1 to the Zn2+ ion in a series of buffers with pH values ranging from 2 to 12 (Fig. S17†). An intense and stable fluorescence of Zn2+–2·1 found in the pH range of 7.0–11.0 warrants its application under physiological conditions, without any change in detection results.
In order to examine the practical applicability of 1 for environmental samples, we constructed a calibration curve for the determination of Zn2+ (Fig. S18†). The curve showed a good linear relationship between the fluorescence intensity of 1 and Zn2+ concentration (0–9.0 μM) with a correlation coefficient of R2 = 0.9975 (n = 3). Then, we prepared water samples by adding various metal ions known as being involved in industrial processes into deionized water. The chemosensor was applied for the determination of zinc in the water samples. As shown in Table 2, a satisfactory recovery and R.S.D. values of the water samples were obtained.
| Sample | Zn(II) added (μmol L−1) | Zn(II) found (μmol L−1) | Recovery (%) | R.S.D. (n = 3) (%) |
|---|---|---|---|---|
a Synthesized by deionized water, 10 μmol L−1 Cd(II), Pb(II), Na(I), K(I), Ca(II), Mg(II). Conditions: [1] = 10 μmol L−1 in DMF![[thin space (1/6-em)]](https://www.rsc.org/images/entities/char_2009.gif) : :![[thin space (1/6-em)]](https://www.rsc.org/images/entities/char_2009.gif) bis-tris buffer solution (v/v, 1 bis-tris buffer solution (v/v, 1![[thin space (1/6-em)]](https://www.rsc.org/images/entities/char_2009.gif) : :![[thin space (1/6-em)]](https://www.rsc.org/images/entities/char_2009.gif) 1, 10 mM, pH 7.0). 1, 10 mM, pH 7.0). |
||||
| Water samplea | 10.00 | 10.40 | 104 | 1.2 |
To examine the reversibility of sensor 1 toward Zn2+ in DMF![[thin space (1/6-em)]](https://www.rsc.org/images/entities/char_2009.gif) :
:![[thin space (1/6-em)]](https://www.rsc.org/images/entities/char_2009.gif) bis-tris buffer solution (v/v, 1
bis-tris buffer solution (v/v, 1![[thin space (1/6-em)]](https://www.rsc.org/images/entities/char_2009.gif) :
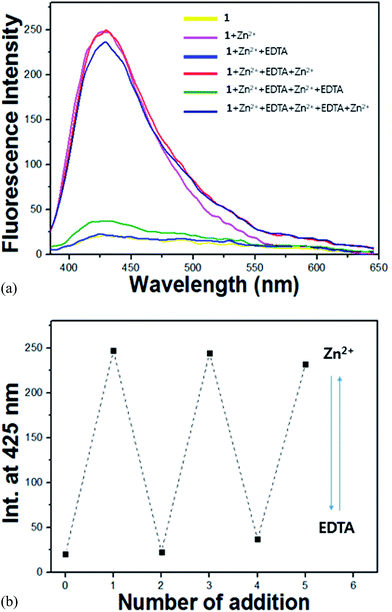
:![[thin space (1/6-em)]](https://www.rsc.org/images/entities/char_2009.gif) 1, 10 mM, pH 7.0), ethylenediaminetetraacetic acid (EDTA, 1.1 equiv.) was added to the complexed solution of receptor 1 and Zn2+. As shown in Fig. 9, the intensity at 425 nm disappeared immediately. Upon addition of Zn2+ again, the intensity was recovered. The intensity changes were almost reversible even after several cycles with the sequentially alternative addition of Zn2+ and EDTA. These results indicate that receptor 1 could be recyclable simply through treatment with a proper reagent such as EDTA.
1, 10 mM, pH 7.0), ethylenediaminetetraacetic acid (EDTA, 1.1 equiv.) was added to the complexed solution of receptor 1 and Zn2+. As shown in Fig. 9, the intensity at 425 nm disappeared immediately. Upon addition of Zn2+ again, the intensity was recovered. The intensity changes were almost reversible even after several cycles with the sequentially alternative addition of Zn2+ and EDTA. These results indicate that receptor 1 could be recyclable simply through treatment with a proper reagent such as EDTA.
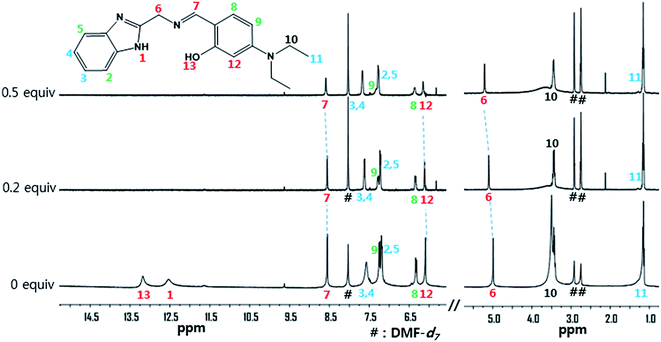
The interaction between receptor 1 and Zn2+ was further studied through 1H NMR titration (Fig. 10). Upon addition of 0.5 equiv. of Zn2+, the H13 of the phenol group and the H1 of the benzimidazole moiety disappeared. H7 of C![[double bond, length as m-dash]](https://www.rsc.org/images/entities/char_e001.gif) N moiety at 8.55 ppm and H6 of methylene moiety at 4.99 ppm showed downfield shifts by 0.04 ppm and 0.22 ppm, respectively. These results suggest that the imine and the amine N atoms and the oxygen atom of the phenyl group might coordinate to the Zn2+. There was no shift in the position of proton signals on further addition of Zn2+ (>0.5 equiv.). Based on the Job plot, ESI-mass spectrometry analysis, and 1H NMR titration, we propose the structure of a 2
N moiety at 8.55 ppm and H6 of methylene moiety at 4.99 ppm showed downfield shifts by 0.04 ppm and 0.22 ppm, respectively. These results suggest that the imine and the amine N atoms and the oxygen atom of the phenyl group might coordinate to the Zn2+. There was no shift in the position of proton signals on further addition of Zn2+ (>0.5 equiv.). Based on the Job plot, ESI-mass spectrometry analysis, and 1H NMR titration, we propose the structure of a 2![[thin space (1/6-em)]](https://www.rsc.org/images/entities/char_2009.gif) :
:![[thin space (1/6-em)]](https://www.rsc.org/images/entities/char_2009.gif) 1 complex of 1 and Zn2+, as shown in Scheme 2.
1 complex of 1 and Zn2+, as shown in Scheme 2.
To get understanding on the electronic structures of 1 and Zn2+–2·1 complex, we optimized energy-minimized structures of chemosensor 1 and Zn2+–2·1 complex at DFT/B3LYP/6-31G** level (Fig. S19†). The bond lengths and dihedral angles were compared between 1 and Zn2+–2·1 complex. The energy-minimized structure of 1 indicated the hydrogen bond in N1–H7 (Fig. S19a†). In case of Zn2+–2·1 complex, Zn2+ was coordinated to N1, O6, N9, N1′, O6′, and N9′, which indicated a hexa-coordinated zinc(II) complex (Fig. S19b†). To investigate the sensing mechanism of 1 with Zn2+, the frontier molecular orbitals of 1 and Zn2+–2·1 complex were compared in Fig. S20.† In case of 1, the energy gap between HOMO and LUMO was assigned to π → π* transition of 4-diethylaminosalicylaldehyde moiety. For Zn2+–2·1 complex, the energy gap between HOMO and LUMO was also assigned to π → π* transition of 4-diethylaminosalicylaldehyde moiety. There were no obvious changes of HOMO–LUMO transitions between 1 and Zn2+–2·1 complex. These results suggested that the sensing mechanism of 1 toward Zn2+ was originated by the rigid structure of Zn2+–2·1 complex, which might inhibit the non-radiative process such as C![[double bond, length as m-dash]](https://www.rsc.org/images/entities/char_e001.gif) N isomerization. Thus, the CHEF effect and the inhibition of C
N isomerization. Thus, the CHEF effect and the inhibition of C![[double bond, length as m-dash]](https://www.rsc.org/images/entities/char_e001.gif) N isomerization play important roles in the fluorescence enhancement.60
N isomerization play important roles in the fluorescence enhancement.60
3. Conclusion
We have developed a new chemosensor 1 based on the Schiff base with the benzimidazole and 4-diethylaminosalicylaldehyde moieties. The receptor 1 can be used as a multifunctional chemosensor for the highly selective detection of Fe2+ and Fe3+ by colorimetry and Zn2+ by fluorimetry in a 2![[thin space (1/6-em)]](https://www.rsc.org/images/entities/char_2009.gif) :
:![[thin space (1/6-em)]](https://www.rsc.org/images/entities/char_2009.gif) 1 stoichiometric manner in aqueous media. 1 could be successfully applied to real samples for the quantification and qualification of Fe3+ and Zn2+ with the satisfactory recovery and R.S.D. values, respectively. The detection limits of 1 for Fe2+/3+ and Zn2+ were far below the guidelines of the WHO. The addition of EDTA to the Zn2+–2·1 complex regenerated the free 1, indicating that the receptor 1 could be recyclable simply through treatment with a proper reagent such as EDTA. The sensing mechanism of 1 for Zn2+ was explained by the theoretical calculations. Consequently, the receptor 1 showed the possibility to be used as a dual-mode sensor in aqueous environment.
1 stoichiometric manner in aqueous media. 1 could be successfully applied to real samples for the quantification and qualification of Fe3+ and Zn2+ with the satisfactory recovery and R.S.D. values, respectively. The detection limits of 1 for Fe2+/3+ and Zn2+ were far below the guidelines of the WHO. The addition of EDTA to the Zn2+–2·1 complex regenerated the free 1, indicating that the receptor 1 could be recyclable simply through treatment with a proper reagent such as EDTA. The sensing mechanism of 1 for Zn2+ was explained by the theoretical calculations. Consequently, the receptor 1 showed the possibility to be used as a dual-mode sensor in aqueous environment.
4. Experimental section
4.1. General information
All solvents and reagents (analytical grade and spectroscopic grade) were obtained from Sigma-Aldrich and used as received. Both 1H NMR and 13C NMR were recorded on a Varian 400 MHz and 100 MHz spectrometer, respectively. The chemical shifts (δ) were recorded in ppm. Absorption spectra were recorded at room temperature using a Perkin Elmer model Lambda 2S UV/Vis spectrometer. Electrospray ionization mass spectra (ESI-mass) were collected on a Thermo Finnigan (San Jose, CA, USA) LCQTM Advantage MAX quadrupole ion trap instrument. Fluorescence measurements were performed on a Perkin Elmer model LS45 fluorescence spectrometer. Elemental analysis for carbon, nitrogen, and hydrogen was carried out by using a Flash EA 1112 elemental analyzer (thermo) in Organic Chemistry Research Center of Sogang University, Korea.4.2. Synthesis of 1
2-(Aminomethyl)benzimidazole dihydrochloride (0.22 g, 1 mmol) was dissolved in 15 mL of methanol and neutralized by sodium hydroxide (0.04 g, 1 mmol). Then, 4-diethylamino salicylaldehyde (0.20 g, 1 mmol) was added into the solution. The reaction mixture was stirred for 1 h at room temperature. The solvent was removed under reduced pressure to obtain dark brown oil, which was purified by silica gel column chromatography (10![[thin space (1/6-em)]](https://www.rsc.org/images/entities/char_2009.gif) :
:![[thin space (1/6-em)]](https://www.rsc.org/images/entities/char_2009.gif) 1 v/v CH2Cl2
1 v/v CH2Cl2![[thin space (1/6-em)]](https://www.rsc.org/images/entities/char_2009.gif) :
:![[thin space (1/6-em)]](https://www.rsc.org/images/entities/char_2009.gif) CH3OH). Yield: 0.19 g (60.0%). 1H NMR (DMSO-d6, 400 MHz): δ 13.21 (s, 1H), 12.42 (s, 1H), 8.46 (s, 1H), 7.51 (d, J = 32 Hz, 2H), 7.19 (d, J = 8 Hz, 1H), 7.16 (d, J = 8 Hz, 2H), 6.24 (d, J = 8 Hz, 1H), 6.00 (d, J = 2.4 Hz, 1H), 4.87 (s, 2H), 3.35 (m, 4H), 1.09 (t, J = 8 Hz, 4H). 13C NMR (DMF-d7, 100 MHz): δ 189.28, 164.56, 161.78, 160.66, 149.19, 132.77, 130.13, 105.76, 101.75, 100.45, 95.87, 94.08, 57.49, 52.42, 43.15, 42.22, 41.88 ppm. ESI-mass: m/z calcd for C19H22N4O + H+ ([M + H+]), 323.19; found, 323.20. Anal. calc. for C19H22N4O: C 70.78; H, 6.88; N, 17.38; found: C, 70.82; H, 6.96; N, 17.58.
CH3OH). Yield: 0.19 g (60.0%). 1H NMR (DMSO-d6, 400 MHz): δ 13.21 (s, 1H), 12.42 (s, 1H), 8.46 (s, 1H), 7.51 (d, J = 32 Hz, 2H), 7.19 (d, J = 8 Hz, 1H), 7.16 (d, J = 8 Hz, 2H), 6.24 (d, J = 8 Hz, 1H), 6.00 (d, J = 2.4 Hz, 1H), 4.87 (s, 2H), 3.35 (m, 4H), 1.09 (t, J = 8 Hz, 4H). 13C NMR (DMF-d7, 100 MHz): δ 189.28, 164.56, 161.78, 160.66, 149.19, 132.77, 130.13, 105.76, 101.75, 100.45, 95.87, 94.08, 57.49, 52.42, 43.15, 42.22, 41.88 ppm. ESI-mass: m/z calcd for C19H22N4O + H+ ([M + H+]), 323.19; found, 323.20. Anal. calc. for C19H22N4O: C 70.78; H, 6.88; N, 17.38; found: C, 70.82; H, 6.96; N, 17.58.
4.3. Chromogenic iron sensing
For Fe3+, the receptor 1 (1.9 mg, 0.006 mmol) was dissolved in DMF (2 mL) and 20 μL of the receptor 1 (3 mM) was diluted to 2.98 mL of bis-tris buffer solution (10 mM, pH 7.0) to make the final concentration of 20 μM. Fe(NO3)3 (16.5 mg, 0.04 mmol) was dissolved in bis-tris buffer solution (2 mL). 0–3.6 μL of the Fe2+ solution (20 mM) was transferred to the receptor solution (20 μM, 3 mL) prepared above. After mixing them for a few seconds, UV-vis spectra were taken at room temperature.
For Fe3+, the receptor 1 (1.9 mg, 0.006 mmol) was dissolved in DMF (2 mL) and Fe(NO3)3 (16.5 mg, 0.04 mmol) was dissolved in bis-tris buffer solution (10 mM, pH 7.0, 2 mL), respectively. 700 μL of the receptor 1 solution was diluted to 29.3 mL of bis-tris buffer solution (10 mM, pH 7.0) to make the concentration of 70 μM. 105 μL of Fe(NO3)3 solution was diluted to 29.09 mL of bis-tris buffer solution (10 mM, pH 7.0). 2.7, 2.4, 2.1, 1.8, 1.5, 1.2, 0.9, 0.6 and 0.3 mL of the receptor 1 solution were taken and transferred to vials. 0.3, 0.6, 0.9, 1.2, 1.5, 1.8, 2.1, 2.4 and 2.7 mL of the Fe3+ solution were added to each receptor solution separately. Each vial had a total volume of 3 mL. After shaking the vials for a few seconds, UV-vis spectra were taken at room temperature.
For Fe3+, the receptor 1 (1.9 mg, 0.006 mmol) was dissolved in DMF (2 mL). MNO3 (M = Na, K, 0.04 mmol) or M(NO3)2 (M = Zn, Cd, Cu, Mg, Hg, Co, Ni, Ca, Mn, Pb, 0.04 mmol) or M(NO3)3 (M = Al, Ga, In, Fe, Cr, 0.04 mmol) or M(ClO4)2 (M = Fe, 0.04 mmol) was separately dissolved in bis-tris buffer solution (10 mM, pH 7.0, 2 mL). 3.6 μL of each metal solution (20 mM) was diluted to 2.973 mL of bis-tris buffer solution (10 mM, pH 7.0), separately. 3.6 μL of the Fe3+ solution (20 mM) was taken and added to the solutions prepared above. Then, 20 μL (3 mM) of the receptor 1 was taken and added to the mixed solutions. Each vial had a total volume of 3 mL. After shaking the vials for a few seconds, UV-vis spectra were taken at room temperature.
For Fe3+, a series of buffers with pH values ranging from 2 to 12 was prepared by mixing sodium hydroxide solution and hydrochloric acid in bis-tris buffer. After the solution with a desired pH was achieved, receptor 1 (1.9 mg, 0.006 mmol) was dissolved in DMF (2 mL), and then 20 μL of the receptor 1 (3 mM) was diluted with 2.98 mL buffers to make the final concentration of 20 μM. Fe(NO3)3 (16.5 mg, 0.04 mmol) was dissolved in bis-tris buffer (10 mM, pH 7.0, 2 mL). 3.6 μL of the Fe3+ solution (20 mM) was transferred to each receptor solution (20 μM) prepared above. After mixing them for a few seconds, UV-vis spectra were obtained at room temperature.
4.4. Fluorogenic zinc sensing
![[thin space (1/6-em)]](https://www.rsc.org/images/entities/char_2009.gif) :
:![[thin space (1/6-em)]](https://www.rsc.org/images/entities/char_2009.gif) bis-tris buffer solution (1
bis-tris buffer solution (1![[thin space (1/6-em)]](https://www.rsc.org/images/entities/char_2009.gif) :
:![[thin space (1/6-em)]](https://www.rsc.org/images/entities/char_2009.gif) 1, v/v, 10 mM, pH 7.0) to make the concentration of 20 μM. Zn(NO3)2·6H2O (11.9 mg, 0.04 mmol) was also dissolved in DMF (2 mL) and 0–3.3 μL of the Zn2+ solution (20 mM) was transferred to the solution of receptor 1 (20 μM, 3 mL) prepared above. After mixing them for a few seconds, fluorescence spectra were taken at room temperature.
1, v/v, 10 mM, pH 7.0) to make the concentration of 20 μM. Zn(NO3)2·6H2O (11.9 mg, 0.04 mmol) was also dissolved in DMF (2 mL) and 0–3.3 μL of the Zn2+ solution (20 mM) was transferred to the solution of receptor 1 (20 μM, 3 mL) prepared above. After mixing them for a few seconds, fluorescence spectra were taken at room temperature.![[thin space (1/6-em)]](https://www.rsc.org/images/entities/char_2009.gif) :
:![[thin space (1/6-em)]](https://www.rsc.org/images/entities/char_2009.gif) bis-tris buffer solution (1
bis-tris buffer solution (1![[thin space (1/6-em)]](https://www.rsc.org/images/entities/char_2009.gif) :
:![[thin space (1/6-em)]](https://www.rsc.org/images/entities/char_2009.gif) 1, v/v, 10 mM, pH 7.0) to make the final concentration of 30 μM. Zn(NO3)2·6H2O (11.9 mg, 0.04 mmol) was dissolved in DMF (2 mL). 0–4.5 μL of the Zn2+ solution (20 mM) was transferred to the solution the receptor 1 (30 μM, 3 mL) prepared above. After mixing them for a few seconds, UV-vis spectra were taken at room temperature.
1, v/v, 10 mM, pH 7.0) to make the final concentration of 30 μM. Zn(NO3)2·6H2O (11.9 mg, 0.04 mmol) was dissolved in DMF (2 mL). 0–4.5 μL of the Zn2+ solution (20 mM) was transferred to the solution the receptor 1 (30 μM, 3 mL) prepared above. After mixing them for a few seconds, UV-vis spectra were taken at room temperature.![[thin space (1/6-em)]](https://www.rsc.org/images/entities/char_2009.gif) :
:![[thin space (1/6-em)]](https://www.rsc.org/images/entities/char_2009.gif) bis-tris buffer solution (1
bis-tris buffer solution (1![[thin space (1/6-em)]](https://www.rsc.org/images/entities/char_2009.gif) :
:![[thin space (1/6-em)]](https://www.rsc.org/images/entities/char_2009.gif) 1, v/v, 10 mM, pH 7.0) to make the concentration of 60 μM. 90 μL of Zn(NO3)2·6H2O solution was diluted to 29.01 mL of bis-tris buffer solution (10 mM, pH 7.0). 2.7, 2.4, 2.1, 1.8, 1.5, 1.2, 0.9, 0.6 and 0.3 mL of the receptor 1 solution were taken and transferred to vials. 0.3, 0.6, 0.9, 1.2, 1.5, 1.8, 2.1, 2.4 and 2.7 mL of the Zn2+ solution were added to each receptor solution separately. Each vial had a total volume of 3 mL. After shaking the vials for a few seconds, UV-vis spectra were taken at room temperature.
1, v/v, 10 mM, pH 7.0) to make the concentration of 60 μM. 90 μL of Zn(NO3)2·6H2O solution was diluted to 29.01 mL of bis-tris buffer solution (10 mM, pH 7.0). 2.7, 2.4, 2.1, 1.8, 1.5, 1.2, 0.9, 0.6 and 0.3 mL of the receptor 1 solution were taken and transferred to vials. 0.3, 0.6, 0.9, 1.2, 1.5, 1.8, 2.1, 2.4 and 2.7 mL of the Zn2+ solution were added to each receptor solution separately. Each vial had a total volume of 3 mL. After shaking the vials for a few seconds, UV-vis spectra were taken at room temperature.![[thin space (1/6-em)]](https://www.rsc.org/images/entities/char_2009.gif) :
:![[thin space (1/6-em)]](https://www.rsc.org/images/entities/char_2009.gif) bis-tris buffer solution (1
bis-tris buffer solution (1![[thin space (1/6-em)]](https://www.rsc.org/images/entities/char_2009.gif) :
:![[thin space (1/6-em)]](https://www.rsc.org/images/entities/char_2009.gif) 1, v/v, 10 mM, pH 7.0), separately. 3.3 μL of the Zn2+ solution (20 mM) was taken and added to the solutions prepared above. Then, 20 μL of the receptor 1 (3 mM) was taken and added to the mixed solutions. Each vial had a total volume of 3 mL. After shaking the vials for a few seconds, fluorescence spectra were taken at room temperature.
1, v/v, 10 mM, pH 7.0), separately. 3.3 μL of the Zn2+ solution (20 mM) was taken and added to the solutions prepared above. Then, 20 μL of the receptor 1 (3 mM) was taken and added to the mixed solutions. Each vial had a total volume of 3 mL. After shaking the vials for a few seconds, fluorescence spectra were taken at room temperature.![[thin space (1/6-em)]](https://www.rsc.org/images/entities/char_2009.gif) :
:![[thin space (1/6-em)]](https://www.rsc.org/images/entities/char_2009.gif) bis-tris buffer (1
bis-tris buffer (1![[thin space (1/6-em)]](https://www.rsc.org/images/entities/char_2009.gif) :
:![[thin space (1/6-em)]](https://www.rsc.org/images/entities/char_2009.gif) 1, v/v, 10 mM, pH 7.0) to make the concentration of 20 μM. Zn(NO3)2·6H2O (11.9 mg, 0.04 mmol) was also dissolved in DMF (2 mL) and 3.3 μL of the Zn2+ solution (20 mM) was transferred to the solution of 1 (20 μM, 3 mL) prepared above. After mixing them for a few seconds, fluorescence spectrum was taken at room temperature. Ethylenediaminetetraacetic acid disodium salt dehydrate (EDTA, 0.04 mmol) was dissolved in buffer solution (2 mL) and 3.3 μL of the EDTA solution (20 mM) was added to the solution of Zn2+–2·1 complex (20 μM) prepared above. After mixing it for few seconds, fluorescence spectrum was taken. For the reversibility study, another 3.3 μL of the Zn2+ ion solution (20 mM) was added to the above solution. After mixing it for a few seconds, fluorescence spectrum was taken. The same experimental procedure was repeated several times at room temperature.
1, v/v, 10 mM, pH 7.0) to make the concentration of 20 μM. Zn(NO3)2·6H2O (11.9 mg, 0.04 mmol) was also dissolved in DMF (2 mL) and 3.3 μL of the Zn2+ solution (20 mM) was transferred to the solution of 1 (20 μM, 3 mL) prepared above. After mixing them for a few seconds, fluorescence spectrum was taken at room temperature. Ethylenediaminetetraacetic acid disodium salt dehydrate (EDTA, 0.04 mmol) was dissolved in buffer solution (2 mL) and 3.3 μL of the EDTA solution (20 mM) was added to the solution of Zn2+–2·1 complex (20 μM) prepared above. After mixing it for few seconds, fluorescence spectrum was taken. For the reversibility study, another 3.3 μL of the Zn2+ ion solution (20 mM) was added to the above solution. After mixing it for a few seconds, fluorescence spectrum was taken. The same experimental procedure was repeated several times at room temperature.Acknowledgements
Basic Science Research Program through the National Research Foundation of Korea (NRF) funded by the Ministry of Education, Science and Technology (NRF-2014R1A2A1A11051794 and NRF-2015R1A2A2A09001301) are gratefully acknowledged. We thank Nano-Inorganic Laboratory, Department of Nano & Bio Chemistry, Kookmin University to access the Gaussian 03 program packages.References
- R. P. Haugland, The Molecular Probes Handbook: A Guide to Fluorescent Probes and Labeling Technologies, Invitrogen, Carlsbad, CA, 10th edn, 2005 Search PubMed.
- K. Kaur, R. Saini, A. Kumar, V. Luxami, N. Kaur, P. Singh and S. Kumar, Coord. Chem. Rev., 2012, 256, 1992–2028 CrossRef CAS.
- N. Kaur and S. Kumar, Tetrahedron, 2011, 67, 9233–9264 CrossRef CAS.
- B. N. Giepmans, S. R. Adams, M. H. Ellisman and R. Y. Tsien, Science, 2006, 312, 217–224 CrossRef CAS PubMed.
- S. Aoki, D. Kagata, M. Shiro, K. Takeda and E. Kimura, J. Am. Chem. Soc., 2004, 126, 13377–13390 CrossRef CAS PubMed.
- K. K. Upadhyay and A. Kumar, Org. Biomol. Chem., 2010, 8, 4892–4897 Search PubMed.
- Z. Xu, S. J. Han, C. Lee, J. Yoon and D. R. Spring, Chem. Commun., 2010, 46, 1679–1681 RSC.
- K. Komatsu, Y. Urano, H. Kojima and T. Nagano, J. Am. Chem. Soc., 2007, 129, 13447–13454 CrossRef CAS PubMed.
- S. Yoon, E. W. Miller, Q. He, P. H. Do and C. J. Chang, Angew. Chem., 2007, 119, 6778–6781 CrossRef.
- B. He, A. B. Pun, D. Zherebetskyy, Y. Liu, F. Liu, L. M. Klivansky, A. M. McGough, B. A. Zhang, K. Lo, T. P. Russell, L. Wang and Y. Liu, J. Am. Chem. Soc., 2014, 136, 15093–15101 CrossRef CAS PubMed.
- P. Aisen, M. Wessling-Resnick and E. A. Leibold, Curr. Opin. Chem. Biol., 1999, 3, 200–206 CrossRef CAS PubMed.
- S. DuBois and D. J. Kearney, Am. J. Gastroenterol., 2005, 100, 453–459 CrossRef PubMed.
- Y. S. Kim, G. J. Park, J. J. Lee, S. Y. Lee, S. Y. Lee and C. Kim, RSC Adv., 2015, 5, 11229–11239 RSC.
- G. R. You, G. J. Park, S. A. Lee, K. Y. Ryu and C. Kim, Sens. Actuators, B, 2015, 215, 188–195 CrossRef CAS.
- J. M. Berg and Y. Shi, Science, 1996, 271, 1081–1085 CrossRef CAS PubMed.
- G. J. Park, M. M. Lee, G. R. You, Y. W. Choi and C. Kim, Tetrahedron Lett., 2014, 55, 2517–2522 CrossRef CAS.
- S. C. Burdette, G. K. Burdette, B. Springler, R. Y. Tsien and S. J. Lippard, J. Am. Chem. Soc., 2001, 123, 7831–7841 CrossRef CAS PubMed.
- E. L. Que, D. W. Domaille and C. J. Chang, Chem. Rev., 2008, 108, 1517–1549 CrossRef CAS PubMed.
- C. J. Frederickson and A. I. Bush, Biometals, 2001, 14, 353–366 CrossRef CAS PubMed.
- G. Zhang, H. Li, S. Bi, L. Song, Y. Lu, L. Zhang, J. Yu and L. Wang, Analyst, 2013, 138, 6163–6170 RSC.
- A. Voegelin, S. Pfister, A. C. Scheinost, M. A. Marcus and R. Kretzschmar, Environ. Sci. Technol., 2005, 39, 6616–6623 CrossRef CAS PubMed.
- S. Kury, B. Dreno, S. Bezieau, S. Giraudet, M. Kharfi, R. Kamoun and J.-P. Moisan, Nat. Genet., 2002, 31, 239–240 CrossRef PubMed.
- M. P. Cuajungco and G. J. Lees, Neurobiol. Dis., 1997, 4, 137–169 CrossRef CAS PubMed.
- A. I. Bush, W. H. Pettingell, M. D. Paradis and R. E. Tanzi, J. Biol. Chem., 1994, 269, 12152–12158 CAS.
- Y. Mei, C. J. Frederickson, L. J. Giblin, J. H. Weiss, Y. Medvedeva and P. A. Bentley, Chem. Commun., 2011, 47, 7107–7109 RSC.
- Z. C. Xu, K. H. Baek, H. N. Kim, J. N. Cui, X. H. Qian, D. R. Spring, I. Shin and J. Yoon, J. Am. Chem. Soc., 2010, 132, 601–610 CrossRef CAS PubMed.
- K. Li, X. Y. Wang and A. J. Tong, Anal. Chim. Acta, 2013, 776, 69–73 CrossRef CAS PubMed.
- Y. S. Cho, K. M. Kim, D. Lee, W. J. Kim and K. H. Ahn, Chem.–Asian J., 2013, 8, 755–759 CrossRef CAS PubMed.
- L. Xue, G. Li, C. Yu and H. Jiang, Chem.–Eur. J., 2012, 18, 1050–1054 CrossRef CAS PubMed.
- Y. Zhou, Z. X. Li, S. Q. Zang, Y. Y. Zhu, H. Y. Zhang, H. W. Hou and T. C. W. Mak, Org. Lett., 2012, 14, 1214–1217 CrossRef CAS PubMed.
- D. L. Lu, L. G. Yang, Z. D. Tian, L. Z. Wang and J. L. Zhang, RSC Adv., 2012, 2, 2783–2789 RSC.
- Z. Li, M. Yu, L. Zhang, M. Yu, J. Liu, L. Wei and H. Zhang, Chem. Commun., 2010, 46, 7169–7171 RSC.
- Y. J. Jang, Y. H. Yeon, H. Y. Yang, J. Y. Noh, I. H. Hwang and C. Kim, Inorg. Chem. Commun., 2013, 33, 48–51 CrossRef CAS.
- Y. K. Jang, U. C. Nam, H. L. Kwon, I. H. Hwang and C. Kim, Dyes Pigm., 2013, 99, 6–13 CrossRef CAS.
- K. B. Kim, G. J. Park, H. Kim, E. J. Song, J. M. Bae and C. Kim, Inorg. Chem. Commun., 2014, 46, 237–240 CrossRef CAS.
- N. Singh, N. Kaur, C. N. Choitir and J. F. Callan, Tetrahedron Lett., 2009, 50, 4201–4204 CrossRef CAS.
- S. Sen, S. Sarkar, B. Chattopadhyay, A. Moirangthaem, A. Basu, K. Dhara and P. Chattopadhyay, Analyst, 2012, 137, 3335–3342 RSC.
- D. Y. Lee, N. Singh and D. O. Jang, Tetrahedron Lett., 2011, 52, 3886–3890 CrossRef CAS.
- J. J. Lee, Y. W. Choi, G. R. You, S. Y. Lee and C. Kim, Dalton Trans., 2015, 44, 13305–13314 RSC.
- D. H. Kim, Y. S. Im, H. Kim and C. Kim, Inorg. Chem. Commun., 2014, 45, 15–19 CrossRef CAS.
- U. A. Fegade, S. K. Sahoo, A. Singh, N. Singh, S. N. Attarde and A. S. Kuwar, Anal. Chim. Acta, 2015, 872, 63–69 CrossRef CAS PubMed.
- E. J. Song, J. Kang, G. R. You, G. J. Park, Y. Kim, S. J. Kim, C. Kim and R. G. Harrison, Dalton Trans., 2013, 42, 15514–15520 RSC.
- K. Skonieczny, A. I. Ciuciu, E. M. Nichols, V. Hugues, M. B. Desce, L. Flamigni and D. T. Gryko, J. Mater. Chem., 2012, 22, 20649–20664 RSC.
- M. Wang, J. G. Wang, W. J. Xue and A. X. Wu, Dyes Pigm., 2013, 97, 475–480 CrossRef CAS.
- L. J. Tang, M. J. Cai, Z. L. Huang, K. L. Zhong, S. H. Hou, Y. J. Bian and R. J. Nandhakumar, Sens. Actuators, B, 2013, 185, 188–194 CrossRef CAS.
- Y. J. Na, Y. W. Choi, J. Y. Yun, K.-M. Park, P.-S. Chang and C. Kim, Spectrochim. Acta, Part A, 2015, 136, 1649–1657 CrossRef CAS PubMed.
- I. H. Hwang, Y. W. Choi, K. B. Kim, G. J. Park, J. J. Lee, L. Nguyen, I. Noh and C. Kim, New J. Chem., 2016, 40, 171–178 RSC.
- S. Cui, S. Pu and Y. Dai, Anal. Methods, 2015, 7, 3593–3599 RSC.
- P. Job, Ann. Chim., 1928, 9, 113–203 CAS.
- G. Grynkiewcz, M. Poenie and R. Y. Tsein, J. Biol. Chem., 1985, 260, 3440–3445 Search PubMed.
- C. R. Lohani, J. M. Kim, S. Y. Chung, J. Yoon and K. H. Lee, Analyst, 2010, 135, 2079–2084 RSC.
- Z. Shi, Q. Han, L. Yang, H. Yang, X. Tang, W. Dou, Z. Li, Y. Zhang, Y. Shao, L. Guan and W. Liu, Chem.–Eur. J., 2015, 21, 290–297 CrossRef CAS PubMed.
- Y. Mikata, K. Kawata, S. Takeuchi, K. Nakanishi, H. Konno, S. Itami, K. Yasuda, S. Tamotsu and S. C. Burdette, Dalton Trans., 2014, 43, 10751–10759 RSC.
- P. S. Hariharan and S. P. Anthony, Anal. Chim. Acta, 2014, 848, 74–79 CrossRef CAS PubMed.
- V. Bhalla, R. Kumar and M. Kumar, Dalton Trans., 2013, 42, 975–980 RSC.
- N. C. Lim, J. V. Schuster, M. C. Porto, M. A. Tanudra, L. Yao, H. C. Freake and C. Brückner, Inorg. Chem., 2005, 44, 2018–2030 CrossRef CAS PubMed.
- L. Wang, W. Qin, X. Tang, W. Dou and W. Liu, J. Phys. Chem. A, 2011, 115, 1609–1616 CrossRef CAS PubMed.
- J. H. Kim, I. H. Hwang, S. P. Jang, J. Kang, S. Kim, I. Noh, Y. Kim, C. Kim and R. G. Harrison, Dalton Trans., 2013, 42, 5500–5507 RSC.
- Y. P. Kumar, P. King and V. S. K. R. Prasad, Chem.–Eng. J., 2006, 124, 63–70 CrossRef CAS.
- Y. W. Choi, G. R. You, J. J. Lee and C. Kim, Inorg. Chem. Commun., 2016, 63, 35–38 CrossRef CAS.
- A. D. Becke, J. Chem. Phys., 1993, 98, 5648–5652 CrossRef CAS.
- C. Lee, W. Yang and R. G. Parr, Phys. Rev. B: Condens. Matter Mater. Phys., 1988, 37, 785–789 CrossRef CAS.
- P. C. Hariharan and J. A. Pople, Theor. Chim. Acta, 1973, 28, 213–222 CrossRef CAS.
- M. M. Francl, W. J. Petro, W. J. Hehre, J. S. Binkley, M. S. Gordon, D. F. DeFrees and J. A. Pople, J. Chem. Phys., 1982, 77, 3654–3665 CrossRef CAS.
- V. Barone and M. Cossi, J. Phys. Chem. A, 1998, 102, 1995–2001 CrossRef CAS.
- M. Cossi and V. Barone, J. Chem. Phys., 2001, 115, 4708–4717 CrossRef CAS.
- N. M. O'Boyle, A. L. Tenderholt and K. M. Langner, J. Comput. Chem., 2008, 29, 839–845 CrossRef PubMed.
- M. J. Frisch, G. W. Trucks, H. B. Schlegel, G. E. Scuseria, M. A. Robb, J. R. Cheeseman, J. A. Montgomery Jr, T. Vreven, K. N. Kudin, J. C. Burant, J. M. Millam, S. S. Iyengar, J. Tomasi, V. Barone, B. Mennucci, M. Cossi, G. Scalmani, N. Rega, G. A. Petersson, H. Nakatsuji, M. Hada, M. Ehara, K. Toyota, R. Fukuda, J. Hasegawa, M. Ishida, T. Nakajima, Y. Honda, O. Kitao, H. Nakai, M. Klene, X. Li, J. E. Knox, H. P. Hratchian, J. B. Cross, V. Bakken, C. Adamo, J. Jaramillo, R. Gomperts, R. E. Stratmann, O. Yazyev, A. J. Austin, R. Cammi, C. Pomelli, J. W. Ochterski, P. Y. Ayala, K. Morokuma, G. A. Voth, P. Salvador, J. J. Dannenberg, V. G. Zakrzewski, S. Dapprich, A. D. Daniels, M. C. Strain, O. Farkas, D. K. Malick, A. D. Rabuck, K. Raghavachari, J. B. Foresman, J. V. Ortiz, Q. Cui, A. G. Baboul, S. Clifford, J. Cioslowski, B. B. Stefanov, G. Liu, A. Liashenko, P. Piskorz, I. Komaromi, R. L. Martin, D. J. Fox, T. Keith, M. A. Al-Laham, C. Y. Peng, A. Nanayakkara, M. Challacombe, P. M. W. Gill, B. Johnson, W. Chen, M. W. Wong, C. Gonzalez and J. A. Pople, Gaussian 03, Revision D.01, Gaussian, Inc., Wallingford CT, 2004 Search PubMed.
Footnote |
| † Electronic supplementary information (ESI) available. See DOI: 10.1039/c6ra10086d |
| This journal is © The Royal Society of Chemistry 2016 |


