Interaction of p-synephrine with p-chloranil: experimental design and multiple response optimization
Marwa S. Elazazy*,
K. Ganesh,
V. Sivakumar and
Yasser H. A. Huessein
Department of Chemistry and Earth Sciences, College of Arts and Sciences, Qatar University, P.O.Box 2713, Qatar. E-mail: marwasaid@qu.edu.qa; Tel: +974-44034675
First published on 4th July 2016
Abstract
In the current paper, and for the first time, spectrophotometry coupled with a set of factorial designs was executed as a new tool for investigating the interaction between p-synephrine (p-SY) and p-chloranil (p-CHL). Two types of complexes were observed as a result of this interaction. The first complex, an intermolecular charge transfer complex, was measured at 452 nm, while the second, an intramolecular charge transfer complex, was measured at 536 nm. A chemometric assisted screening and optimization of the absorbance at the two wavelengths was scrutinized. As a screening procedure, a 2-level full factorial design (2k-FFD) was employed. Method variables, such as reaction temperature, heating time, reagent volume, and solvent type were considered and the response was measured at the individual wavelengths. With the help of Pareto analysis, and ANOVA testing (following a response transformation employing Box–Cox treatment), variables ascertained to be significant (p < 0.05) were selected. Significant factors were carefully adjusted, exploiting a response surface methodology (RSM) with a face-centered central composite design (FCCCD). Afterwards, and with the help of the overlaid contour plots, and Derringer's desirability function, the multiple responses (Y1 and Y2) were simultaneously optimized and consolidated into a unified performance characteristic. The proposed model denoted the efficacy of experimental designs in adjusting the reaction variables and maximizing the output. Scott's plot, and other models were used to determine the formation constant of a 1![[thin space (1/6-em)]](https://www.rsc.org/images/entities/char_2009.gif) :
:![[thin space (1/6-em)]](https://www.rsc.org/images/entities/char_2009.gif) 1 complex. Validation of the proposed procedure was performed using ANOVA. Linearity, detection and quantification limits as well as accuracy, within-day and intermediate precisions have been assessed following ICH guidelines for evaluation of analytical procedures.
1 complex. Validation of the proposed procedure was performed using ANOVA. Linearity, detection and quantification limits as well as accuracy, within-day and intermediate precisions have been assessed following ICH guidelines for evaluation of analytical procedures.
1. Introduction
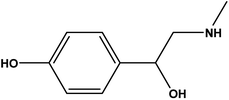
Synephrine (SY) is chemically recognized as 4-[1-hydroxy-2(methyl amino)ethyl]phenol (Scheme 1).1 Though being available via synthetic routes, SY was originally isolated from natural sources such as bitter orange. Acting by stimulating many receptors (α1, α2, β1, β2, β3 and 5-HT) to different degrees, SY has a wide variety of biological effects. Uses of SY as antihypotensive, and in treatment of conjunctival congestion have been reported.1 The controversial usage of SY as a thermogenic agent either alone or in combination with caffeine, has forced many regulations. According to Health Canada, weight loss products containing SY and caffeine are not allowed.2–6 Reviewing literature showed that most of the described procedures for SY determination are chromatographic approaches, which might not be suitable for routine applications.7–13 Having a look on the chemical structure of p-SY, Scheme 1, with its electron rich benzene ring, and electron donating hydroxyl and 2°-amino groups, one can observe its suitability for being an electron donor. To the best of our knowledge, no spectrophotometric procedure based on charge transfer complex (CTC) formation was reported for p-SY determination. With a variety of applications, donor (D)–acceptor (A) molecular interactions with subsequent formation of CTCs have become the focus of a variety of many recent investigations.14–17 Studying the electron transfer process between p-SY and quinones, which are known to be popular electron acceptor molecules,18,19 and which exist in many pharmaceutical products,20,21 would be of interest. p-Chloranil (p-CHL; tetrachloro-1,4-benzoquinone) was chosen for this study because of its promising property as an active electron accepting quinone. With four electron withdrawing chlorine atoms and a positive redox potential of 278 mV in acetonitrile (vs. NHE), p-CHL is a special electron pulling molecule for this study.22 In the current investigation, interaction of p-SY (as electron donor) with p-CHL (as electron acceptor) resulted in formation of a colored CTC. Two major peaks were detected and were attributed to the formation of intermolecular (inter, yellow colored, Y1, 452 nm) and intramolecular (intra, violet colored, Y2, 536 nm) CTCs. In reality, both complexes were of interest, keeping in mind the probability of their application as a novel class of chromogenic sensors.14A common feature among all literature reported techniques for determination of p-SY is that they were all based on examination of one factor at a time (OFAT). This approach and though still being used in analytical method development confronts many problems. One of the major restraints associated with this practice is the need for a large number of experiments. Yet, the resulting depiction of “optimal conditions” and hence the system performance cannot be treated with a high degree of inevitability. One reason for that is the lack of assessment of variable–variable interactions in the models designed using OFAT. With an ability to reflect the statistical impact of the discrete independent variables and likewise their interactions through a much fewer number of experiments, multivariate analysis would be the ‘ideal’ approach in this case.23–25
Two phases are usually recognized in building a factorial design: (1) screening and modelling: where all factors that might ‘shape’ the response are considered and only factors proved to have a vital effect on the anticipated response are selected; (2) tuning: where variable ‘best settings’ are modelled.23
Formation of inter- or intra-CTC, in our case, was affected by many variables. These variables and as described by “Minitab® 17” are either “numerical”, such as reaction temperature, reagent volume and reaction time, or “text” such as solvent type, and diluting solvent.26 Formation of inter- and/or intra-CTC was viewed as two dependent response variables. Since more than one response is involved, a discrete analysis of these responses might lead to incompatible findings. Thus, a compromised analysis that includes the overall response into the final model must be considered.27,28 One of the widely used approaches is the “desirability function” which is implemented in almost all software packages.29,30 This function is based on finding a ‘composite desirability’ or in other words, it combines the different responses into one mutual response.
With the purpose of maximizing and optimizing the multiple responses ‘absorbance’ of the CTCs resulting from interaction of p-SY and p-CHL; an experimental design (DOE) was utilized. A 2-level full factorial design (FFD) was used for the screening process, while a face-centred central composite design (CCD) was employed for optimization. A desirability function was used to optimize the multiple responses.
2. Experimental
2.1. Materials and reagents
All reagents were of analytical grade. p-SY was purchased from Sigma-Aldrich (USA) and it was used as received. An HPLC grade p-CHL was purchased from Merck (Darmstadt, Germany). The solvent ethanol was analytically pure. Both p-CHL and p-SY were prepared as 1 mM and 10 mM respectively in ethanol. Further dilutions with the same solvent were carried out to obtain different working solutions.2.2. Apparatus
An Agilent diode array UV-Vis Spectrometer with 10 mm quartz cell was used for spectrophotometric measurements. A Jenway pH meter equipped with a glass combination electrode (UK) was used for adjusting pH of working solutions. A thermostatically controlled water bath (MLV, Salvis AG Emmenbruck, Luzern, Germany) was used throughout the work. A Minitab® 17 software (Minitab Inc., State College, Pennsylvania, USA) was used for screening and optimizing the factorial design.2.3. Reaction procedure
Aliquots of standard p-SY solution (1–5 mM) were transferred into 10 mL test tubes, followed by 5 mL of p-CHL solution, and the volume was made up to the mark with ethanol. The mixture was heated up in a water bath (60 °C) for 25 minutes. The absorbance of the resulting colored solution was measured at (300–700 nm) against a reagent blank similarly prepared.2.4. Experimental design
All the numerical variables that might affect the expected response are listed in Table 1. A 2-level FFD was used for the screening purpose. Upper and lower domains, in addition to one central point for each variable were defined. A 23-FFD (18 runs in the base design, 2 blocks, and 2 centre points in total added to the matrix of design) was executed and all factors were kept free from aliasing. In the second phase, tuning was done using a response surface design. A face-centred central composite design (FCCCD) was employed where the model was created from the full factorial design by adding 16 cube points, 12 axial points, and 12 central points in axial. Twenty experiments were performed in the base run, totalling 40 experiments after two replicates and within 2 blocks. The optimized response was obtained employing a polynomial fit and taking into account the quadratic terms. Multiple response optimization was done using overlaid contour plots and a composite desirability function (D). Three events were considered. In the first case, the goal was to maximize both responses; Y1 (absorbance of inter-CTC) and Y2 (absorbance of intra-CTC). Alternatively, Y1 was maximized while Y2 was minimized. In the last scenario, Y1 was minimized and Y2 was maximized. Proposed models were validated using the analysis of variance (ANOVA) at 95.0% confidence limits.| Screened factor “Numerical” | Symbol | Level | ||
|---|---|---|---|---|
| Low (−) | Center Pt (0) | High (+) | ||
| Temperature (°C) | A | 25.00 | 42.5 | 60.00 |
| Reagent volume (mL) | B | 1.00 | 3.00 | 5.00 |
| Reaction time (min) | C | 0.00 | 20.0 | 40.00 |
| Response | Y1, Y2 | Target | ||
3. Results and discussion
3.1. Charge transfer complex formation reaction
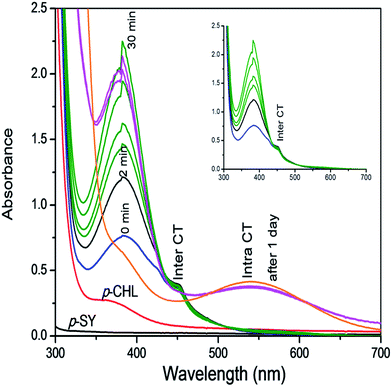
Investigations of the interaction between p-SY and p-CHL, as shown in Scheme 2 and Fig. 1 revealed that different types of complexes were formed in a timely controlled manner. Upon mixing a colourless solution of p-SY and a pale yellow solution of p-CHL in ethanolic medium, a lemon yellow colored inter-CTC was instantaneously formed which corresponds to the bands at 384 nm and 452 nm (Fig. 1: blue line). The band at 452 nm, which corresponds to the formation of p-CHL radical anion, increased for a period of 2 min (Fig. 1: black line). After 2 min, the radical anion band at 452 nm started to decrease and the band at 384 nm increased over a period of 30 min (Fig. 1: green line). After 30 min, the band at 384 nm decreased and a new band at 536 nm formed gradually (orange line), which corresponds to the intra-CTC. A clear isosbestic point can be observed at 426 nm.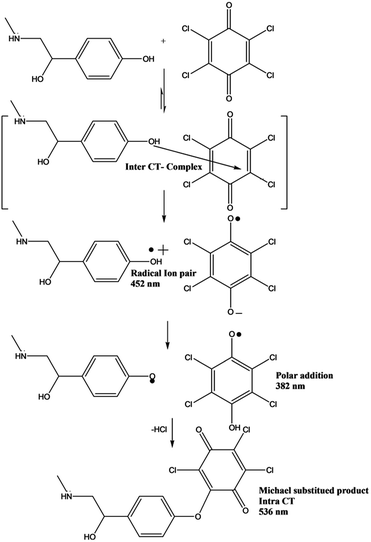 | ||
| Scheme 2 Suggested reaction mechanism for the formation of inter- and intra-CTCs due to interaction of p-SY with p-CHL. | ||
3.2. Assessment of substantial variables
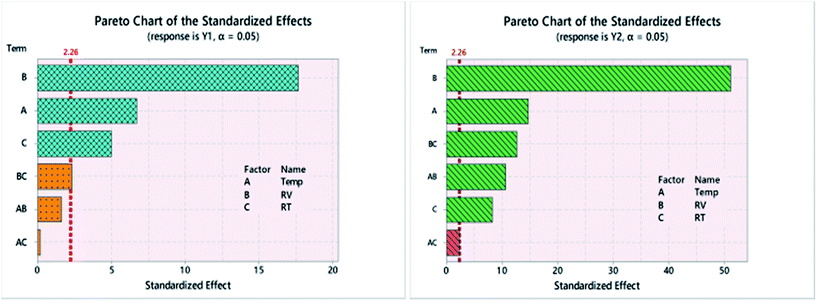
As shown in Table 1; three factors were able to affect the interaction of p-SY with p-CHL. The executed screening design (23-FFD) allowed the determination of main as well as the interactions of these factors. Using Pareto chart of standardized effects, the magnitude of each factor on the anticipated responses was determined.As shown in Fig. 2, the effect of the three factors as well as their second order interactions varied between Y1 and Y2. For both responses, the three main factors extend beyond the reference lines, indicating that all are substantial, with reagent volume (B, RV) being the most effective. The interactions (RV × RT) and (Temp × RV) strongly affected Y2, in comparison to a minor effect in case of Y1.
Similar implications were concluded employing half-normal and normal plots of standardized effects (figures are not shown).
On the other hand, detection of significant factors in the proposed multifactor model was also corroborated using ANOVA. In this test, all main effects as well as higher order interactions were considered. As shown in Table 2, the preliminary postulations were confirmed.
| Response | DFa | Y1 | Y2 | ||||||
|---|---|---|---|---|---|---|---|---|---|
| Source | Adj SSa | Adj MSa | F-Value | P-Value | Adj SSa | Adj MSa | F-Value | P-Value | |
| a DF is degrees of freedom, SS is sum of squares and MS is mean of squares. | |||||||||
| Model | 9 | 0.260132 | 0.028904 | 38.00 | 0.000 | 0.281896 | 0.031322 | 298.18 | 0.000 |
| Linear | 3 | 0.257216 | 0.085739 | 112.71 | 0.000 | 0.260570 | 0.086857 | 826.37 | 0.000 |
| A: Temp | 1 | 0.032194 | 0.032194 | 42.32 | 0.000 | 0.015686 | 0.015686 | 149.33 | 0.000 |
| B: RV | 1 | 0.209618 | 0.209618 | 275.56 | 0.000 | 0.244033 | 0.244033 | 2323.19 | 0.000 |
| C: RT | 1 | 0.015404 | 0.015404 | 20.25 | 0.002 | 0.000851 | 0.000851 | 8.10 | 0.022 |
| 2-Way interactions | 3 | 0.001908 | 0.000636 | 0.84 | 0.511 | 0.016426 | 0.005475 | 52.12 | 0.000 |
| A: Temp × B: RV | 1 | 0.000092 | 0.000092 | 0.12 | 0.736 | 0.002322 | 0.002322 | 22.10 | 0.002 |
| A: Temp × C: RT | 1 | 0.000069 | 0.000069 | 0.09 | 0.771 | 0.000953 | 0.000953 | 9.07 | 0.017 |
| B: RV × C: RT | 1 | 0.001747 | 0.001747 | 2.30 | 0.168 | 0.013151 | 0.013151 | 125.20 | 0.000 |
| 3-Way interactions | 1 | 0.000554 | 0.000554 | 0.73 | 0.418 | 0.000006 | 0.000006 | 0.06 | 0.819 |
| Curvature | 1 | 0.000111 | 0.000111 | 0.15 | 0.712 | 0.004866 | 0.000288 | 46.32 | 0.000 |
| Error | 8 | 0.006086 | 0.000761 | 0.000840 | 0.000105 | ||||
| Total | 17 | 0.266218 | 0.282737 | ||||||
3.3. Response transformation and modelling
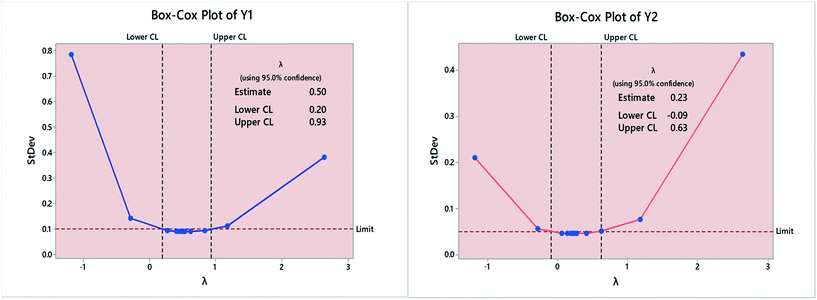
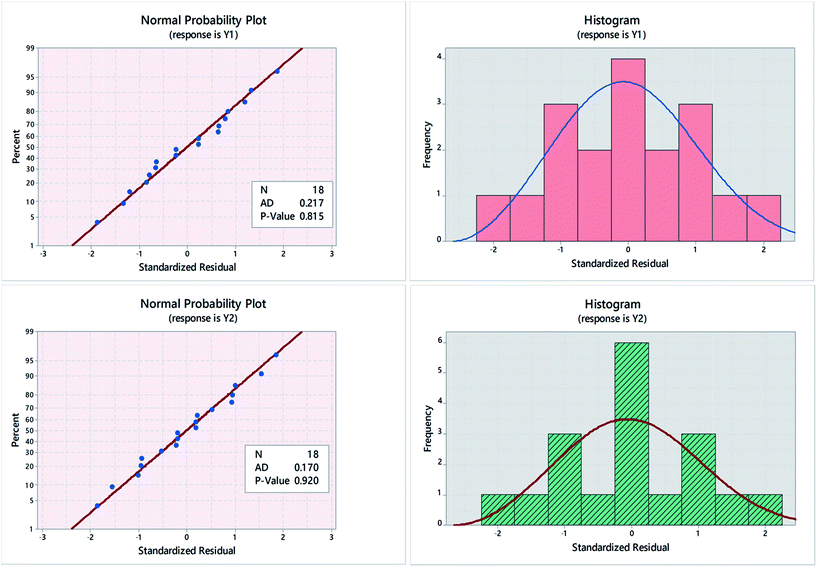
Residual plots (normplot, histograms, residuals versus fits, and residuals versus order) were used to examine goodness of fit in regression and ANOVA. Obtained normal probability plots and histograms showed an “s-shaped” distribution in case of Y1, compared to “bimodal” distributions in case of Y2, implying that the response variance (σY2) and though being related to the data mean (μY) in certain way, is not constant.31 Response transformations were necessary in this case, Fig. 3.32 As shown in Fig. 4, a better normal distribution was obtained after running Box–Cox transformation,33 where:| (Transformed response) Y′ = (Yλ − 1)/λ (transformation factor) | (1) |
Box–Cox plots were used to determine the need for data transformation as well as the optimal λ value. As shown in Fig. 3, optimal λ value was determined as the curve minima at 95.0% confidence interval (95.0% CI). Estimated λ value was 0.5 and 0.23 in case of Y1 and Y2, respectively. A range of values within the 95.0% CI was tested in terms of p-value and Anderson–Darling (AD) statistic.34
Transformation to normality was indicated primarily by p-values > 0.05. Moreover, smaller AD values; compared with non-transformed data further confirms that data are coming from a normal population. The most appropriate fit was obtained using λ = 0.8 in case of Y1 and =0.6 in case of Y2. Fig. 4, shows the normal probability plots and histograms for Y1 and Y2, following response variable transformation to remove data skewness. The R2 for the fitted model was 97.71% and 99.70% while the adjusted R2 value was 95.14% and 99.37%, for Y1 and Y2 respectively. The regression equation for the proposed model in un-coded units is:
| Y10.8 = 0.1460 − 0.00274Temp + 0.0582RV − 0.00159RT + 0.000099Temp × RV + 0.000019Temp × RT + 0.000096RV × RT − 0.000008Temp × RV × RT + 0.0079Ct Pt | (2) |
| Y20.6 = −0.0251 + 0.001250Temp + 0.03352RV − 0.000738RT + 0.000327Temp × RV − 0.000025Temp × RT + 0.000680RV × RT + 0.000001Temp × RV × RT + 0.05232Ct Pt | (3) |
Fitting obtained data to either “normal” or 3-parameter Weibull distribution fit provided a good fit for obtained data, Fig. 4.
3.4. Response surface design
A trial for optimization of individual responses using optimization plots and employing individual desirability function (d) on screening data was performed. In general, the desirability function assesses how well a ‘blend’ of selected variables affects the target established for individual responses.29,30 According to the screening results, all main factors had a significant effect on the response (p < 0.05), Table 2. Thus the three factors were considered for the optimization stage. Domains for each factor were redefined and carefully re-adjusted. In case of Y1, reaction temperature was kept in the range of 25–40 °C, compared to 40–60 °C in case of Y2. Reaction time was in the range of 0–10 min for Y1 and 20–40 min for Y2. Reagent volume was kept at 2–5 mL in both cases. The following set of variables achieved the goal, maximum Y1; A = 35.0 °C, B = 5.00 mL, and C = 0 min. Implying that the CTC was formed on spot (upon mixing and at room temperature). For Y2, best conditions were A = 60.0 °C, B = 5.00 mL, and C = 40 min.Both responses were initially described using a quadratic polynomial model. In case of Y1, normality of the assumption was not achieved. Exploiting Box–Cox normality plots showed that estimated λ value was 0.92 which can be rounded to 1, indicating that no need for transformation. However, a λ value of 0.6 showed the model best fit results. Subsequent ANOVA testing showed that formation of CTC at 452 nm would be best described using a reduced quadratic model, as follows:
| Y10.6 = 0.35610 + 0.12791RV − 0.05624RT − 0.04661Temp × Temp + 0.04391RV × RT | (4) |
For Y2, the preliminary normality postulation was verified with no need for transformation. Formation of intra-CTC at 536 nm would be best described using the following quadratic model:
| Y2 = 0.24891 + 0.01152Temp + 0.10368RV + 0.02323Temp × Temp − 0.01892RT × RT − 0.02145RV × RV + 0.01126Temp × RT + 0.02068Temp × RV + 0.01126RT × RV | (5) |
According to eqn (4) and (5), the effect of Temp on Y1 was insignificant compared to its positive effect on Y2. On contrary, RT has a negative effect on Y1 compared to no effect on Y2. Quadratic factors had a negative effect in case of Y1. The two way interactions; however, had a positive impact on both Y1 and Y2.
In both cases, the high R2 values, in addition to the insignificant lack-of-fit, designated that the proposed models describes each individual response with high significance.
Contour (2D) plots were used to investigate the probable relationship between the three variables. As shown in Fig. 5, the X and Y variables are plotted on the X and Y axes, respectively, and the response is denoted by the contour lines.
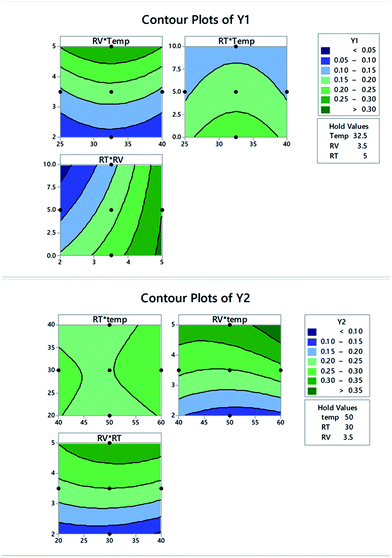 | ||
| Fig. 5 Two dimensional contour plots for FCC design showing Y1 and Y2 as a function of different variable interactions. | ||
Results obtained from individual desirability plots, contour plots and polynomial eqn (4) and (5) are in good agreement.
3.5. Multiple response optimization
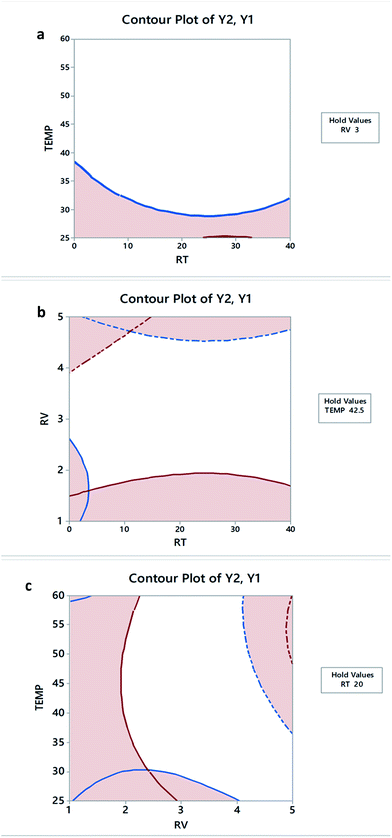
Analysing a single response was an easy exercise, where analysis of each model would simply pinpoint areas of desired results. On the other hand, simultaneous optimization of the two responses as a function of three variables was not that feasible. Two strategies were adopted for this purpose; overlaid contour plots and global desirability function. In both cases, and to account for both Y1 and Y2 at the same time, factor levels were returned to levels mentioned in Table 1.
 | (6) |
As shown on Fig. 7, where the target was to maximize the absorbance at the two wavelengths, the composite desirability was 0.9956. This value is close to 1.0000, indicating that the selected optimal conditions are in favour of both responses. Table 3 shows the other scenarios proposed for optimizing the responses and the corresponding values of global desirability.
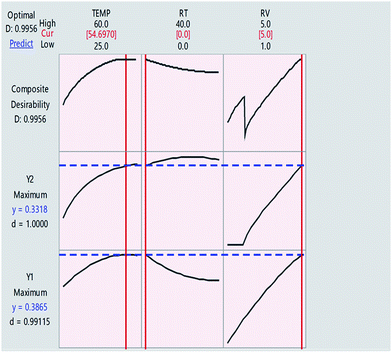 | ||
| Fig. 7 Desirability function plots for the FCC design. The horizontal dashed blue lines represent current response values. The vertical solid red lines show the optimal value for each variable. | ||
3.6. Spectral and physical characteristics of the CT complexes
The formation constant (KCT) and the molar extinction coefficient (ε) of the formed CTCs were determined using Scott's linear equation.37 This equation can be written as:
 | (7) |
![[thin space (1/6-em)]](https://www.rsc.org/images/entities/char_2009.gif) :
:![[thin space (1/6-em)]](https://www.rsc.org/images/entities/char_2009.gif) 1 D
1 D![[thin space (1/6-em)]](https://www.rsc.org/images/entities/char_2009.gif) :
:![[thin space (1/6-em)]](https://www.rsc.org/images/entities/char_2009.gif) A complex. Values of KCT and ε are listed in Table 4.
A complex. Values of KCT and ε are listed in Table 4.
| System | Temp (K) | λCT (nm) | K (L mol−1) | ε (L mol−1 cm−1) | ECT (eV) | ID (eV) | ΔG° (J mol−1) |
|---|---|---|---|---|---|---|---|
| a Complex was obtained employing ‘Case 2’ conditions. Scott's plot [eqn (7)] was used to calculate the rest of parameters.b Complex was obtained employing ‘Case 3’ conditions. Inversed Benesi–Hildebrand plot [eqn (8)] was used to calculate the rest of parameters. | |||||||
| Inter-CTCa | 298 | 452 | 875 | 5.55 × 10² | 2.75 | 9.14 | −1.68 × 10⁴ |
| Intra-CTCb | 333 | 536 | 167 | 1.42 × 10² | 2.32 | 8.61 | −1.42 × 10⁴ |
The large value of KCT implies that the formed complex is strong.38 With some restrictions on concentrations ([D] ≫ [A]), Scott's equation was not applicable (distorted linearity) when [D] ≈ [A]. In this case, several models have been tested.39–42 The best linearity was obtained employing the following equation:42
 | (8) |
Plotting 1/[D] against 1/d at 536 nm ‘Case 3, intra-CTC’ resulted in a linear plot (r2 = 0.9511, figure is not shown, Table 4).
The energy of the CTC can be calculated using the following formula:43
| ECTC = (hνCTC) = 1243.667/λCTC(nm) | (9) |
Using the formation constant (KCT), the standard free energy changes of CTC formation (ΔG°) can be calculated using the following equation:44
ΔG° = −2.303RT![[thin space (1/6-em)]](https://www.rsc.org/images/entities/char_2009.gif) log log![[thin space (1/6-em)]](https://www.rsc.org/images/entities/char_2009.gif) KCT KCT
| (10) |
The ionization potential (ID) of p-Sy as a donor; defined as the energy needed to remove one electron from the highest occupied molecular orbital (HOMO), can be calculated using the following formula:45a–c
| ID(eV) = 5.76 + 1.53 × 10⁻⁴νCTC | (11) |
3.7. Validation of the proposed method
Statistical validation of the suggested method was performed following the regulations of International Conference on Harmonization (ICH) on analytical method validation.46,47| Parameter | Value | Parameter | Value |
|---|---|---|---|
| a Regression equation: A = bC + a, where A is the absorbance, C is concentration in mM, a is intercept, b is slope, Sb = SD of slope, ±tSb = confidence limit for slope, Sa = SD of intercept, ±tSa = confidence limit for intercept, Sy/x = SD of the regression, SS is sum of squares.b LOD = limit of detection, LOQ = limit of quantification, r2 = coefficient of determination. | |||
| Wavelength, λmax (nm) | 536 | Slope (b) | 0.2111 |
| Linear rangea, (mM) | 2.50–5.00 | Intercept (a) | −0.3860 |
| Sb | 0.00538 | r2 | 0.9974 |
| ±tSb | 0.00431 | LODb (mM) | 0.1599 |
| Sa | 0.02069 | LOQb (mM) | 0.5330 |
| ±tSa | 0.01656 | Residual SS | 0.0005 |
| Sy/x | 0.01125 | Regression SS | 0.1950 |
Another measure of goodness-of-fit is the high value for coefficient of determination, r2 = 0.9974. Mean recoveries for application of the optimized procedure with the corresponding SD, and RSD are shown in Table 6.
| Concentration (mM) | Mean % recoverya ± SD | RSD (%) | Er (%) |
|---|---|---|---|
| a Mean ± SD of 3 determinations.b The inter-day (n = 3), average of three concentrations of p-SY repeated three times in three successive days.c The intra-day (n = 3), average of three concentrations of p-SY repeated three times within the same day. | |||
| Inter-day precision and accuracyb | |||
| 2.50 | 98.40 ± 0.400 | 0.406 | 1.601 |
| 3.50 | 100.76 ± 1.003 | 0.996 | −0.762 |
| 5.00 | 99.47 ± 0.833 | 0.837 | 0.533 |
![[thin space (1/6-em)]](https://www.rsc.org/images/entities/char_2009.gif) |
|||
| Intra-day precision and accuracyc | |||
| 2.50 | 99.20 ± 1.058 | 1.066 | 0.800 |
| 3.50 | 99.14 ± 2.157 | 2.175 | 0.857 |
| 5.00 | 100.20 ± 0.800 | 0.798 | −0.200 |
It is noteworthy to mention that the impact of factorial change on the target response can be also tested by moving the red lines showing the optimal value for each variable within the suggested range and noticing the effect on composite desirability, Fig. 7.
4. Conclusion
Charge transfer interaction between p-SY as an electron donor and p-CHL as an acceptor was studied employing a full factorial design (FFD) followed by a face-cantered central composite design (FCCCD). The two steps were statistically validated using ANOVA. Two types of responses were measured spectrophotometrically in the current investigation, inter- and intra-molecular CT complexes at two wavelengths. Formation constant was determined at both wavelengths. Multi-response optimization was performed using two approaches; graphical utilizing the overlaid contour plots, and mathematical using the Derringer function. Results obtained from both approaches indicate that the proposed paradigm is appropriate for detecting the response without running the experiment. In addition, employing the multivariate technique, and in comparison to the traditional one-variable-at-time approach, is significantly reflected on the method performance in terms of time, and resources consumption. It is noteworthy to mention that the majority of procedures reported for SY determination are based on HPLC, and GC, which are sophisticated and tedious in comparison to the current approach, especially after usage of DOE. Validation of the current method was executed using the ICH strategies, and results obtained reinforce the legitimacy of the optimized procedure.References
- S. C. Sweetman, Martindale: The Extra Pharmacopeia-The Complete Drug Reference, Pharmaceutical Press, 2007 Search PubMed.
- H. Wagner and G. Ulrich-Merzenich, Phytomedicine, 2009, 16, 97–110 CrossRef CAS PubMed.
- R. C. Baselt, Disposition of Toxic Drugs and Chemicals in Man, Biomedical Publications, Foster City, California, 8th edn, 2008, pp. 1471–1472, ISBN 978-0-9626523-7-0 Search PubMed.
- B. A. Arias and L. Ramón-Laca, J. Ethnopharmacol., 2005, 97, 89–95 CrossRef PubMed.
- A. Fugh-Berman and A. Myers, Exp. Biol. Med., 2004, 229, 698–704 CAS.
- S. Haaz, K. R. Fontaine, G. Cutter, N. Limdi, S. Perumean-Chaney and D. B. Allison, Obes. Rev., 2006, 7, 79–88 CrossRef CAS PubMed.
- Y. Liu, F. Xu, Z. Zhang, C. Yang, R. Song and Y. Tian, J. Chromatogr. Sci., 2009, 47, 925–930 CAS.
- B. T. Schaneberg and I. A. Khan, Pharmazie, 2004, 59, 819–8223 CAS.
- F. Tang, L. Tao, X. Luo, L. Ding, M. Guo, L. Nie and S. Yao, J. Chromatogr. A, 2006, 1125, 182–188 CrossRef CAS PubMed.
- B. Avula, S. K. Upparapalli and A. Navarrete, J. AOAC Int., 2005, 88, 1593–1606 CAS.
- L. G. Rossato, P. G. de Pinho, R. Silva, H. Carmo, F. Carvalho, Md. L. Bastos, V. M. Costa and F. Remião, J. Pharm. Biomed. Anal., 2010, 52, 721–726 CrossRef PubMed.
- L. G. Rossato, V. M. Costa, P. G. De Pinho, R. Silva, F. Carvalho, H. Carmo, M. D. L. Bastos and F. Remião, Toxicol. Lett., 2010, 196, S293 CrossRef.
- A. S. Andrade, G. C. Schmitt, L. G. Rossato, D. Russowsky and R. P. Limberger, Chromatographia, 2009, 69, S225–S229 CAS.
- C. Balraj, A. Satheshkumar, K. Ganesh and K. P. Elango, Spectrochim. Acta, Part A, 2013, 114, 256–266 CrossRef CAS PubMed.
- Š. Budzák, P. Mach, G. Juhász, M. Medved' and O. Kysel', Comput. Theor. Chem., 2015, 1051, 129–136 CrossRef.
- O. R. Shehab and A. M. Mansour, J. Mol. Struct., 2015, 1093, 186–194 CrossRef CAS.
- M. Schäferling, T. Lang and A. Schnettelker, J. Lumin., 2014, 154, 458–464 CrossRef.
- J.-M. Lü, S. V. Rosokha, I. S. Neretin and J. K. Kochi, J. Am. Chem. Soc., 2006, 128, 16708–16719 CrossRef PubMed.
- A. Saha and A. K. Mukherjee, Spectrochim. Acta, Part A, 2004, 60, 1731–1737 CrossRef PubMed.
- G. Powls, Free Radical Biol. Med., 1989, 6, 63–101 CrossRef.
- H. Nohl, W. Jordan and R. J. Youngman, Adv. Free Radical Biol. Med., 1986, 2, 211–279 CrossRef CAS.
- X.-Q. Zhu and C.-H. Wang, J. Org. Chem., 2010, 75, 5037–5047 CrossRef CAS PubMed.
- R. Leardi, Anal. Chim. Acta, 2009, 652, 161–172 CrossRef CAS PubMed.
- M. M. De Zan, C. M. Teglia, J. C. Robles and H. C. Goicoechea, Talanta, 2011, 85, 142–150 CrossRef CAS PubMed.
- A. A. Eiroa, P. Diévart and P. Dagaut, Talanta, 2010, 81, 265–274 CrossRef PubMed.
- Minitab 17 Statistical Software (2010). [Computer software], State College, PA: Minitab, Inc., www.minitab.com Search PubMed.
- M. A. Islam, M. R. Alam and M. O. Hannan, Composites, Part B, 2012, 43, 861–868 CrossRef CAS.
- S. Pal and S. K. Gauri, Qual. Eng., 2010, 22, 336–350 CrossRef.
- R. H. Myers and D. C. Montgomery, Response Surface Methodology: Process and Product Optimization Using Designed Experiments (Wiley Series in Probability and Statistics), Wiley, New York, 2009 Search PubMed.
- G. Derringer and R. Suich, J. Qual. Tech., 1980, 12, 214–219 Search PubMed.
- R. E. Bruns, I. S. Scarminio and B. B. Neto, Data Handling in Science and Technology, Statistical Design—Chemometrics, Elsevier, Amsterdam, 2006, vol. 25 Search PubMed.
- L. V. Candioti, M. M. De Zan, M. S. Cámara and H. C. Goicoechea, Talanta, 2014, 124, 123–138 CrossRef PubMed.
- G. E. P. Box and D. R. Cox, J. Roy. Stat. Soc. B, 1964, 26(2), 211–252 Search PubMed.
- T. W. Anderson and D. A. Darling, J. Am. Stat. Assoc., 1954, 49(268), 765–769 CrossRef.
- E. Sivertsen, F. Bjerke, T. Almøy, V. Segtnan and T. Næs, Chemom. Intell. Lab. Syst., 2007, 85, 110–118 CrossRef CAS.
- M. R. Hasniyati, H. Zuhailawati, R. Sivakumar and B. K. Dhindaw, Surf. Coat. Technol., 2015, 280, 250–255 CrossRef CAS.
- R. L. Scott, Recl. Trav. Chim. Pays-Bas, 1956, 75, 787 CrossRef CAS.
- M. Pandeeswaran and K. P. Elango, Spectrochim. Acta, Part A, 2009, 72, 789–795 CrossRef CAS PubMed.
- M. T. El-Haty, Spectrochim. Acta, Part A, 1991, 47, 1017–1021 CrossRef.
- M. M. Ayad, Spectrochim. Acta, Part A, 1994, 50, 671–676 CrossRef.
- N. J. Rose and R. S. Drago, J. Am. Chem. Soc., 1959, 81, 6138–6141 CrossRef CAS.
- G. B. Raju, Ph. D. thesis, Pondicheny University, Pondicheny, 2000.
- R. Rathore, S. V. Lindeman and J. K. Kochi, J. Am. Chem. Soc., 1997, 119, 9393–9404 CrossRef CAS.
- A. N. Martin, J. Swarbrick and A. Cammarata, Physical Pharmacy, Lee and Febiger, Philadelphia, PA, 3rd edn, 1969, p. 344 Search PubMed.
- (a) G. G. Aloisi and S. Pignataro, J. Chem. Soc., Faraday Trans., 1972, 69, 534 RSC; (b) G. Briegleb and J. Czekalla, Angew. Chem., 1960, 72, 401 CrossRef CAS; (c) G. Briegleb, Angew. Chem., 1964, 76, 326 CrossRef CAS.
- ICH, Q2A (R1), Validation of Analytical Procedures: Text and Methodology, International Conference on Harmonisation, November 2005 Search PubMed.
- J. N. Miller and J. C. Miller, Statistics and Chemometrics for Analytical Chemistry, Prentice Hall/Pearson, 2010 Search PubMed.
| This journal is © The Royal Society of Chemistry 2016 |

