
Understanding the effect of Mn2+ on Yb3+/Er3+ upconversion and obtaining a maximum upconversion fluorescence enhancement in inert-core/active-shell/inert-shell structures
Zhangyu Huangab,
Huiping Gaoab and
Yanli Mao*ab
aSchool of Physics and Electronics, Henan University, Kaifeng 475004, China. E-mail: ylmao@henu.edu.cn
bInstitute for Computational Materials Science, Henan University, Kaifeng 475004, China
First published on 19th August 2016
Abstract
In this study, the energy transfer (ET) mechanism among Yb3+/Er3+/Mn2+ has been revealed by download conversion (DC) and upconversion (UC) transients and steady-state fluorescence spectra. Moreover, the novel structure, inert-core/active-shell/inert-shell cubic NaYF4@NaYF4:Er3+/Yb3+/Mn2+@NaYF4, has been synthesized via a convenient hydrothermal method. With the excitation of a 980 nm laser diode, bright single-red upconversion (UC) fluorescence is observed, which shows the longest UC lifetime and highest efficiency compared with the other structures of NaYF4:Er3+/Yb3+/Mn2+, NaYF4:Er3+/Yb3+/Mn2+@NaYF4, and NaYF4@NaYF4:Er3+/Yb3+/Mn2+. The inert-core/active-shell/inert-shell nanocubes are homogeneous with an ultra-small (sub-20 nm) size, which is suitable for distribution and elimination in biological tissue. Our results indicate that the Mn2+ doping of δ-doped structures is an effective method to significantly improve UC single-red light, which shows great potential application in vivo bioimaging.
1. Introduction
Recently, lanthanide-doped NaYF4 nanocrystals have attracted a great deal of attention due to their unique UC luminescence properties and broad potential applications. In comparison with organic fluorophores and semiconducting nanocrystals, upconversion nanoparticles (UCNPs) offer high photochemical stability, sharp emission bandwidths, and large anti-Stokes shifts that separate discrete emission peaks from infrared excitation.1–4 Moreover, NIR sources are usually inexpensive and easy to use. In particularly, UCNPs with a small diameter and intense red emission should be comparable in size to the biomolecules they label and simultaneously not cause tissue absorption and autofluorescence problems by their emission.5 Therefore, luminescence imaging on the basis of single-red UCNPs is becoming a popular tool for biomedical assays and diagnosis.Since they are used for bioimaging, the brightness of UCNPs must be taken into account. In general, the brighter the UCNPs, the higher the signal-to-noise ratio. Despite the significant progress in the use of UCNPs, their low emission efficiency still limits their practical application in vivo imaging.6,7 This restriction is usually solved by employing many strategies, such as constructing composite NPs with Au and Ag nanoparticles,8,9 co-doping with other ions,10–12 and the use of core/shell13–16 or Janus structures.17 However, most of these methods are either difficult to implement or only suitable for individual lanthanide ions, and much less realized due to the small size of hydrophilic biological cells.
Among the UC materials, α-phase NaYF4 is reported as one of the most efficient hosts for greatly enhancing near-infrared (NIR) to single-red band up-conversion when tri-doped with Yb3+/Er3+/Mn2+ ions.18 Similar effects have been reported in several other KMnF3:Yb3+/Er3+, NaLuF4:Yb3+/Er3+/Mn2+, NaMnF3:Yb3+/Er3+, and MnF2:Yb3+/Er3+ materials. The explicit UC energy transfer mechanism among Yb3+/Er3+/Mn2+ is not very clear by sufficient experimental evidence. In this study, we attempt to reveal this mechanism. Moreover, in order to improve the UC efficiency in the Yb3+/Er3+/Mn2+ system, several types of core/shell structures of UCNPs are synthesized for investigation. Experimental results indicate that the NaYF4@NaYF4:Er3+/Yb3+/Mn2+@NaYF4 structure is the most efficient method to improve UC single-red luminescence.
2. Experimental
Chemicals and sample preparation
The chemicals used in this study were sodium fluoride (99.99%, Aladdin), sodium hydroxide (AR, Sinopharm Chemical), oleic acid (OA) (AR, Sinopharm Chemical), manganese chloride (AR, Aladdin) and the rare earth oxides yttrium oxide, ytterbium oxide and erbium oxide, all at the same concentration (99.99%, Aladdin). Before the synthesis, 2.5 mmol rare earth oxide was weighed and reacted with hydrochloric acid to generate a rare earth chloride solution in the concentration of 0.5 mmol mL−1. In addition, 20 mmol of NaF powder was dissolved in deionized water to prepare a 30 mL solution.![[thin space (1/6-em)]](https://www.rsc.org/images/entities/char_2009.gif) :1) several times to remove possible remnants.
:1) several times to remove possible remnants.Sample characterization
Phase identification of the core, core–shell and core–shell–shell crystal structure was done via X-ray diffraction (XRD) using a Philips X'Pert Pro X-ray diffractometer with Cu Kα radiation. Nanostructure and morphology were characterized via transmission electron microscopy (TEM) (JEOL JEM-2100, JP). Energy spectra were obtained via field emission scanning electron microscopy (FESEM) (HITACHI S4700, JP). Absorption spectra were measured on a Cary Series UV-Vis-NIR spectrophotometer (Agilent Technologies, USA). UC luminescence spectra, luminescence decay curves and time-resolved luminescence spectra were obtained on an FLS980E spectrometer (Edinburgh Instruments Ltd, UK).3. Results and discussion
Energy transfer among Yb3+, Er3+, and Mn2+ ions
In order to investigate the energy transfer mechanism among Er3+/Yb3+/Mn2+, five NaYF4 samples were synthesized, each doped with 20 mol% Yb3+, 2 mol% Er3+ and 0–40 mol% Mn2+ ions. Then, the crystal structure and phase purity of the five samples were examined via XRD, as shown in Fig. 1. The XRD pattern of NaYF4:Yb3+/Er3+ NPs can be assigned to a pure cubic NaYF4 crystal (JCPDS 06-0342), and no obvious extra diffraction peaks are detected, even when the Mn2+ ion concentration increases to 30 mol%. However, at 40 mol% Mn2+ doping, the appearance of some weak diffraction peaks, marked by asterisks, indicates the emergence of an impurity phase, which is from the NaMnF3 crystals (JCPDS 18-1224). Moreover, as guided by the dash line, the diffraction peak (111) shifts slightly to the higher-angle side with an increase in the concentration of the Mn2+ dopant, due to the substitution of Y3+ ions by the smaller Mn2+ ions in the host lattice, which results in a decrease in the unit-cell volume. Hence, in order to ensure a pure cubic phase, the highest Mn2+ doping concentration of 30 mol% must be controlled under the current synthetic conditions.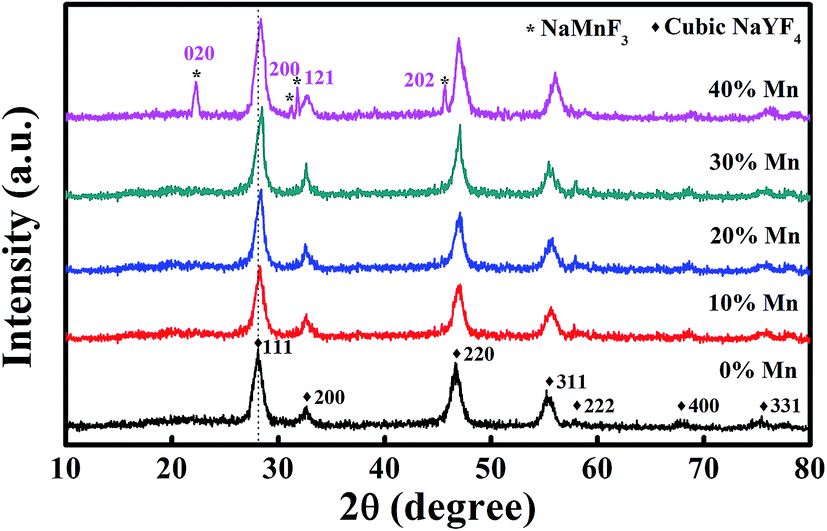 | ||
| Fig. 1 XRD patterns of NaYF4:Yb3+/Er3+ (20/2 mol%) with various concentrations of Mn2+ added to the initial reaction solution (0, 10, 20, 30 and 40 mol%). The dash line is shown to guide the eye. | ||
Fig. 2 shows the absorption spectra of the as-synthesized Yb3+/Er3+/Mn2+ tri-doped NaYF4 nanoparticles. As shown, absorption peaks at 363 nm, 380 nm, 448 nm, 488 nm, 520 nm, 650 nm and 800 nm are detected, which should be assigned to the 4I15/2 to 2G7/2, 4G11/2, 4F5/2, 4F7/2, 2H11/2, 4S3/2, 4F9/2 and 4I9/2 transitions of Er3+. In addition to the absorption of Er3+, two broad absorptions in the visible range (400–600 nm) and NIR wavelength range (900–1100 nm) are detected as well, which may be ascribed to 6A1 → 4T1 of Mn2+ and 2F7/2 → 2F5/2 of Yb3+, respectively. This result indicates that the Yb3+, Er3+ and Mn2+ ions are successfully doped into the host lattices; moreover, manganese in the nanocrystals are all in pure valence state of Mn2+.
 | ||
| Fig. 2 Absorption spectrum of the as-synthesized NaYF4:Yb3+/Er3+/Mn2+ (20/2/30 mol%) nanocrystals. | ||
The UC spectra of NaYF4:Yb3+/Er3+ co-doped with various amounts of Mn2+ were detected under the excitation of a Continuous Wave (CW) 980 nm NIR diode laser. As shown in Fig. 3, the luminescence intensity of the green emission (520–570 nm) decreases; moreover, the red emission increases monotonously with an increase in the dopant concentration. In addition, a “single-band” red UC emission is obviously seen in the 30 mol% and 40 mol% doped NPs. The green emission bands centered at 525/540 nm are attributed to the electronic transitions 2H11/2 → 4I15/2 and 4S3/2 → 4I15/2 of the Er3+ ions, respectively. The red UC luminescence band centered at 655 nm and 670 nm are assigned to the Er3+:4F9/2 → 4I15/2 transitions.
 | ||
| Fig. 3 Upconversion luminescence spectra of NaYF4:Yb3+/Er3+ (20/2 mol%) nanoparticles with different concentrations of Mn2+ added to the initial reaction solution (0, 10, 20, 30 and 40 mol%). | ||
Fig. 4(a) further shows the UC luminescence decay curves of the 4S3/2 and 4F9/2 levels of Er3+, which correspond to various amounts of Mn2+. It is observed that the presence of Mn2+ facilitates the relaxation of the 4S3/2 level and reduces the decay time, and meanwhile increases the lifetime of the red region emission of Er3+. It is well known that the lifetime of the excited state is inversely proportional to the radiative transition rate, the non-radiative transition rate and the energy transfer rate.19 The presence of Mn2+ in NaYF4:Yb3+/Er3+ may create a non-radiative energy transfer channel from the levels of 2H11/2 and 4S3/2 of Er3+ to Mn2+:4T1 owing to the resonances between the Mn2+ absorption bands and 2H11/2/4S3/2 levels of Er3+, which leads to an increase in the overall transition rate and thus a reduction in the fluorescence lifetime. For UC materials, a longer lifetime usually means a higher energy transfer rate from other levels to the emission level and a more efficient UC luminescence.20 The increase in the lifetime of Er3+:4F9/2 may be attributed to the energy transfer process from Mn2+ to Er3+ ions (Fig. 4(b)).
 | ||
| Fig. 4 UC luminescence decay curves of green (550 nm) (a) and red (650 nm) (b) emission of NaYF4:Yb3+/Er3+ with different Mn2+ concentrations added to the initial reaction solution (0, 10, 20 and 30 mol%). | ||
In order to verify in depth the existence of the energy transfer process from Mn2+ to Er3+ ions, we further synthesized some pure α-NaYF4 nanocrystals with three types of doping: Mn2+ 30 mol%, Er3+ 2 mol% and Mn2+/Er3+ (30/2 mol%). 400 nm photons directly excite the high level of Mn2+ to ensure the strongest intensity of the orange emission of Mn2+:4T1 → 6A1 due to the fact that 400 nm is the excitation peak of NaYF4:Mn2+, which is shown in the insert of Fig. 5. By comparing the down-conversion (DC) luminescence spectrum of the three samples in Fig. 5, an obvious red emission band centered at 655 nm and 670 nm appears for the NaYF4:Mn2+/Er3+ nanoparticles, whereas it does not appear for both the NaYF4:Mn2+ and NaYF4:Er3+ samples. Moreover, this result indicates that the energy transfer process from Mn2+ to Er3+ ions really exists, and the proposed DC mechanism between Mn2+ and Er3+ under the excitation of 400 nm is shown in Fig. 6.
 | ||
| Fig. 5 Luminescence spectra of NaYF4 doped with different elements and excited by a xenon lamp at 400 nm. Inset is the excited spectrum of NaYF4:Mn2+ monitored at 560 nm. | ||
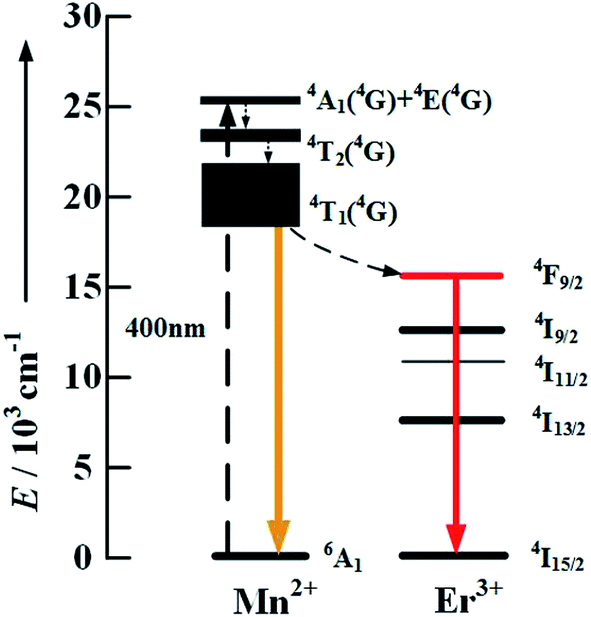 | ||
| Fig. 6 Energy level diagrams of the Er3+ and Mn2+ dopant ions and down-conversion mechanisms by 400 nm photon excitation. | ||
In order to more clearly and intuitively observe the variation in the UC luminescence process, time-resolved emission spectra for NaYF4:Yb3+/Er3+ (20/2 mol%) and NaYF4:Yb3+/Er3+/Mn2+ (20/2/30 mol%) were obtained under the excitation of a pulse 980 nm NIR diode laser. The spectra are shown in Fig. 7, in which the measuring time ranges from 0 μs to 500 μs, and the spectral wavelength are in the range of 500–700 nm. Obviously, in the 30 mol% Mn2+ doped NPs, the weak green emission still exists at 350 μs, which shows the “single-red-band” luminescence in Fig. 3. Furthermore, a faster decrease in the intensity of the green emission can be clearly seen in 30 the mol% Mn2+ doped nanocrystals compared with the Mn2+-absent nanocrystals. Moreover, the decrease rate of the intensity of the red light emission is slower in the Mn2+ doped samples. Moreover, the intensity of the red band emission in the range of 620 nm to 670 nm increases apparently in the 30 mol% Mn2+ doped nanoparticles at each time in the range of 0 μs to 500 μs compared with the Mn2+-absent nanocrystals. The results of the time-resolved emission spectra intuitively show that a longer lifetime of the red region emission of Er3+ will be obtained by the introduction of Mn2+ into NaYF4:Yb3+/Er3+ NPs.
 | ||
| Fig. 7 Time-resolved luminescence spectra of NaYF4:Yb3+/Er3+ (20/2 mol%) (a) and NaYF4:Yb3+/Er3+/Mn2+ (20/2/30 mol%) (b). | ||
According to the above mentioned analysis, the UC mechanism of Yb3+/Er3+/Mn2+ is proposed and shown in Fig. 7. Without Mn2+ doping, three UC fluorescence bands at 525 nm, 540 nm and 655 nm are detected under the excitation of 980 nm, due to the energy transfer from Yb3+ to Er3+. When Mn2+ ions are introduced into NaYF4:Yb3+/Er3+, a new energy transfer process between Mn2+ and Er3+ arises, which results in a decrease in the radiative transition rate of Er3+:4S3/2 and Er3+:2H11/2 levels to the ground state, whereas the population density of Mn2+:4T1 increases due to the resonance energy transfer. Subsequently, back-energy transfer from 4T1 of Mn2+ to the 4F9/2 level of Er3+ leads to an enhancement in the red emission. Since the Er3+:4F9/2 lifetime is shorter than Mn2+:4T1, there is no orange luminescence that corresponds to the Mn2+:4T1 → 6A1 transition (Fig. 8).
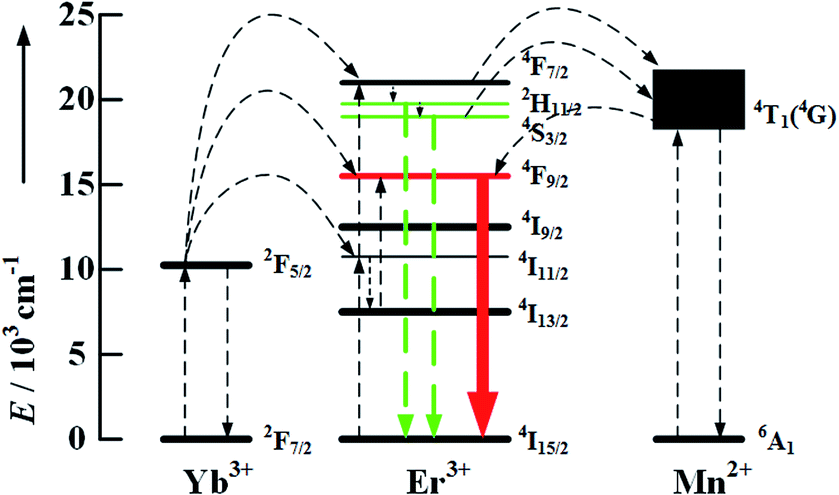 | ||
| Fig. 8 Energy level diagrams of the Er3+, Yb3+ and Mn2+ dopant ions and upconversion mechanisms by 980 nm photon excitation. | ||
Further luminescence enhancement in inert-core/active-shell/inert-shell nanocubes
The red emission is located in the optical transmission window of biological tissues, which shows minimum absorption and maximum penetration depth in biological tissue. Hence, it is meaningful to do some deeper work for further enhance the UC red luminescence intensity. Here, we try to synthesize δ-doped cubic NaYF4@NaYF4:Yb3+/Er3+/Mn2+@NaYF4 (C/Sd/S) nanocrystals with the doping ratio of Yb3+/Er3+/Mn2+ of 20/2/30. For comparison, three other types of structures of NaYF4:Yb3+/Er3+/Mn2+ (Cd), NaYF4@NaYF4:Yb3+/Er3+/Mn2+ (C/Sd) and NaYF4:Yb3+/Er3+/Mn2+@NaYF4 (Cd/S) are also prepared with the same doping proportion of Yb3+/Er3+/Mn2+ via similar synthetic methods. All the samples were characterized via XRD first, the results of which are exhibited in Fig. 9. It is observed that all the diffraction peaks of the samples correspond to the cubic NaYF4 crystal (JCPDS 06-0342), which indicate that all the crystals keep the cubic phase. According to the Scherrer formula, the average size of the as-prepared Cd, Cd/S, C/Sd and C/Sd/S nano-particles are 9.3 nm, 13.8 nm, 14.2 nm and 19.4 nm, respectively. | ||
| Fig. 9 XRD patterns of NaYF4:Yb/Er/Mn (20/2/30 mol%) (Cd), NaYF4:Yb/Er/Mn (20/2/30 mol%) @NaYF4 (Cd/S), NaYF4@NaYF4:Yb/Er/Mn (20/2/30 mol%) (C/Sd), and NaYF4@NaYF4:Yb/Er/Mn (20/2/30 mol%) @NaYF4 (C/Sd/S). | ||
Fig. 10 shows the TEM images and energy dispersive X-ray analysis (EDXA) of the different stages for the synthesis of the C/Sd/S samples. As shown, the average size and homogeneity of the nanocubes increase increasing shell layers. The average diameters of C, C/Sd and C/Sd/S are about 8 nm, 11 nm, and 18 nm, respectively, which are in accordance with the XRD analysis results. These are deemed as ideal sizes for use as biological labels. Moreover, with an increase in the reaction process, the nanoparticles show a clearer cubic shape, which indicates better crystallinity. Furthermore, it further indicates the success of the core–shell and core–shell–shell wrapping. The results of the EDXA analysis show auxiliary evidence for the successful preparation of all the C, C/Sd and C/Sd/S structures. By analyzing the EDXA data obtained from the inert NaYF4 core, we find that the elements in this NPs are only C, O, Na, Y and F, and no Yb3+/Er3+/Mn2+ ions are detected in the sample. The carbon and oxygen elements may be ascribed to the substrate, and as a result, it is certain that the core NPs have been successfully synthesized. The detection of Yb3+, Er3+ and Mn2+ atoms in the C/Sd structure NPs confirms that the obtained sample is a core–shell structure, with an NaYF4:Yb3+/Er3+/Mn2+ shell on the surface. By comparison with the C/Sd structure, it is noted that the ratio of Y3+/(Yb3+/Er3+/Mn2+) increases as an inert NaYF4 shell coating on the surface of C/Sd. This indicates that the doping is predominantly confined to the center layer and the C/Sd/S structure UCNPs have been synthesized successfully.
 | ||
| Fig. 10 TEM images, EDXA patterns and schematic of the as-synthesized NaYF4 core (C), NaYF4@NaYF4:Yb3+/Er3+/Mn2+ (C/Sd) and NaYF4@NaYF4:Yb3+/Er3+/Mn2+@NaYF4 (C/Sd/S) samples. The left column is in the same scale bar of 50 nm, and the middle column is in the same scale bar of 10 nm. | ||
The UC luminescence spectra of Cd, C/Sd, Cd/S and C/Sd/S are shown and compared in Fig. 11. Obviously, the NPs with the C/Sd/S structure show the highest quantum yield of other all the Cd, C/Sd and Cd/S structures. From calculations, the red UC fluorescence exhibits an approximate double enhancement after coating with the inert NaYF4 shell to the C/Sd structure. Due to the ultra-small C/Sd (about 11 nm) nanocrystals, the doped layer is exposed to the surface where strong quenching is expected, owing to surface recombination. However, in the C/Sd/S architecture, the outermost inert NaYF4 shell serves as a passivation layer, which decouples the dopant ions from the surface defects, resulting in an increase in UC fluorescence. Eliminating the influence of the surface, it is interesting to see that the UC luminescence intensity of C/Sd is greater than that of Cd.
 | ||
| Fig. 11 Upconversion luminescence spectra of NaYF4:Yb/Er/Mn (Cd), NaYF4@NaYF4:Yb/Er/Mn (C/Sd), NaYF4:Yb/Er/Mn@NaYF4 (Cd/S) and NaYF4@NaYF4:Yb/Er/Mn@NaYF4 (C/Sd/S) nanoparticles under 980 nm laser diode excitation. | ||
To further investigate the UC process in different structures, the UC luminescence decay curves of the red emission of Cd, C/Sd, Cd/S and C/Sd/S were detected and compared in Fig. 12. It is noted that the C/Sd/S samples have the longest lifetime of the samples. Furthermore, it can also be clearly seen that the lifetime of C/Sd is longer than that of Cd. All the results show that the samples that incorporate dopant ion Sd layers have a higher quantum yield than that of the dopant ions distributed uniformly throughout the particle, which is expressed as Cd.
 | ||
| Fig. 12 UC luminescence decay curves of red (660 nm) emission of NaYF4:Yb/Er/Mn (Cd), NaYF4@NaYF4:Yb/Er/Mn (C/Sd), NaYF4:Yb/Er/Mn@NaYF4 (Cd/S) and NaYF4@NaYF4:Yb/Er/Mn@NaYF4 (C/Sd/S) nanoparticles. | ||
The UC luminescence enhancement of the inert-core/active-shell/inert-shell structure in our experiments is in accord with the work of Z. Li et al.21 According to their theoretical analysis results, the 2D transfer rate is greater than the 3D transfer rate owing to the fact that the inert-core/active-shell/inert-shell structure has a minimum defect density. When activators are confined in Cd, a three dimensional distribution (3D) appears, whereas in the case of doping in Sd, it shows a two dimensional (2D) distribution owing to the thinner layer thickness. A concrete analysis of the Yb3+, Er3+ and Mn2+ tri-doped UC energy transfer process in our UC mechanism is as follows: the Yb3+ ions act as donors, which provide energy to the activator Er3+ ions, and the Mn2+ ions play the role of tuning the spectra of Er3+. Because the UC luminescence intensity of the Er3+ ions relies mainly on the energy provided by Yb3+, the energy transfer processes of Yb3+ ions should be considered and studied. It is known that there are three principal energy transfer pathways for Yb3+, which are Yb3+–Yb3+, Yb3+–Er3+ and Yb3+–defect transfers. The defects provide paths for nonradiative relaxation and are always distributed randomly throughout the nanoparticles. As a result, the energy transfer processes between the Yb3+ ions and defects occur randomly in the Cd doping samples. However, due to the planar doped C/Sd/S structure, the energy transfer processes between Yb3+ ions and defects are strongly suppressed. In addition, the Yb3+–Yb3+ energy transfer is a resonant transfer; therefore, the efficiency of the energy migration among the Yb3+ ions gradually increases along with a decrease in the effect of the quenching of the defect. Then, the energy transfer rate between Yb3+ and Er3+ increases. Therefore, in Fig. 12, the lifetime of the 4F9/2 levels of Er3+ increases obviously. The Cd/S structure only eliminates surface defects from the “exterior” surface of the doped core and cannot reduce inner (core) defects and suppress the energy transfer from Yb3+ to the inner defects in the nanocrystals. While keeping the same doping density as Cd, the C/Sd/S structure shows a shallow doping thickness; in addition, the two interfaces of the doping-layer are in contact with the conformal inert host material (NaYF4), which reduces more surface defects than that of the Cd structure. Therefore, the C/Sd/S structure shows a superior performance than the traditional core–shell structures and further causes a greater enhancement of the UC single-red emission, which will increase the signal-to-noise ratio in biological imaging and labeling.
4. Conclusions
In summary, we revealed the UC energy transfer mechanism of Yb3+/Mn2+/Er3+ tri-doped in uniform cubic NaYF4 nanoparticles through steady and dynamic fluorescence analyses. Furthermore, in order to further increase the UC red emission, a novel C/Sd/S nanostructure, which incorporates Yb3+/Mn2+/Er3+ ions in the middle two-dimensional layer, has been designed and synthesized via a convenient and fast hydrothermal method. In addition, for comparison, the Cd, C/Sd and Cd/S structures have also been prepared in our work. The measurement results of UC luminescence spectra and UC luminescence decay curves show that the C/Sd/S structure has the highest quantum yield and longest lifetime compared with the Cd, C/Sd and Cd/S structures. This is due to the fact that the C/Sd/S nanoparticles have smallest amount of defects and the highest energy transfer rate. The results suggest an effective method to significantly improve the red-light emission of lanthanide-doped nanocrystals, which show great potential application in vivo bioimaging.Acknowledgements
This study is supported by the Science and Technology Research Project of Henan Province (No. 142102210389), the National Science Foundation of China (Grant no. 21103043) and the Program for Innovative Research Team (in Science and Technology) in University of Henan Province (No. 13IRTSTHN017).Notes and references
- F. Wang, R. Deng, J. Wang, Q. Wang, Y. Han, H. Zhu, X. Chen and X. Liu, Nat. Mater., 2011, 10, 968 CrossRef CAS PubMed.
- F. Wang, Y. Han, C. S. Lim, Y. H. Lu, J. Wang, J. Xu, H. Y. Chen, C. Zhang, M. Hong and X. Liu, Nat. Lett., 2010, 463, 1061 CrossRef CAS PubMed.
- M. Haase and H. Schafer, Angew. Chem., Int. Ed., 2011, 50, 5808 CrossRef CAS PubMed.
- J. Shan and Y. Ju, Nanotechnology, 2009, 20, 11969 CrossRef PubMed.
- D. Tian, D. Gao, B. Chong and X. Liu, Dalton Trans., 2015, 44, 4133 RSC.
- L. Cheng, C. Wang and Z. Liu, Nanoscale, 2013, 5, 23 RSC.
- G. Chen, J. Shen, T. Y. Ohulchanskyy, N. J. Patel, A. Kutikov, Z. Li, J. Song, R. K. Pandey, H. Agren, P. N. Prasad and G. Han, ACS Nano, 2012, 6, 8280 CrossRef CAS PubMed.
- X. Chen, W. Xu and L. Zhang, Adv. Funct. Mater., 2015, 25, 5462 CrossRef CAS.
- P. Yuan, Y. H. Lee and M. K. Gnanasammandhan, Nanoscale, 2012, 4, 5132 RSC.
- J. Tang, L. Chen and J. Li, Nanoscale, 2015, 7, 14752 RSC.
- Y. Li, X. Cao and G. Wang, Sci. Adv. Mater., 2014, 6, 1037 CrossRef CAS.
- C. Zha, X. Kong and X. Liu, Nanoscale, 2013, 5, 8084 RSC.
- J. Shen, G. Chen and T. Y. Ohulchanskyy, Small, 2013, 9, 32139 CrossRef.
- G. Chen, H. Ågren and T. Y. Ohulchanskyy, Chem. Soc. Rev., 2015, 44, 1680 RSC.
- X. Chen, D. Peng and Q. Ju, Chem. Soc. Rev., 2015, 44, 1318 RSC.
- X. Huang, Opt. Lett., 2015, 40, 3599 CrossRef PubMed.
- Q. Ma, J. Wang and X. Dong, Chem. Eng. J., 2015, 260, 222 CrossRef CAS.
- G. Tian, Z. Gu and L. Zhou, Adv. Mater., 2012, 24, 1226 CrossRef CAS PubMed.
- X. Guo, W. Song and C. Chen, Phys. Chem. Chem. Phys., 2013, 15, 14681 RSC.
- F. Shi, J. Wang and X. Zhai, CrystEngComm, 2011, 13, 3782 RSC.
- Z. Li, W. Park, G. Zorzetto, J.-S. Lemaire and C. J. Summers, Chem. Mater., 2014, 26, 1770 CrossRef CAS.
| This journal is © The Royal Society of Chemistry 2016 |