Silver nanoparticle decorated polyaniline/multiwalled super-short carbon nanotube nanocomposites for supercapacitor applications
Li Tangab,
Fang Duana and
Mingqing Chen*a
aSchool of Chemical and Material Engineering, Jiangnan University, Wuxi 214122, China. E-mail: mq-chen@jiangnan.edu.cn
bWuxi Tourism and Commerce Branch of Jiangsu Union Technical Institute, Wuxi 214035, China
First published on 4th July 2016
Abstract
In order to increase the utilization of the closed pore volumes of carbon nanotubes (CNTs), multilayer super-short carbon nanotubes (SSCNTs) have been synthesized by tailoring the raw multiwalled carbon nanotubes (MWCNTs) with a simple ultrasonic oxidation-cut method. Then silver nanoparticles with high dispersion on the surface of the hybrid nanocomposites (SSCNTs/PANI/Ag) consisting of SSCNTs with polyaniline were acquired by reduction of silver nitrate with Vitamin C. It is found that the final composite exhibits excellent capacitive performance with a specific capacitance as high as 615 F g−1 at 1 A g−1 which is much higher than that of PANI (316 F g−1) and PANI/Ag (454 F g−1). Moreover, it also shows better electrical conductivity (18.5 S cm−1). The greatly enhanced capacitive performance of the nanocomposite is mainly attributed to the introduction of silver nanoparticles, which can increase the electrical conductivities of the nanocomposites and promote the electron transfer between the active components. Furthermore, the open-ended pipes of SSCNTs provide abundant additional transport paths and a short axial dimension so that it can shorten the transmission distance for the electrolyte ions and electrons in the electrode. This study suggests that SSCNTs/PANI/Ag is a promising class of electrode material for high performance energy storage applications.
1. Introduction
Supercapacitors can be divided into electric double layer capacitors and pseudo-capacitors based on the storing charges at the electrode/electrolyte interface and faradic redox reactions occurring at the interfaces, respectively.1,2 Conducting polymers have received a lot of research interest due to their high conductivity and have become trendy basic materials for advanced applications such as energy storage and batteries etc.3,4 Among various conducting polymers, polyaniline has been attracting much more attention due to its superior properties such as high pseudocapacitance, light weight, low cost, controllable electrical conductivity, high energy density, environmental friendliness, chemical stability and facile synthesis, and is widely used in the fabrication of pseudo-capacitors. However, it exhibits poor cycling stability due to the damage of structures during the charge/discharge process.5 The carbon based materials (carbon nanotubes, activated carbon, and grapheme) could address the above problem and have been used in electrochemical double layer supercapacitors due to their outstanding chemical and physical properties. Unfortunately, the EDLC-based capacitors suffer from high cost and low capacitance.6 Therefore, there is currently an impending need to improve their performance to meet the increasing urgent demand for energy storage and stringent requirements in a variety of potential applications. The higher conductivity and better charge transfer channels of CNTs make it a most promising material for energy saving applications. In particular, the conducting polymers/CNTs materials composites can be the superior supercapacitor electrode materials in theory and practice.The conducting polymers/CNTs materials could exhibit different capacitive performance based on morphological modification or electronic interaction between these two components PANI and CNTs.7 Specifically, the introduction of CNTs into the polymeric matrices would enhance the specific surface area and thereby improve the electrical conductivity and electrochemical properties.8 Nowadays, the main strategies to improve the supercapacitor performances are to increase the surface area and electrical conductivity of electrode materials. Moreover, metal based conducting polymers/CNTs composites studies have generated enormous research interests due to their exciting properties. Silver is an important metal for producing nanoparticles due to its high conductivity and also high thermal stability.9,10 Moreover, the silver nanoparticles were incorporated into the CNTs/PANI composites in order to increase the conductivity and thermal stability of the hybrid nanocomposites.11 Introduction of Ag nanoparticles into CNTs/PANI could enhance the thermal, optical, mechanical, and conducting properties, resulting in a new class of important materials suitable for electrochemical supercapacitor. Recently, the CNTs/PANI/Ag composites have been synthesized by using various synthetic procedures and being analyzed by different characterization techniques. Nguyen et al. reported CNTs/PANI/Ag nanocomposites by in situ polymerization and found the highest electrical conductivity of 15.4 S cm−1 and also expected to have potential applications as cathode materials for supercapacitor due to high electrochemical activity and better cyclic stability.12 Grinou et al. reported CNTs/PANI/Ag hybrid nanocomposites by emulsion polymerization methods and obtained better electrical conductivity of 1.685 S cm−1.13 Dhibar et al. reported the CNTs/PANI/Ag nanocomposite showed better electrical conductivity of 4.24 S cm−1, and the highest specific capacitance of 528 F g−1 has been obtained at 5 mV s−1 scan rate.14 Kim et al. reported Ag nanoparticles were deposited on MWCNTs by chemical reduction while Ag-MWCNTs/PANI composites were prepared by oxidation polymerization, and Ag-MWCNTs/PANI exhibited the highest specific capacitance of 205 F g−1 compared with MWCNTs/PANI (162 F g−1).15 However, these MWCNTs are long, highly tangled ropes and their ends are closed, which lead to the inadequate utilization of their closed pore volumes in the supercapacitor application. Therefore, with the aid of sonication, the introduction of acidified SSCNTs adequately could increase the utilization of closed pore volumes of MWCNTs and disperse uniformly in water due to their abundant oxygen functional groups, and it is expected that the evenly decoration of SSCNTs/PANI composite with Ag nanoparticles would further improve its conductivity and capacitive performance.
Here, the SSCNTs are synthesized by the modification of long and tortuous MWCNTs through a simple ultrasonic oxidation-cut method. The axial dimension of SSCNTs in molecule scale can enhance utilization of closed pore volumes of CNTs. Furthermore, the SSCNTs has abundant carbon atoms on the edge, which are more active for electrochemical reactions.16 This is because the SSCNTs have the abundant oxygen functional groups (hydroxyl, carbonyl and carboxyl groups), which allows Ag nanoparticles to interact with the SSCNTs through physisorption, electrostatic binding or through charge-transfer interactions. Subsequently, the hybrid nanocomposites consisting of the functionalized SSCNTs with polyaniline were fabricated by a simple methodology and the silver nanoparticles are dispersed on the surface of the hybrid nanocomposites. The SSCNTs/PANI/Ag ternary composite is prepared through an efficient two-step approach. Hence, the SSCNTs/PANI/Ag composite exhibits significantly improved capacitive performance for supercapacitors.
2. Experimental
2.1 Materials
MWCNTs, 10–20 nm in diameter and 10–20 μm in length were purchased from Chengdu Organic Chemical Co. Ltd., Chinese Academy of Sciences (China). Aniline was distilled twice under vacuum and stored in the dark below 0 °C, and ammonium peroxydisulfate (APS), hydrochloric acid, silver nitrate, dimethylformamide (DMF) were of analytical grade. Vitamin C, acetylene black and polytetrafluoroethylene (PTFE) 60 wt% dispersion were obtained from Sigma-Aldrich. All chemicals except MWCNTs were used as received without further purifications.2.2 Preparation of materials
![[thin space (1/6-em)]](https://www.rsc.org/images/entities/char_2009.gif) 000 rpm and separate out the product. At last, the concentrated solution was dried at 80 °C under vacuum for 12 h.
000 rpm and separate out the product. At last, the concentrated solution was dried at 80 °C under vacuum for 12 h.2.3 Electrochemical measurements
All the nanocomposites were electrochemically characterized by cyclic voltammetry (CV), galvanostatic charge–discharge (GCD) and an electrochemical impedance spectroscopy (EIS) study by using a CHI 730B electrochemical workstation system (Shanghai Chenhua Instrument Factory, China). A three-electrode system was employed for all measurements using 3 M NaOH as the electrolyte, where the samples coated the nickel foam electrode, platinum foil and Ag/AgCl (satd. KCl) served as the working electrode, the counter electrode and the reference electrode, respectively. A mixture of 90 wt% active materials, 5 wt% acetylene black and 5 wt% PTFE (60 wt%) in N-methylpyrrolidone was coated onto the nickel foam plate with a definite area of 1 cm2 was used as the working electrodes. The mass of the active materials in the electrodes is about 5.0 mg. CV tests were measured at 10 mV s−1 scan rate within a voltage range of −0.4–0.6 V (vs. SCE) and the galvanostatic charge/discharge curves were recorded at the current density range of 1–5 A g−1. EIS was conducted by applying an AC voltage with a 5 mV amplitude in a frequency range from 0.01 Hz to 100 kHz under open circuit potential conditions. The electrical conductivity of the samples were measured by conventional four-electrode probe methods with compressed pellets.2.4 Characterization
The UV-visible spectroscopy analysis was performed by dissolving all of the materials in DMF solvent by using a Perkin-Elmer, Lambda 750 spectrophotometer. The X-ray powder diffraction (XRD) was conducted by using the Rigaku Rotaflex D/Max diffractometer with Cu Kα of wavelength λ = 1.5418 Å. The Raman spectroscopy was carried out at an excitation wavelength of 532 nm from a He–Ne laser excitation source of a Renishaw Raman microscope. The morphologies of the as-prepared samples were observed by scanning electron microscope (SEM) (Hitachi S-4800) and TEM (JEM-2100) at 200 kV.3. Results and discussion
3.1 SEM analysis
The FESEM images of the MWCNTs, SSCNTs, PANI, PANI/Ag and SSCNTs/PANI/Ag composites and the typical EDX spectrum of the SSCNTs/PANI/Ag are shown in Fig. 2, respectively. As seen in Fig. 2a, the MWCNTs with the length of 10–15 μm are highly tangled with each other into a network. After ultrasonic tailoring under the condition of strong oxidizer, a mass of SSCNTs jump into our sight from Fig. 2b and their length distributes in the range of 50–300 nm, which is far less than that of the MWCNTs. Moreover, the as-prepared SSCNTs have rich structural features, such as nanoscaled length, open ends, abundant carbon atoms on the edge and so on. Fig. 2c exhibits the PANI particles as nanosized and the morphologies of rod-like particles. As seen in Fig. 2d, it is observed that there is a formation of nonagglomerated uniformly packed Ag nanoparticles on the surface of the PANI. The high surface area to volume ratio of the Ag nanoparticles provides a high charge/discharge rate and also specific capacitance. The Ag has several positions for doping and tends to bind with nitrogen sites of PANI leading to interchain linkage between many adjacent PANI chains by coordination.17 The incorporation of the silver nanoparticles into the SSCNTs/PANI composite is shown in Fig. 2e because of different brightness. To check the presence of Ag nanoparticles in the SSCNTs/PANI/Ag nanocomposite, the typical EDX spectrum of the SSCNTs/PANI/Ag nanocomposite is shown in Fig. 2f. From the EDX spectrum, it is confirmed that the Ag nanoparticles are present in the nanocomposite, which is in agreement very well with XRD results. Moreover, the content of Ag element was about 40% in quality, suggesting that Ag nanoparticles were indeed existed in the composite.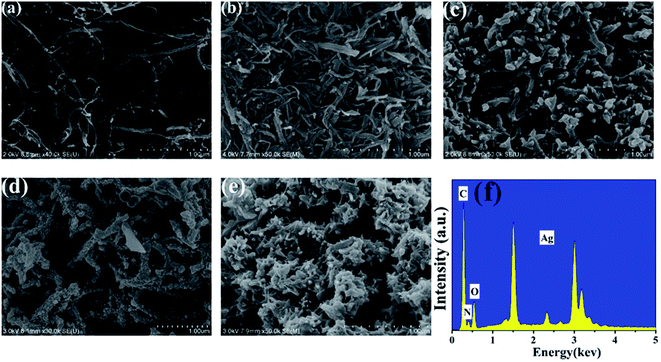 | ||
| Fig. 2 FESEM images of (a) MWCNTs, (b) SSCNTs, (c) PANI, (d) PANI/Ag, (e) SSCNTs/PANI/Ag and (f) the EDX spectrum of SSCNTs/PANI/Ag. | ||
3.2 TEM analysis
The TEM images of MWCNTs, SSCNTs and SSCNTs/PANI/Ag are shown in Fig. 3, respectively. The MWCNTs are highly tangled with each other like a web in Fig. 3a. As seen in Fig. 3b, the length of SSCNTs (about 300 nm) is far less than that of the MWCNTs after ultrasonic tailoring, and the average diameter of SSCNTs is a little larger than that of MWCNTs because there are the abundant oxygen functional groups on the surface of SSCNTs. The axial dimension of SSCNTs in molecule scale can not only accelerate the process of adsorption/desorption but also enhance utilization of closed pore volumes of CNTs.16 Ag nanoparticles were distributed with a spherical shape on the surface of the SSCNTs/PANI composites without agglomeration in Fig. 3c, which also was confirmed by X-ray diffraction. The average diameter of SSCNTs/PANI/Ag was found to be 40–50 nm, indicating the successful coating of the SSCNTs (average diameter 10–20 nm), and Ag nanoparticles with an average diameter of about 5–10 nm are uniformly distributed with a spherical shape on the SSCNTs/PANI surface. The main reason for the highly dispersion of Ag nanoparticles may due to the π–π* interaction between the SSCNTs and the aniline monomer as well as the hydrogen bonding interaction among the carboxyl groups of the SSCNTs and the amino groups of the aniline monomers.143.3 UV-visible spectroscopy analysis
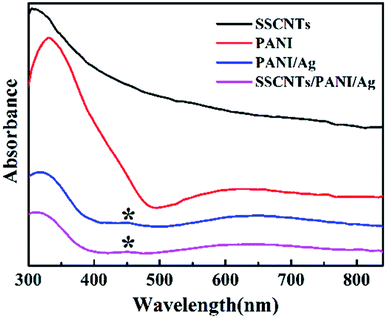
Fig. 4 shows the UV-visible spectra of SSCNTs, PANI, PANI/Ag and SSCNTs/PANI/Ag, respectively. No absorption peaks were observed for SSCNTs, and PANI exhibited two absorption bands at 330 and 630 nm. The band at 330 nm is attributed to the π–π* transitions in the benzenoid units of the PANI chains, while the absorption band at 630 nm is attributed to the exciton-like transition in quinonoid units. The absorption spectrum of the SSCNTs/PANI/Ag system displayed three absorption bands at 312, 450 and 645 nm, whereas the spectra of PANI/Ag nanocomposite exhibited three absorption peaks at 303, 450 and 657 nm. The peak appeared at 450 nm, corresponding to the surface plasmon resonance of the silver nanoparticles that were embedded in the polymer matrix.18 The red shift of the absorption band from 330 nm to 312 nm and the blue shift of the absorption band from 630 nm to 645 nm may be due to the interaction of Ag nanoparticles to the PANI chains.14 For the SSCNTs/PANI/Ag composite, the blue shift in the band indicates the interaction between quinonoid and benzenoid rings and SSCNTs. These results confirmed the interaction between polyaniline and the silver nanoparticles.3.4 XRD analysis
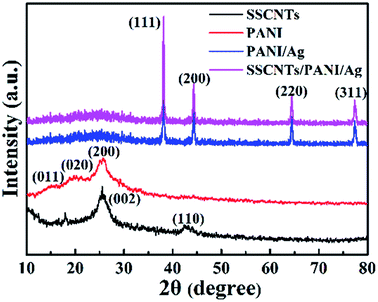
The XRD patterns of the SSCNTs, PANI, PANI/Ag and SSCNTs/PANI/Ag are shown in Fig. 5. For the SSCNTs, there are two crystalline peaks present at 25.9° and 43°, corresponding to the (002) and (110) crystalline planes, respectively. The crystalline peak at 25.9° appears due to the crystalline plane, and the other crystalline peak at 43° corresponds to the graphitic plane collectively with little catalytic particle encapsulated inside the MWCNTs walls.19,20 For the PANI, the characteristic peaks appear at 15.1°, 20.6°, 25.3° corresponding to the (011), (020), and (200) crystalline plane, respectively.21 For the SSCNTs/PANI/Ag nanocomposite, the sharp crystalline peaks appearing at 38.10°, 44.25°, 64.38°, and 77.42° corresponded to the face-centered cubic (fcc) phase of silver (111), (200), (220), and (311), respectively.22 The same crystalline peaks were observed for the PANI/Ag composite. The existence of sharp peaks in both PANI/Ag and SSCNTs/PANI/Ag clearly indicates the presence of Ag nanoparticles in the nanocomposite with their crystalline nature, confirming the successfully incorporation of the silver nanoparticles into the SSCNTs/PANI composite. For the PANI/Ag and SSCNTs/PANI/Ag nanocomposite, it was observed that all of the XRD patterns show a broad peak at 2θ values of ∼17–30°. This is mainly because of the amorphous behavior of PANI. The disappearance of the peak at 25.9° and 43° of the SSCNTs planes in the SSCNTs/PANI/Ag composites may be caused by the tube wall defects in the acid treatment and polymer grafting processes.23,243.5 Raman spectroscopy
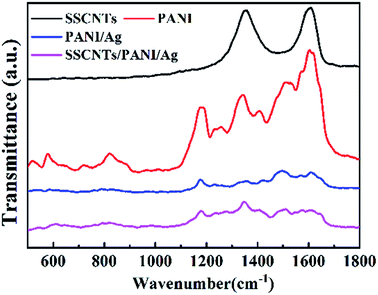
The Raman spectra of the SSCNTs, PANI, PANI/Ag and SSCNTs/PANI/Ag are shown in Fig. 6. The peak locating at 1350 cm−1 (D band), responds to the breathing modes of rings or k-point phonons of A1g symmetry, which is usually used to characterize the defects on the SSCNTs surface. The G band located 1596 cm−1 peak is consistent with the splitting E2g stretching mode of graphite and the peak at 2696 cm−1 (2D band) arising from a second harmonic of the D band.25 For PANI, the characteristic peaks appear at 1171 cm−1, 1488 cm−1 and 1590 cm−1 are corresponding to the C–H bending, C![[double bond, length as m-dash]](https://www.rsc.org/images/entities/char_e001.gif) N stretching and C
N stretching and C![[double bond, length as m-dash]](https://www.rsc.org/images/entities/char_e001.gif) C stretching respectively, which are the characteristic peaks of the quinoid segment. The other two peaks of PANI appearing at 1241 cm−1 and 1618 cm−1 indicate the C–H bending and C–C stretching of the benzenoid ring.26,27 Moreover, the characteristic band of C–N˙+ at 1340 cm−1 demonstrates the formation of a radical cation on the doping and co-doping of PANI.28 For the PANI/Ag and SSCNTs/PANI/Ag composites, C–H bending of the quinoid ring at 1176 and 1181 cm−1, C
C stretching respectively, which are the characteristic peaks of the quinoid segment. The other two peaks of PANI appearing at 1241 cm−1 and 1618 cm−1 indicate the C–H bending and C–C stretching of the benzenoid ring.26,27 Moreover, the characteristic band of C–N˙+ at 1340 cm−1 demonstrates the formation of a radical cation on the doping and co-doping of PANI.28 For the PANI/Ag and SSCNTs/PANI/Ag composites, C–H bending of the quinoid ring at 1176 and 1181 cm−1, C![[double bond, length as m-dash]](https://www.rsc.org/images/entities/char_e001.gif) N stretching of the quinoid ring at 1497 and 1512 cm−1, C
N stretching of the quinoid ring at 1497 and 1512 cm−1, C![[double bond, length as m-dash]](https://www.rsc.org/images/entities/char_e001.gif) C stretching of the quinoid ring at 1603 and 1609 cm−1, C–H bending of the benzenoid ring at 1232 and 1235 cm−1, C–C stretching of the benzenoid ring at 1639 and 1647 cm−1, and C–N˙+ stretching at 1342 and 1347 cm−1 were observed, revealing the presence of the doped PANI structure. These Raman spectra were almost identical to pure PANI, indicating that the SSCNTs served as the core in the formation of the tubular shell of the SSCNTs/PANI/Ag composites, therefore, the polymerization was successful on the surface of the SSCNTs, and the incorporation of the silver nanoparticles did not damage the polyaniline structure. The intensity of the bands changed, and their wave number slightly shifted in the spectra of the nanocomposites compared to pure polyaniline, indicating a good interaction between polyaniline and the SSCNTs. Interestingly, the intensity of the C
C stretching of the quinoid ring at 1603 and 1609 cm−1, C–H bending of the benzenoid ring at 1232 and 1235 cm−1, C–C stretching of the benzenoid ring at 1639 and 1647 cm−1, and C–N˙+ stretching at 1342 and 1347 cm−1 were observed, revealing the presence of the doped PANI structure. These Raman spectra were almost identical to pure PANI, indicating that the SSCNTs served as the core in the formation of the tubular shell of the SSCNTs/PANI/Ag composites, therefore, the polymerization was successful on the surface of the SSCNTs, and the incorporation of the silver nanoparticles did not damage the polyaniline structure. The intensity of the bands changed, and their wave number slightly shifted in the spectra of the nanocomposites compared to pure polyaniline, indicating a good interaction between polyaniline and the SSCNTs. Interestingly, the intensity of the C![[double bond, length as m-dash]](https://www.rsc.org/images/entities/char_e001.gif) N stretching band of the quinoid ring for PANI/Ag and SSCNTs/PANI/Ag composite was dramatically decreased, indicating that the silver nanoparticles were chemically bonded to this functional group.29
N stretching band of the quinoid ring for PANI/Ag and SSCNTs/PANI/Ag composite was dramatically decreased, indicating that the silver nanoparticles were chemically bonded to this functional group.29
3.6 Cyclic voltammetry and galvanostatic cycling analysis
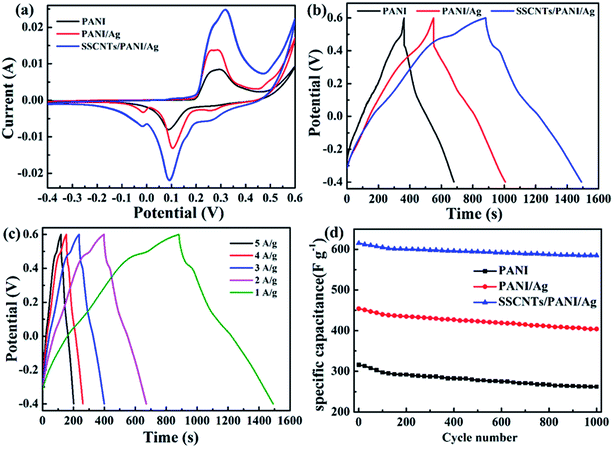
Fig. 7 shows CV, GCD and cycling life curves of the prepared samples. The capacitive performances of the PANI, PANI/Ag and SSCNTs/PANI/Ag nanocomposites were measured by cyclic voltammetry in 3 M NaOH solution at 10 mV s−1 scan rate, as shown in Fig. 7a. In the CV curve, the negative current region denotes the cathodic reduction and the positive current region indicates the anodic oxidation, respectively. Compared with PANI, the PANI/Ag composite shows the weak anodic peak at 0.25 V and the cathodic peak at −0.01 V, which again proves the presence of Ag nanoparticles.14 The same type of the anodic peak and cathodic peak is also observed at 0.26 V and −0.02 V for SSCNTs/PANI/Ag. This peak shifting phenomenon of the nanocomposite is due to electrode resistance. Whereas, for PANI/Ag and SSCNTs/PANI/Ag, they have in common a pair of hydrogen adsorption/desorption weak peaks at 0.27 and 0.50 V due to the redox of Ag nanoparticles.30 Compared with PANI and PANI/Ag composite, the SSCNTs/PANI/Ag composite exhibits a larger enclosed area, reflecting a larger specific capacitance, and the higher value of specific capacitance can in fact be attributed to both the EDLC formation occurring at SSCNTs and the pseudocapacitance arising from the redox charge transfer reaction occurring at PANI. The specific capacitance values of the composites can be obtained from the capacitive current (for non-rectangular shape) with the help of the following equation:31–34where I+ and I− are maximum current in positive and negative voltage scan respectively, v is the scan rate and m is the mass of the composite materials.
For SSCNTs/PANI/Ag, the specific capacitance was 665 F g−1 at a 10 mV s−1 scan rate; whereas the specific capacitance of PANI and PANI/Ag were 337 F g−1 and 518 F g−1, respectively. The better specific capacitance of PANI/Ag compared to pure PANI may be due to the presence of Ag nanoparticles which enhances the capacitance value. The increase in the specific capacitance of SSCNTs/PANI/Ag nanocomposite can be attributed to the following possible reasons: (a) the SSCNTs have the higher surface area compared with that of MWCNTs, thereby increasing the contact area with the electrolyte; (b) the open-ended pipes of SSCNTs can provide abundant additional transport paths and short axial dimension shortens the transmission distance for the electrolyte ions and electrons in the electrode, thus ensuring that plenty of ions can come in contact with the surface of the active material in a short period; (c) the presence of Ag nanoparticles in the nanocomposite may be responsible for the enhancement of the specific capacitance; (d) there is a good interaction between SSCNTs and PANI and Ag nanoparticles; (e) the uniform coating of PANI on the SSCNTs surfaces and in the coated SSCNTs surfaces in the presence of Ag nanoparticles gives a superior structure for easy electrolyte accessibility.
The galvanostatic charge/discharge is a steady method to estimate the electrochemical performance of electrode materials under controlled current conditions. Fig. 7b gives the typical GCD curves of the PANI, PANI/Ag and SSCNTs/PANI/Ag nanocomposites at 1 A g−1; and Fig. 7c presents the GCD curves of SSCNTs/PANI/Ag at different current density. The specific capacitance from the discharge plot can be calculated by using the following equation:
3.7 Electrical conductivity measurements
The electrical conductivity was calculating with the following equation:where ρ is the resistivity (Ω cm), V is the measured voltage, I is the source current, and t is the thickness of the samples. The electrical properties of the pure PANI, PANI/Ag, and SSCNTs/PANI/Ag nanocomposite were studied by four-probe measurements at room temperature. The pure PANI shows electrical conductivity of 1.3 S cm−1, whereas PANI/Ag shows electrical conductivity of 8.9 S cm−1. This increase in conductivity of the PANI/Ag composite is due to the incorporation of the Ag nanoparticles in the composite. Compared to highly tangled and close-ended MWCNTs, SSCNTs have rich structural features, such as nanoscaled length, open ends, abundant carbon atoms on the edge and so on. The introduction of high surface area and large aspect ratio SSCNTs and good electrical conductor Ag nanoparticles enhanced the electrical conductivity of the SSCNTs/PANI/Ag nanocomposite (18.5 S cm−1). Moreover, there is a good interaction between Ag nanoparticles and PANI coated SSCNTs which results in greater conductivity.
3.8 Electrochemical impedance spectroscopy
EIS spectroscopy was performed to evaluate the electrode performance of the prepared materials in a particular electrolyte and the kinetics involved. It gives information about the charge transport behavior of the electrode material at the electrode/electrolyte interface. The EIS of the three nanocomposites were performed after the CV experiments, without further modifying the electrodes. For the nanocomposites, the EIS plot has been represented in terms of a Nyquist plot, after fitting with an equivalent electrical circuit and is represented in Fig. 8a with the circuit shown in Fig. 8b. The common feature of the impedance spectra for all three nanocomposites is a rotated and flattened semicircle in the high frequency region, followed by a straight line in the low frequency region. The semicircle in the Nyquist plot is characteristic of a single time constant circuit. The diameter of the semicircle gradually decreases from PANI to PANI/Ag to SSCNTs/PANI/Ag, indicating a gradual increase of the available surface area with additional active sites for faradaic reactions, and fewer obstructions in the electron transfer process. The high frequency semicircle impedance arc is attributable to the double layer capacitance at the electrode electrolyte interface; and the linear part in the low frequency region corresponds to the diffusion-controlled doping and undoping of ions, a consequence of the Warburg behavior.35 On moving from PANI to PANI/Ag to SSCNTs/PANI/Ag, a gradual decrease in the slope of the linear part in the low frequency region can be observed, indicating a superior capacitive order. Ideal capacitors are not possible in the real-world system. These imperfect capacitors are signified by constant phase element (CPE). CPE replaces the ideal capacitor and defines inhomogeneities of the electrode surface in electrochemical capacitors. The CPE arises due to rough electrode surface, different dimension of coating, inhomogeneous distribution of reaction sites with different activation energies, non-uniform current distribution due to edge effect etc. CPE follow the equation:36 Z = 1/(jωC)n, where j is (−1)1/2, ω is the angular frequency, C is the ideal capacitance and n is an empirical constant (0 ≤ n ≤ 1). When n = 1, CPE acts as an ideal capacitor. Moreover, n is an important parameter to decide the superiority of an electrode material. Generally for a supercapacitor, 0.5 < n < 1, and the closer the value of n is to one, the more superior is the electrode material. For the PANI to PANI/Ag to SSCNTs/PANI/Ag, the value of n was determined to be 0.75, 0.79 and 0.85, respectively, also assuring the excellent supercapacitive behaviour of the SSCNTs/PANI/Ag compared with the other two composites.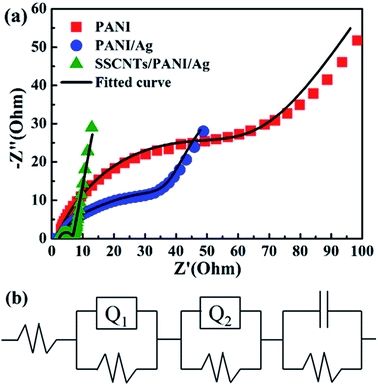 | ||
| Fig. 8 Electrochemical impedance spectroscopy of PANI, PANI/Ag and SSCNTs/PANI/Ag with the fitted curve (a) and the equivalent electrical circuit (b). | ||
4. Conclusion
In summary, the polymeric supercapacitor material SSCNTs/PANI/Ag has successfully been prepared by a simple and inexpensive technique. The introduction of SSCNTs not only provides additional transport paths and shortens the transmission distance for the electrolyte ions/electrons, but also adequately utilizes the closed pore volumes of MWCNTs. The SSCNTs/PANI/Ag nanocomposite achieved the highest specific capacitance of 615 F g−1 at 1 A g−1. Moreover, the presence of Ag nanoparticles and SSCNTs enhances the electrochemical properties of the SSCNTs/PANI/Ag nanocomposite, and the electrical conductivity of 18.5 S cm−1 was observed due to the occurrence of highly conductive Ag nanoparticles and SSCNTs with the open-ended pipes. The typical superior properties revealed that the SSCNTs/PANI/Ag can be used as a promising electrode material for supercapacitor.Acknowledgements
This study was supported by the National Natural Science Foundation of China (No. 51302108 and 21571084).References
- M. Kim, Y. K. Kim, J. Kim, S. Cho, G. Lee and J. Jang, RSC Adv., 2016, 6, 27460–27465 RSC.
- C. Pan, Y. Lv, H. Gong, Q. Jiang, S. Miao and J. Liu, RSC Adv., 2016, 6, 17415–17422 RSC.
- M. Umashankar and S. Palaniappan, RSC Adv., 2015, 5, 70675–70681 RSC.
- F. Miao, C. Shao, X. Li, K. Wang and Y. Liu, J. Mater. Chem. A, 2016, 4, 4180–4187 CAS.
- Z.-L. Wang, X.-J. He, S.-H. Ye, Y.-X. Tong and G.-R. Li, ACS Appl. Mater. Interfaces, 2013, 6, 642–647 Search PubMed.
- X. Li, J. Rong and B. Wei, ACS Nano, 2010, 4, 6039–6049 CrossRef CAS PubMed.
- Z. Zhang, Y. Zhang, K. Yang, K. Yi, Z. Zhou, A. Huang, K. Mai and X. Lu, J. Mater. Chem. A, 2015, 3, 1884–1889 CAS.
- M. Khalid, M. A. Tumelero and A. A. Pasa, RSC Adv., 2015, 5, 62033–62039 RSC.
- D. S. Patil, J. Shaikh, S. Pawar, R. Devan, Y. Ma, A. Moholkar, J. Kim, R. Kalubarme, C. Park and P. Patil, Phys. Chem. Chem. Phys., 2012, 14, 11886–11895 RSC.
- M. Sawangphruk, M. Suksomboon, K. Kongsupornsak, J. Khuntilo, P. Srimuk, Y. Sanguansak, P. Klunbud, P. Suktha and P. Chiochan, J. Mater. Chem. A, 2013, 1, 9630–9636 CAS.
- R. K. Agrawalla, S. Paul, P. K. Sahoo, A. K. Chakraborty and A. K. Mitra, J. Appl. Polym. Sci., 2015, 132, 41692 Search PubMed.
- V. H. Nguyen and J.-J. Shim, Synth. Met., 2011, 161, 2078–2082 CrossRef CAS.
- A. Grinou, H. Bak, Y. S. Yun and H.-J. Jin, J. Dispersion Sci. Technol., 2012, 33, 750–755 CrossRef CAS.
- S. Dhibar and C. K. Das, Ind. Eng. Chem. Res., 2014, 53, 3495–3508 CrossRef CAS.
- K.-S. Kim and S.-J. Park, J. Solid State Chem., 2011, 184, 2724–2730 CrossRef CAS.
- F. Zeng, Y. Kuang, N. Zhang, Z. Huang, Y. Pan, Z. Hou, H. Zhou, C. Yan and O. G. Schmidt, J. Power Sources, 2014, 247, 396–401 CrossRef CAS.
- F. Lorestani, Z. Shahnavaz, P. M. Nia, Y. Alias and N. S. Manan, Appl. Surf. Sci., 2015, 347, 816–823 CrossRef CAS.
- G. M. Neelgund, E. Hrehorova, M. Joyce and V. Bliznyuk, Polym. Int., 2008, 57, 1083–1089 CrossRef CAS.
- P. Saini, V. Choudhary, B. Singh, R. Mathur and S. Dhawan, Mater. Chem. Phys., 2009, 113, 919–926 CrossRef CAS.
- T.-M. Wu and Y.-W. Lin, Polymer, 2006, 47, 3576–3582 CrossRef CAS.
- H. Chaudhari and D. Kelkar, Polym. Int., 1997, 42, 380–384 CrossRef CAS.
- V. Sunny, T. Narayanan, U. Sajeev, P. Joy, D. S. Kumar, Y. Yoshida and M. Anantharaman, Nanotechnology, 2006, 17, 4765 CrossRef CAS PubMed.
- H. Guo, H. Zhu, H. Lin and J. Zhang, Mater. Lett., 2008, 62, 3919–3921 CrossRef CAS.
- T.-M. Wu, Y.-W. Lin and C.-S. Liao, Carbon, 2005, 43, 734–740 CrossRef CAS.
- M. S. Dresselhaus, G. Dresselhaus, R. Saito and A. Jorio, Phys. Rep., 2005, 409, 47–99 CrossRef.
- C. M. Izumi, V. R. Constantino, A. M. C. Ferreira and M. L. Temperini, Synth. Met., 2006, 156, 654–663 CrossRef CAS.
- S. Quillard, G. Louarn, S. Lefrant and A. MacDiarmid, Phys. Rev. B: Condens. Matter Mater. Phys., 1994, 50, 12496 CrossRef.
- E. Gomes and M. Oliveira, Am. J. Polym. Sci., 2012, 2, 5–13 CrossRef CAS.
- J. Zhang, C. Liu and G. Shi, J. Appl. Polym. Sci., 2005, 96, 732–739 CrossRef CAS.
- K.-S. Kim, I.-J. Kim and S.-J. Park, Synth. Met., 2010, 160, 2355–2360 CrossRef CAS.
- S. Sahoo, G. Karthikeyan, G. C. Nayak and C. K. Das, Synth. Met., 2011, 161, 1713–1719 CrossRef CAS.
- M. Moniruzzaman and C. K. Das, Macromol. Symp., 2010, 298, 34–42 CrossRef CAS.
- J. Wang, Y. Xu, X. Sun, S. Mao and F. Xiao, J. Electrochem. Soc., 2007, 154, C445–C450 CrossRef CAS.
- S. Dhibar, S. Sahoo, C. K. Das and R. Singh, J. Mater. Sci.: Mater. Electron., 2013, 24, 576–585 CrossRef CAS.
- D. Ghosh, S. Giri, A. Mandal and C. K. Das, RSC Adv., 2013, 3, 11676–11685 RSC.
- D. Ghosh, S. Giri, A. Mandal and C. K. Das, Appl. Surf. Sci., 2013, 276, 120–128 CrossRef CAS.
| This journal is © The Royal Society of Chemistry 2016 |


