Preparation of macroscopic spherical porous carbons@carboxymethylcellulose sodium gel beads and application for removal of tetracycline†
Jinsong Heab,
Jiangdong Daiab,
Atian Xieab,
Sujun Tianab,
Zhongshuai Changab,
Yongsheng Yan*ab and
Pengwei Huo*ab
aSchool of Chemistry and Chemical Engineering, Jiangsu University, Zhenjiang 212013, China. E-mail: yys@mail.ujs.edu.cn; huopw@mail.ujs.edu.cn; Fax: +86-0511-88791800; Tel: +86-0511-88790683
bInstitute of Green Chemistry and Chemical Technology, Jiangsu University, Zhenjiang 212013, China
First published on 17th August 2016
Abstract
The development of practicable and retrievable adsorbents with high adsorption capacity is a technical imperative for water treatment. Herein, we reported a new convenient macroscopic granular adsorbent for the removal of tetracycline (TC) from water by immobilizing porous carbons (PCs) which were obtained via one-step in situ pyrolysis from ethylenediaminetetraacetic acid dipotassium salt dihydrate (EDTA-2K·2H2O) into carboxymethylcellulose sodium (CMCS) gel beads utilising molecular cross-linking. A remarkable similarity can be observed between multivariant gel beads and EDTA-2K·2H2O derived porous carbons (EPCs) according to the characterization results. The adsorption performance was evaluated using batch adsorption studies of TC in aqueous solution: the kinetic results could be fit well by a pseudo-second-order model and intraparticle diffusion was treated as the rate-controlling step; equilibrium adsorption data fitted well to the Langmuir adsorption isotherm yielding a maximum adsorption capacity of 136.9 mg g−1 at 298 K. Importantly, these results indicate that the as-prepared gel beads could be used as facile adsorbents in pharmaceutical wastewater treatment.
1 Introduction
In recent decades, porous carbons (PCs) have attracted increasing attention in many functional application fields, such as separation media, catalyst supports, electronic materials and water treatment, due to their intriguing properties, including low cost, chemical stability and eco-friendly properties.1 As promising candidate materials used as adsorbent for the purpose of environmental protection and remediation, PCs are endowed with high surface area, large pore volume and controllable pore dimensions. Besides the morphology structure,which mainly makes a contribution to physisorption, its enhanced chemisorption in pollutant removal is determined by surface chemistry groups.2PCs can be prepared using template synthesis and activation processes. Template synthesis has been employed frequently for the synthesis of uniform and/or interconnected porous carbon materials, and despite the the shortcomings of this approach, such as preparation complexity and high cost, it has been successfully applied in energy3 and other particular fields.4 In nature, there is no rigorous demand for homogeneous porosity when PCs is used as an absorbent; activation process are generally adopted for the production of adsorbents. However, the risk and complexity incurred in physical/chemical activation hinder the practical production of PCs. In order to overcome this predicament, direct carbonization, which does not involve an activation process, was employed. The selection of precursor is crucial to obtain PCs with prominent morphology and chemical structure. Several kinds of precursor, such as phenolic resin,5 tetraphenylborate,6 polyvinylidene fluoride,7 coordination polymers,8 zeolitic imidazolate frameworks,9 and metal–organic frameworks1 have been tested so far; nevertheless, there is still an increasing demand for the development of appropriate and attractive precursors.
EDTA-2K·2H2O is a nitrogen-containing organic potassium salt with the formula of C10H14K2N2O8·2H2O, which consists of carboxyl groups, potassium, alkyl chains and amidocyanogen. Taking this as the foundation, in situ doping of carboxyl groups and potassium ions into precursors can realize the construction of homogeneous and abundant pore structures due to the release of a mixed gas of H2, CO, CO2 and potassium vapor as a superb pore-forming agent. In addition, substantial production can be guaranteed by the plenitudinous alkyl chains. Moreover, functional groups derived from oxygen and nitrogen containing groups are required for high efficiency PCs in environmental applications. In summary, EDTA-2K·2H2O is able to act as a remarkable precursor for the preparation of PCs.
Even so, it is noted that the separation of these porous carbon after adsorption requires lengthy coagulation and/or high speed centrifugation; and these will cause secondary pollution due to the particle loss caused by the potential release of adsorbent into the environment, which limits their applications in large scale wastewater treatment processes.10 To overcome this problem, many researchers focused their attentions on gel beads, as they could be entrapped. On one hand, complex separation and recollection are no longer necessary when using gel beads as adsorbent. On the other hand, gels obtained from alginate11 and chitosan12 are widely used for wastewater treatment due to their large scale availability, acceptable cost, biodegradability and biocompatibility. Apart from these two raw materials, we surprisingly find that carboxymethylcellulose sodium (CMCS) can also be used as cross-linking agent; furthermore, in the presence of trivalent cations, such as Fe3+, it forms hydrogels via intermolecular crosslinking.
CMCS is a derivative of natural cellulose. Cellulose, the most important skeletal component in plants, is the most abundant natural polymer and has been considered an almost inexhaustible source of raw material for the increasing demand for biocompatible products.13 In this way, it has an extensively expanded application potential when compared with alginate and chitosan. Moreover, CMCS also has considerable fascinating properties, such as low cost, biodegradability, non-toxicity, and high stability. As a promising candidate, it can also be widely used as a biosorbents due to the presence of carboxylate groups along the polymeric chains.14
In this paper, we present a very simple method to prepare PCs with a high specific surface area, huge volume and abundant chemical groups using EDTA-2K·2H2O as precursor via a one-step in situ pyrolysis process. Furthermore, we use CMCS as cross-linking agent to aggregate PCs for the solution separation and successful recollection of adsorbent from the adsorbed matrix solution. The physical and chemical properties of as-prepared compound gel beads were characterized by scanning electron microscopy (SEM), surface area analysis, X-ray photoelectron spectroscopy (XPS), Fourier transform-infrared (FTIR) spectroscopy, X-ray diffraction (XRD) and Raman spectroscopy. Herein, tetracycline (TC) was chosen as adsorbate to investigate the removal efficiency of antibiotics from water, as it is the most used antibiotic as animal feed additive and dominant source of antibiotic resistant genes.15 The potential of sorption was evaluated by adsorption kinetics, equilibrium and thermodynamic studies. The developed valuable and facile route for preparation of macroscopic spherical EDTA-2K·2H2O derived porous carbon–carboxymethylcellulose sodium (EPCs@CMCS) gel beads may provide a positive route for promising environmental remediation.
2 Experimental
2.1 Materials
EDTA-2K·2H2O, CMCS and TC were obtained from Aladdin Industrial Inc. (Shanghai, China) and without further purification. Iron nitrate nonahydrate (Fe(NO3)3·9H2O, AR), hydrochloric acid (HCl, AR), and sodium hydroxide (NaOH, AR) were purchased from Shanghai Chemical Reagent Co., Ltd. (Shanghai, China) and used as received. The aqueous solutions for experiments were prepared using deionized water.2.2 Preparation of PCs from EDTA-2K·2H2O
The PCs were prepared as follows: EDTA-2K·2H2O loaded in a nickel crucible was pyrolyzed in a horizontal quartz tube furnace by electric heating (Tianjin Zhonghuan Lab Furnace Co., Ltd.). The furnace was heated to 750 °C with a heating rate of 3 °C min−1 and maintained for 1 h in N2 flow, followed by cooling down to ambient temperature. After washing with diluted hydrochloric acid (HCl, 0.2 M) and then distilled water, followed by drying at 80 °C for 24 h, the EDTA-2K·2H2O derived porous carbons were denoted as EPCs.2.3 Immobilization of EPCs in gel beads
0.5 g of EPCs was added into 10 mL of a 2.5 wt% CMCS aqueous solution; the resulting mixture was allowed to stir at room temperature for 2 h to ensure homogeneous and continuous mixing, then treated by ultrasound for 2 h. The black compound was added drop-wise into 200 mL of a 5 wt% Fe(NO3)3·9H2O solution via a peristaltic pump (Longer-Pump, YZ1515x) with controlled flow rate to ensure the formation of homogeneous beads, and the solution was gently stirred to prevent fresh beads adhering with others. After aging in Fe(NO3)3·9H2O solution for 8 h, the beads were rinsed in deionized water for 24 h and the water was renewed at intervals of 8 h; afterwards, they were washed with plenty of water to remove residual Fe(NO3)3·9H2O. The beads were extensively converted into xerogels by freeze drying for 24 h and simply denoted as EPCs@CMCS gel beads.2.4 Adsorption test
Adsorption experiments were executed in a set of independent 50 mL headspace polytetrafluoroethylene test tubes containing 25.0 mg of dry EPCs@CMCS gel beads (particle size ∼ 1.5 mm, Fig. 1) and 50 mL of the test TC solution was required. In adsorption kinetic tests, the initial consistence was set at 50, 75, 100 mg L−1 of background solution at pH 6.0 for the tested antibiotic (preadjusted with NaOH or HCl by considering the acid/base buffering ability of the sorbent); free TC concentrations were measured via a UV-vis spectrophotometer (Genesys 10 UV-vis, Thermo Electron Corporation, USA) at a wavelength of 358.0 nm.16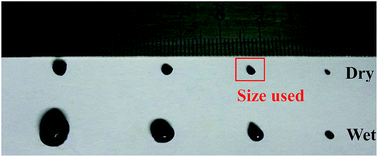 | ||
| Fig. 1 Digital photo of EPCs@CMCS gel beads appearing with different sizes in the wet and dry state. | ||
The adsorption equilibrium experiments were carried out with various initial concentrations varying from 25 to 200 mg L−1 of the solution at pH 6.0, and were kept in a constant temperature water bath for 24 h to reach an apparent sorption equilibrium based on the results of adsorption kinetics.
In order to prove the prepared materials have potential in real sample applications, the effects of co-existing anion species and humic acid (HA) on the adsorption of TC onto gel beads was investigated. The experiments were conducted in TC solution (100 mg L−1) containing Cl−, NO3−, SO24−, PO34− (0.01 M), and HA (10 mg L−1) at 298 K for 24 h. In the pH effect experiments, the initial pH values of the TC solutions (100 mg L−1) were adjusted in the range of 3.0–8.0 using dilute NaOH or HCl solutions.
All adsorption experiments were repeated at least three times to ensure accuracy of the obtained data. The amount of adsorption at time t (Qt, mg g−1) was calculated by eqn (1).
 | (1) |
2.5 Characterization
The surface and cross-sectional morphologies of the EPCs@CMCS gel beads were investigated by SEM (Hitachi S4800 II, Japan). The pore structure parameters were determined by N2 adsorption–desorption measurements at 77 K on a surface area analyzer (Micrometrics ASAP2460, USA); the specific surface area was evaluated by the Brunauer–Emmett–Teller (BET) model, while the pore size distribution was estimated by Barrett–Joyner–Halenda (BJH) theory. The surface chemical species were examined by XPS (Thermo ESCALAB 250Xi, USA). FT-IR spectras were recorded on a Nicolet Nexus 470 spectrometer. Raman experiments were performed by a DXR Laser Raman Spectrometer using the 532 nm laser, and measurements were made in backscattering geometry. The identification of the crystallographic structure was performed using a Rigaku D/max-γB XRD with Ni-filtered Cu Kα radiation. The pHZPC (zero point charge) value was measured by using a Malvern Nanosize ZS zetasizer.3 Results and discussion
3.1 Preparation and characterization of EPCs@CMCS gel beads
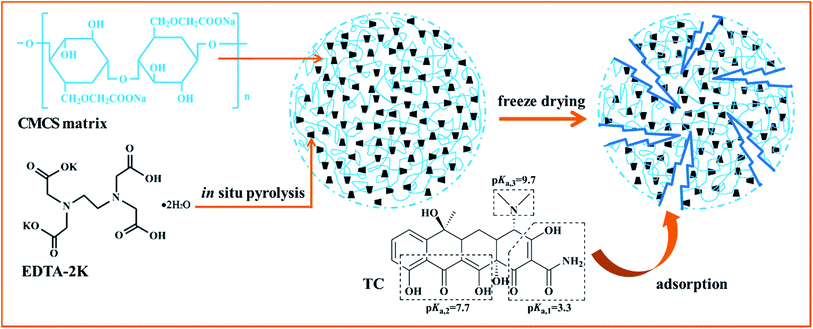
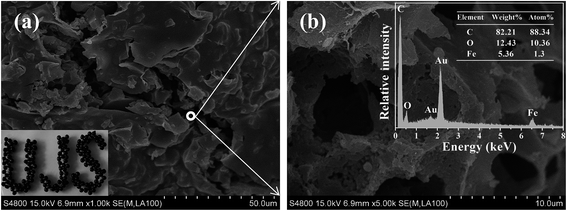
The synthesis method is illustrated in Scheme 1. The sol–gel method was applied for preparation of EPCs@CMCS gel beads. Among the many methods for removal of water in hydrogel, freeze drying has been proven to be an effective way for the preservation of porosity,17 and was adopted in this study as well. Fig. 1 shows the appearance of prepared wet and dried gel beads with different sizes derived from different dimensions of pump tubes. After freeze drying, the spherical shape was retained and sizes obviously reduced.SEM images of EPCs@CMCS gel beads are demonstrated in Fig. 2. The surface morphology is uneven and ridgy (Fig. 2a), which can be elucidated by the asynchronous shrinking of EPCs in the gel bead mixture, which occurred during freeze drying. The appearance of conspicuous cracks on the surface of the EPCs@CMCS gel beads was perhaps due to excess implantation of EPCs in CMCS gel beads leading to an overloading of the crosslinker burden. The crosslinked inner nature is shown in Fig. 2b; the crosslinker skeleton structure is composed of many caves and surfaces covered with EPCs. When compared with SEM images of CMCS gel beads in Fig. S1 (see the ESI†), the visible changes in the internal skeleton structure and the surface morphology of the gel beads could be discriminated easily. The interconnected network structure and internal surface prolongation of EPCs@CMCS gel beads facilitated the attachment of adsorbate to the adsorption active sites.
It is worth noting that these well-porous carbon materials can be easily produced in only one-step in situ pyrolysis by using EDTA-2K·2H2O as precursor. The excellent porosity of the EPCs is elucidated in Table 1; they exhibit a high BET specific surface area (SBET) (i.e. 2916 m2 g−1) and a large pore volume (VP) (i.e. 1.63 cm3 g−1), moreover, micropores are dominant in the EPCs. In the process of self-activation, carboxyl groups and potassium carboxylate converted into K2CO3 and CO2 below 400 °C firstly, then carbon was consumed by the reaction of carbon and H2O with the emission of H2 and CO (eqn (2)); sequentially, fractional CO reacted with H2O with the emission of CO2 and H2 (eqn (3)).
| C + H2O → CO + H2 | (2) |
| CO + H2O → CO2 + H2 | (3) |
| Samples | SBET/m2 g−1 | VP/cm3 g−1 | Smicro/m2 g−1 | Vmicro/cm3 g−1 | daver/nm |
|---|---|---|---|---|---|
| a SBET: BET specific surface area; VP: total pore volume; Smicro: micropore surface area; Vmicro: micropore volume; daver: average pore diameter. | |||||
| EPCs@CMCS gel beads | 1501 | 0.77 | 739.2 | 0.31 | 2.05 |
| EPCs | 2916 | 1.63 | 2156 | 1.01 | 1.68 |
When temperatures rose to 700 °C, significant decomposition occurred on the as-formed K2CO3 into CO2 and K2O. Furthermore, the K compounds also can be reduced by carbon to produce metallic K vapor at temperatures over 700 °C (eqn (5) and (6)).18
| K2CO3 → K2O + CO2 | (4) |
| K2CO3 + 2C → 2K + 3CO | (5) |
| C + K2O → 2K + CO | (6) |
The homogeneous and abundant pore structure could be realized due to the release of a mixed gas of H2, CO, CO2 and metallic K as an active pore-forming agent.19
Many researchers have proved that micropores are major positions for organic contaminant adsorption onto carbon composite materials, therefore, an abundant porosity of adsorption materials could contribute to highly efficient organic matter adsorption.16,20 The N2 adsorption–desorption isotherms of EPCs@CMCS gel beads and EPCs exhibit type I isotherms (according to the IUPAC classification) with a steep increase region at low relative pressure (P/Po < 0.1) and a plateau region with a parallel relative pressure axis in the range of P/Po > 0.1 (Fig. 3a), which correspond to micropore filling and multilayer adsorption on the surface, respectively.21 The pore distribution of EPCs@CMCS gel beads in Fig. 3b clearly indicates that micropores are more directly dominant; the mesopore distribution of the products is in the range of 0.5–3.0 nm. Table 1 gives the comparison results of porous textural characterization. From the results, although SBET and VP decreased after saturation of CMCS in EPCs, marvellously, the pore size distribution and microporous proportion remained.
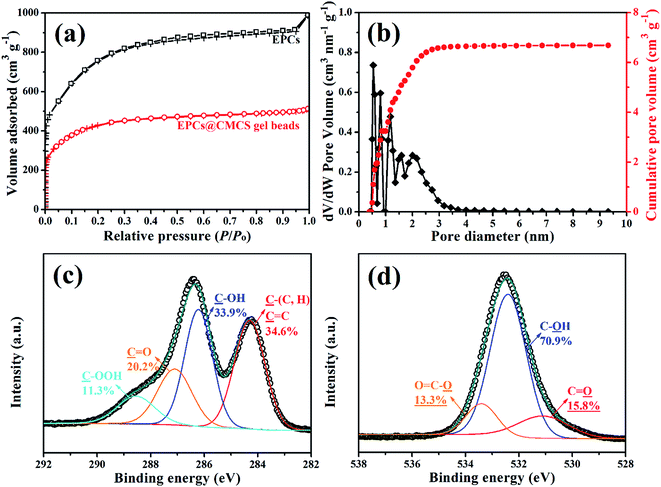 | ||
| Fig. 3 N2 adsorption–desorption isotherms of EPCs@CMCS gel beads and EPCs (a), pore size distribution (b), high-resolution XPS spectra of C 1s (c) and O 1s (d) peaks of EPCs@CMCS gel beads. | ||
The nature of most external surface functionalities of EPCs@CMCS gel beads was also studied by XPS, the spectra of C 1s and O 1s photoelectrons are shown in Fig. 3c and d. The high resolution C 1s photoelectron spectrum for the raw hydrochar sample included four common signals, which can be attributed to the aliphatic/aromatic carbon groups (C1, C–H/C, 284.5 eV), hydroxyl groups (C2, C–OH, 286.0 eV), carbonyl groups (C3, C![[double bond, length as m-dash]](https://www.rsc.org/images/entities/char_e001.gif) O, 287.1 eV), and carboxylic/ester/lactone groups (C4, C–OOH, 288.7 eV).22,23 The O 1s spectra can be deconvoluted into three groups: ketone, lactone, carbonyl, and quinone groups (O1, C
O, 287.1 eV), and carboxylic/ester/lactone groups (C4, C–OOH, 288.7 eV).22,23 The O 1s spectra can be deconvoluted into three groups: ketone, lactone, carbonyl, and quinone groups (O1, C![[double bond, length as m-dash]](https://www.rsc.org/images/entities/char_e001.gif) O, 531.1 eV); carbonyl oxygen atoms in esters, amides, carboxylic anhydrides and oxygen atoms in hydroxyls or ethers (O2, C–OH and/or C–O–C, 532.4 eV); and carboxyl hydroxyl or perhaps some adsorbed water (O3, O–C
O, 531.1 eV); carbonyl oxygen atoms in esters, amides, carboxylic anhydrides and oxygen atoms in hydroxyls or ethers (O2, C–OH and/or C–O–C, 532.4 eV); and carboxyl hydroxyl or perhaps some adsorbed water (O3, O–C![[double bond, length as m-dash]](https://www.rsc.org/images/entities/char_e001.gif) O/H2O, 533.4 eV).24 The C 1s and O 1s XPS spectra of EPCs are shown in Fig. S2.† It was observed that the surface functionality species were identical with EPCs@CMCS gel beads, however, the content of oxygen-containing functional groups was lower.
O/H2O, 533.4 eV).24 The C 1s and O 1s XPS spectra of EPCs are shown in Fig. S2.† It was observed that the surface functionality species were identical with EPCs@CMCS gel beads, however, the content of oxygen-containing functional groups was lower.
FT-IR spectra are presented in Fig. 4a; for CMCS gel beads, the stretching vibration peak of O–H appeared at 3441 cm−1, the peak at 2908 cm−1 is assigned to the aromatic and aliphatic C–H groups. The band at 1733 cm−1 may be attributed to C![[double bond, length as m-dash]](https://www.rsc.org/images/entities/char_e001.gif) O stretching, peaks at 1601 and 1418 cm−1 can be contributed to carboxyl group O
O stretching, peaks at 1601 and 1418 cm−1 can be contributed to carboxyl group O![[double bond, length as m-dash]](https://www.rsc.org/images/entities/char_e001.gif) C–O asymmetric stretching vibrations and symmetrical stretching vibrations, respectively. The peaks at 1111, 1067 and 1032 cm−1 related to C–O stretching in ether, carboxyl acids and alcohols.25 Pure carbon material EPCs have finite characteristic absorption bands at 1032–1111 cm−1 (C–O stretching) and 878 cm−1 (C–O–H vibration).26 After impregnation of EPCs in CMCS beads, the peak at 1601 cm−1 disappeared and a new peak appeared at 1560 cm−1 which was assigned to the formation of cross-linking. In addition, the peak of O–H attenuated due to the reduction of the number of hydroxyls per unit. The absorption bands of EPCs@CMCS gel beads maintain characteristic peaks of CMCS gel beads and are more similar to EPCs.
C–O asymmetric stretching vibrations and symmetrical stretching vibrations, respectively. The peaks at 1111, 1067 and 1032 cm−1 related to C–O stretching in ether, carboxyl acids and alcohols.25 Pure carbon material EPCs have finite characteristic absorption bands at 1032–1111 cm−1 (C–O stretching) and 878 cm−1 (C–O–H vibration).26 After impregnation of EPCs in CMCS beads, the peak at 1601 cm−1 disappeared and a new peak appeared at 1560 cm−1 which was assigned to the formation of cross-linking. In addition, the peak of O–H attenuated due to the reduction of the number of hydroxyls per unit. The absorption bands of EPCs@CMCS gel beads maintain characteristic peaks of CMCS gel beads and are more similar to EPCs.
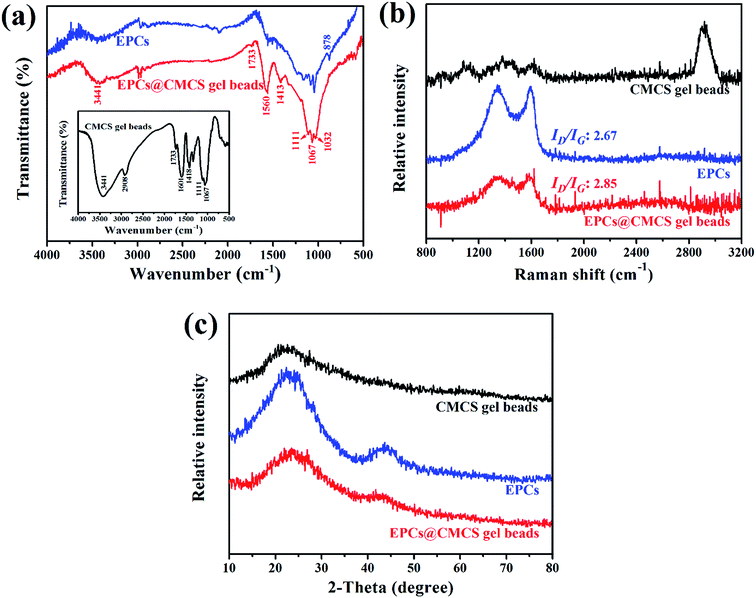 | ||
| Fig. 4 FT-IR spectra (a), Raman spectra (b) and XRD patterns (c) of EPCs, CMCS gel beads and EPCs@CMCS gel beads. | ||
In the Raman spectra (Fig. 4b), two prominent peaks at 1356 and 1582 cm−1 correspond to the D band and the G band, the D band derives from the stretching vibration of the defect sp3 carbon atoms, whereas the G band originates from the stretching vibration of sp2 carbon networks. The integrated intensity ratio ID/IG was widely used to characterise the degree of defects in graphitic composites;27 there was minimal increase of ID/IG ratio after immobilization of CMCS into EPCs, indicating the introduction of defects.
The XRD patterns (Fig. 4c) revealed the amorphous state. The 100 diffraction peaks located at about 43.2° suggested an ordered hexagonal carbon structure; peaks around 24.4° correspond to 002 diffraction peaks indicating the degree of stacking order of the layered carbon structure.23 As shown in Fig. 4c, after immobilization of EPCs into CMCS gel beads, the 2θ value of 002 planes increased from 23.6° to 24.8°, on the basis of Bragg’s law, nλ = 2d![[thin space (1/6-em)]](https://www.rsc.org/images/entities/char_2009.gif) sin
sin![[thin space (1/6-em)]](https://www.rsc.org/images/entities/char_2009.gif) θ, where λ is the wavelength (1.54 Å for Cu Kα), indicating the reduction of interlayer spacing (d002) from 0.38 nm to 0.36 nm, which may be attributed to the interaction of the interstitial atoms.28 The weakness of the characteristic 100 diffraction peak in EPCs@CMCS gel beads reflected that the graphitization degree reduced after immobilization.
θ, where λ is the wavelength (1.54 Å for Cu Kα), indicating the reduction of interlayer spacing (d002) from 0.38 nm to 0.36 nm, which may be attributed to the interaction of the interstitial atoms.28 The weakness of the characteristic 100 diffraction peak in EPCs@CMCS gel beads reflected that the graphitization degree reduced after immobilization.
3.2 Effect of solution pH
Solution pH had a significant effect on the adsorption by affecting the speciation of TC and the surface electric properties of EPCs@CMCS gel beads. Fig. 5a shows the adsorption capacities of TC at different solution pH values. Depending on the pH, TC existed in three forms as follows: cationic TCH3+ (pH < 3.3); neutral non-ionized TCH2± (3.3 < pH < 7.7); and anionic TCH− and TC2− (pH > 7.7) (Scheme 1). In our study, the pHZPC for the EPCs@CMCS gel beads was 7.39, the surface of the adsorbent will be positively charged below pHZPC, and beyond this it will be negatively charged. Thus, when solution pH values were 3.0 and 8.0, the adsorption capacities were clearly reduced due to the strong electrostatic repulsion between negatively charged sites on the adsorbent and TC species. In addition, the increasing pH promoted the deprotonation of the charged amino groups, and thus weakened their electron acceptor ability, suppressing the π–π electron donor–acceptor (π–π EDA) interactions with the graphite surface of EPCs@CMCS gel beads.16 Moreover, a pH value of 6.0 was chosen as original solution pH for the following adsorption test.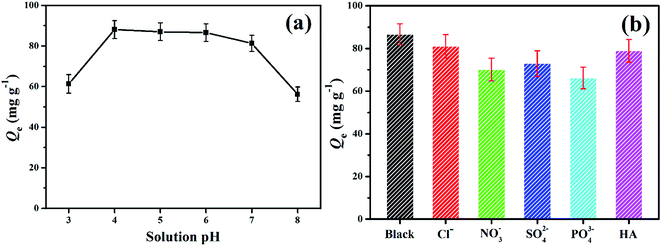 | ||
| Fig. 5 Effect of solution pH (a) and co-existing anions and HA (b) on the removal of TC by EPCs@CMCS gel beads. | ||
3.3 Effect of ion species and HA
In particular, the real samples always appeared as a complex matrix; in order to prove that EPCs@CMCS gel beads have potential in wastewater treatment, the effects of co-existing ions and HA on adsorption of TC onto EPCs@CMCS gel beads were investigated and the results are shown in Fig. 5b. It can be seen that the maximum competitive effect came from PO34−, which decreased by 22.7% for TC adsorption (i.e., from 86.47 mg g−1 to 67.16 mg g−1). On the other hand, the presence of HA (10 mg L−1) only has a limited effect on the adsorption performance; the adsorptive capacity value 78.11 mg g−1, dropped by 9.6%. Given that the simulated concentration of these ions and HA was much higher than that present in real samples,29 it is feasible that the as-prepared materials have the ability to deal with antibiotics in wastewater.3.4 Adsorption kinetics
To investigate further the mechanism of the adsorption process, adsorption kinetics analyses were conducted using three classical models.30–32
Pseudo-first-order: ln(Q1 − Qt) = ln![[thin space (1/6-em)]](https://www.rsc.org/images/entities/char_2009.gif) Q1 − k1t Q1 − k1t
| (7) |
 | (8) |
| Intraparticle diffusion: Qt = kidt1/2 + C | (9) |
The parameters of the determination coefficient (R2) and normalized standard deviation (ΔQ, %) eqn (10) were evaluated to define which model best describes the experimental data.
 | (10) |
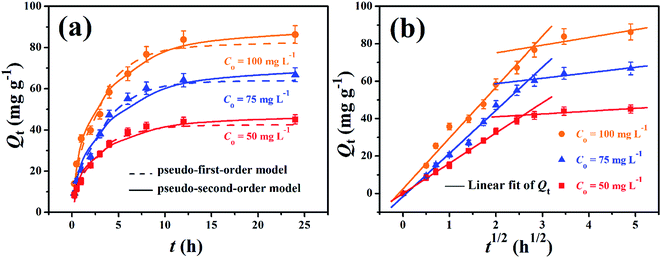
The adsorption process was originally rapid and then slow, after which it remained stagnant, due to the fact that the available vacant surface sites had decreased with the prolongation of adsorption. The process of EPCs@CMCS gel beads TC removal lasted for a long time as equilibrium was obtained around 8 h when the initial concentration was 100 mg L−1; the higher the initial TC concentration, the longer the adsorption time required (Fig. 6a). Compared with powder adsorbent applications for TC removal, such as activated carbon22 or activated sludge,33 EPCs@CMCS gel beads took a longer time to reach equilibrium. This occurs as a result of the lower effective contact surface and slow-rate transmission channel of massive beads.
The fitting parameters of pseudo-first-order and pseudo-second-order kinetics are listed in Table 2 and the linear plots are presented in Fig. S3.† The pseudo-second-order model showed a higher regression coefficient and a lower normalized standard deviation compared with the pseudo-first-order model. This result indicates that the better representation of adsorption kinetics is the pseudo-second-order model, and its Qe,cal values agree well with Qe,exp values. The pseudo-second-order kinetic model is based on the experimental information of solid-phase sorption, which means that the combined action of physical and chemical absorption is occurring.
| Co/mg L−1 | Pseudo-first-order | Pseudo-second-order | ||||||
|---|---|---|---|---|---|---|---|---|
| k1/min−1 | Q1,cal/mg g−1 | ΔQe (%) | R2 | k2/10−3 g mg−1 min−1 | Q2,cal/mg g−1 | ΔQe (%) | R2 | |
| 50 | 0.0952 | 29.41 | 21.62 | 0.7816 | 11.4 | 49.02 | 12.73 | 0.9969 |
| 75 | 0.0921 | 48.63 | 21.56 | 0.8124 | 5.82 | 74.07 | 13.46 | 0.9943 |
| 100 | 0.0798 | 64.02 | 27.23 | 0.8248 | 5.41 | 93.46 | 16.51 | 0.9937 |
Generally, the adsorption process onto an adsorbent can be divided into three stages. The first stage is external diffusion, in which the adsorbates move from the bulk solution to the external surface of the adsorbent. The second stage is intraparticle diffusion, where the adsorbates diffuse further to the adsorption sites within the adsorbent. The last stage is adsorbing, in this stage the adsorbates are adsorbed at the active sites on the adsorbent, which is a fast step and is usually negligible.34 The transportation of adsorbate from solution phase to the surface of the adsorbent particles may be controlled either by one or more steps; an intraparticle diffusion model can be used to elucidate the diffusion mechanism well. According to Fig. 6b, the plots of Qt to t1/2 exhibited a piecewise-linear pattern with two slopes. The first inclined stage is attributed to a combination of rapid adsorption of TC on the impacted surface via cracks distributed on the external surface of EPCs@CMCS gel beads and intraparticle diffusion. The last portion is the final adsorbing equilibrium stage where intraparticle diffusion starts to be retarded due to the decrease of the free TC concentration. It is essential for Qt versus t1/2 plots to go through the origin if the intraparticle diffusion is the sole rate-limiting step; as shown in Fig. 6b and Table S1,† the intraparticle diffusion can be regarded approximately as a rate-controlling step with different initial TC concentrations, which is a relatively good explanation of the time-lapse adsorption rate.
3.5 Adsorption isotherms
Adsorption isotherms are commonly used to describe how the adsorbate is distributed between the liquid and the solid phases when the adsorption process reaches an equilibrium state. Three adsorption models35–37 are adopted to investigate the adsorption behavior.
 | (11) |
 | (12) |
 | (13) |
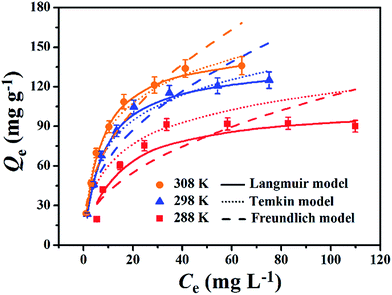
Adsorption isotherm non-linear fitting results are described in Fig. 7 and fitting parameters are listed in Table 3. The correlation coefficient of fitting the linear form to the Langmuir model was much higher than that of two other models under all temperature conditions; this meant that the Langmuir model was more suitable to imitate the adsorption process, which indicated monolayer coverage of TC on the available surface of gel beads (the maximum capacity based on Langmuir was 136.9 mg g−1 at 298 K). Meanwhile, the other two models fit reasonably, showing correlations of isotherms in the order: Langmuir > Temkin > Freundlich. The fitting result of the Temkin model indicated that there was electrostatic interaction during the adsorption process. The essential features of the Langmuir isotherms RL indicate the possibility of the adsorption process being irreversible (RL = 0), favorable (0 < RL < 1), linear (RL = 1), or unfavorable (RL > 1).38
 | (14) |
| T/K | Langmuir | Freundlich | Temkin | |||||||
|---|---|---|---|---|---|---|---|---|---|---|
| Qm/mg g−1 | KL/L mg−1 | RL | R2 | KF/(mg g−1) (L mg−1)1/n | n | R2 | bT | KT/L g−1 | R2 | |
| 288 | 104.2 | 0.08 | 0.33 | 0.9763 | 14.69 | 2.25 | 0.7681 | 105.46 | 1.35 | 0.8667 |
| 298 | 136.9 | 0.13 | 0.23 | 0.9995 | 24.95 | 2.39 | 0.9202 | 89.47 | 1.57 | 0.9806 |
| 308 | 149.2 | 0.16 | 0.20 | 0.9991 | 28.89 | 2.36 | 0.9331 | 83.55 | 1.96 | 0.9876 |
As the value of RL fell between 0 and 1, thisindicated that TC adsorption on EPCs@CMCS gel beads was favorable. In addition, the parameter n derived from the Freundlich model also indicated the favorability of sorption.2,39
As compared with other previously reported adsorbents listed in Table 4, the cost-effective EPCs@CMCS gel beads were not only were provided with an appreciable adsorption performance for TC from an aquatic environment, but also were able to be recollected conveniently. In addition, the secondary pollution of particle loss caused by the potential release of adsorbent into the environment could be effectively avoided. It is suggested that the prepared gel beads have great potential as an easily retrievable adsorbent for antibiotics removal.
| Adsorbent | Qm/mg g−1 | Adsorption conditions | Ref. |
|---|---|---|---|
| Graphene oxide | 370 | pH = 3.6, T = 298 K | 26 |
| Carbon nanotubes | 269.5 | T = 293 K | 39 |
| Amino-Fe functionalized mesoporous silica | 96.9 | pH = 5.0 ± 0.1, T = 298 K, 0.01 M NaCl | 44 |
| Alkali bio-char | 58.8 | Ambient pH, T = 303 K | 45 |
| Illite | 32 | pH = 5–6 | 46 |
| Magnetic porous carbon | 29 | T = 303 K | 40 |
| CMCS gel beads | 9.47 | pH = 6.0, T = 298 K | This work |
| EPCs@CMCS gel beads | 136.9 | pH = 6.0, T = 298 K | This work |
3.6 Thermodynamic studies
The value of Gibb’s free energy (ΔG°) can be calculated by eqn (15).
ΔG° = −RT![[thin space (1/6-em)]](https://www.rsc.org/images/entities/char_2009.gif) ln ln![[thin space (1/6-em)]](https://www.rsc.org/images/entities/char_2009.gif) Ko Ko
| (15) |
Ko represents the ability of the adsorbent to retain the adsorbate and the extent of movement of the adsorbate within the solution; values of Ko are obtained by plotting a straight line of ln(Cs/Ce) as a function of Cs. Cs is the amount of TC adsorbed per unit gram of the adsorbent (mmol g−1) and Ce is the equilibrium concentration of the TC (mmol mL−1).
The enthalpy change (ΔH°) and entropy change (ΔS°) of adsorption were estimated from eqn (16).
 | (16) |
The adsorption capacities obviously increased with the rise of temperature, indicating that the adsorption is an endothermic reaction. Its spontaneous and thermodynamically favorable nature was also explained by the negative values of ΔG° and positive value of ΔH° (Table 5). The positive ΔS° indicated the increase of randomness at the solid/liquid interface during the adsorption process.40
| T/K | ln![[thin space (1/6-em)]](https://www.rsc.org/images/entities/char_2009.gif) Ko Ko |
ΔG°/kJ mol−1 | ΔH°/kJ mol−1 | ΔS°/J mol−1 K−1 |
|---|---|---|---|---|
| 288 | 2.194 | −5.619 | 6.251 | 40.09 |
| 298 | 2.334 | −5.976 | ||
| 308 | 2.363 | −6.050 |
The negative values of ΔG° and positive value of ΔH° confirm that the adsorption processes was endothermic, matching well with the adsorption being more favorable at higher temperature. Generally, ΔG° for physisorption is between −20 and 0 kJ mol−1 and for chemisorption is between −80 and −400 kJ mol−1. Furthermore, Kara et al.41 suggested that value of ΔH° for physical adsorption was smaller than 40 kJ mol−1. Herein, both the values of ΔG° and ΔH° indicated that the adsorption processes was mainly a physical adsorption. Moreover, the positive values of ΔH° evidenced the increment of randomness at the solid/solution interface during the adsorption process.42
3.7 Proposed adsorption mechanism
Fig. S4† shows the FT-IR spectra of EPCs@CMCS gel beads after adsorption of TC; it can be seen that, except for the peak at 1327 cm−1, they were attributed to the stretching vibration of the C–N bond connected to the benzene ring and N–CH3 bond;25 no further significant change in peak position was observed, indicating that TC was successfully adsorbed onto EPCs@CMCS gel beads, but there was no strong chemical adsorption. In light of this work and the previous literature, TC adsorption onto EPCs@CMCS gel beads mainly complied with van der Waals forces, micropore filling, π–π EDA interactions, electrostatic interactions and hydrophobic interactions.2,16 As can be seen from the Raman spectra (Fig. 4b), although an minimal increase of the ID/IG ratio has arisen after immobilization of EPCs into CMCS, the graphitic sp2 carbons are still present; the presence of the graphitic surface guarantees a very high van der Waals index and the TC molecules have a large planar ring structure, therefore, strong van der Waals forces are likely to occur between the TC molecules and the graphene surface of the adsorbents,43 which is consistent with thermodynamic studies. The intensities of the van der Waals forces of single TC molecules are determined by the adsorbent surface and proportional to its contact surface area with adsorbent.22,43 More frequently, micropore filling is a proposed mechanism for organic contaminant adsorption onto the carbon composite materials; the adsorption capacity correlates with the surface properties of the adsorbent and the adsorption capability is directly proportional to the micropore surface area and micropore volume.20 EPCs@CMCS gel beads are endowed with a reasonable pore structure, a large portion of the micropores are accessible to TC molecules and assist adsorption by promotion of the micropore filling effect. Instead, CMCS gel beads have only a negligible adsorption capacity (i.e. 9.47 mg g−1, Table 4) due to their barren inner structure (Fig. S1†); the weak adsorption capacity was solely derived from the H-bonding interaction between the limited surface functional groups of CMCS gel beads and TC molecules.Furthermore, chemisorption is also involved in the process; although the attenuation of peak intensity after immobilization occurred, the remaining 100 diffraction peaks in the XRD patterns (Fig. 4c) indicated the graphitization of EPCs@CMCS gel beads. TC in possession of conjugated enone can act as a commendable π-electron acceptor, due to the strong electron-withdrawing ability of the ketone group, and therefore interact strongly with the short stacks of graphite-like sheets (π-electron-donors) arranged in a disordered form of the EPCs@CMCS gel beads via π–π EDA interactions.16 In addition, electrostatic interactions and hydrophobic interaction may be also involved in the process on the basis of the solution pH results and Temkin model fitting results.
4 Conclusion
In this study, macroscopic granular EPCs and CMCS gel beads were prepared and their antibiotics adsorption performance was evaluated in batch TC adsorption studies. The EPCs endowed with superior SBET and VP were obtained from in situ one-step pyrolysis of EDTA-2K·2H2O, the achievement of excellent pore characteristics was due to the special chemical composition. More importantly, to best of our knowledge, this is the first time that the preparation of gel beads using CMCS for antibiotics removal has been reported. EPCs@CMCS gel beads retain remarkably similar characteristics to EPCs. They show superior adsorption performance towards TC due to the synergistic effect of van der Waals forces, micropore filling, π–π EDA interactions, electrostatic interactions and hydrophobic interactions. Therefore, the prepared easily retrievable gel beads are promising materials for application in wastewater treatment and provide economic benefits to the environment. The further exploration of CMCS applications in water environment purification should be promoted.Acknowledgements
This work was financially supported by the National Natural Science Foundation of China (No. 21176107, 21174057, 21277063, 21446015 and U1407123), the National Basic Research Program of China (973 Program, 2012CB821500), the Natural Science Foundation of Jiangsu Province (BK20140534), and the Ph.D. Innovation Programs Foundation of Jiangsu Province (No. CXZZ13_0668).References
- Y. Yang, S. Hao, H. Zhao, Y. Wang and X. Zhang, Electrochim. Acta, 2015, 180, 651–657 CrossRef CAS.
- L. Ji, F. Liu, Z. Xu, S. Zheng and D. Zhu, Environ. Sci. Technol., 2010, 44, 3116–3122 CrossRef CAS PubMed.
- R. R. Salunkhe, J. Tang, Y. Kamachi, T. Nakato, J. H. Kim and Y. Yamauchi, ACS Nano, 2015, 9, 6288–6296 CrossRef CAS PubMed.
- J. Tang, J. Liu, C. Li, Y. Li, M. O. Tade, S. Dai and Y. Yamauchi, Angew. Chem., Int. Ed., 2014, 53, 1–7 CrossRef.
- R. Balgis, T. Ogi, A. F. Arif, G. M. Anilkumar, T. Mori and K. Okuyama, Carbon, 2015, 84, 281–289 CrossRef CAS.
- X. Y. Chen, D. H. Xie, Z. J. Zhang and C. Chen, J. Power Sources, 2014, 246, 531–539 CrossRef CAS.
- H.-I. Joh, H. Y. Ha, J. Prabhuram, S. M. Jo and S. H. Moon, Carbon, 2011, 49, 4601–4603 CrossRef CAS.
- M. Hu, J. Reboul, S. Furukawa, N. L. Torad, Q. Ji, P. Srinivasu, K. Ariga, S. Kitagawa and Y. Yamauchi, J. Am. Chem. Soc., 2012, 134, 2864–2867 CrossRef CAS PubMed.
- W. Chaikittisilp, M. Hu, H. Wang, H. S. Huang, T. Fujita, K. C. Wu, L. C. Chen, Y. Yamauchi and K. Ariga, Chem. Commun., 2012, 48, 7259–7261 RSC.
- C. S. C. Chiew, H. K. Yeoh, P. Pasbakhsh, K. Krishnaiah, P. E. Poh, B. T. Tey and E. S. Chan, Appl. Clay Sci., 2016, 119, 301–310 CrossRef CAS.
- X. Vecino, R. Devesa-Rey, J. M. Cruz and A. B. Moldes, Carbohydr. Polym., 2015, 115, 129–138 CrossRef CAS PubMed.
- M. Zhang, R. Helleur and Y. Zhang, Carbohydr. Polym., 2015, 130, 206–212 CrossRef CAS PubMed.
- D. Klemm, B. Heublein, H. P. Fink and A. Bohn, Angew. Chem., Int. Ed., 2005, 44, 3358–3393 CrossRef CAS PubMed.
- N. Mohammed, N. Grishkewich, R. M. Berry and K. C. Tam, Cellulose, 2015, 22, 3725–3738 CrossRef CAS.
- M. Hvistendahl, Science, 2012, 336, 795 CrossRef CAS PubMed.
- L. Ji, Y. Wan, S. Zheng and D. Zhu, Environ. Sci. Technol., 2011, 45, 5580–5586 CrossRef CAS PubMed.
- T. Y. Kim, H. J. Jin, S. S. Park, S. J. Kim and S. Y. Cho, J. Ind. Eng. Chem., 2008, 14, 714–719 CrossRef CAS.
- J. Wang and S. Kaskel, J. Mater. Chem., 2012, 22, 23710–23725 RSC.
- X. T. Zhang and W. X. Chen, Microporous Mesoporous Mater., 2015, 206, 194–201 CrossRef CAS.
- X. Zhu, Y. Liu, G. Luo, F. Qian, S. Zhang and J. Chen, Environ. Sci. Technol., 2014, 48, 5840–5848 CrossRef CAS PubMed.
- R. Bai, M. Yang, G. Hu, L. Xu, X. Hu, Z. Li, S. Wang, W. Dai and M. Fan, Carbon, 2015, 81, 465–473 CrossRef CAS.
- X. Zhu, Y. Liu, C. Zhou, G. Luo, S. Zhang and J. Chen, Carbon, 2014, 77, 627–636 CrossRef CAS.
- X. J. Ma, F. Zhang, J. Y. Zhu, L. L. Yu and X. Y. Liu, Bioresour. Technol., 2014, 164, 1–6 CrossRef CAS PubMed.
- T. Horikawa, N. Sakao, T. Sekida, J. i. Hayashi, D. D. Do and M. Katoh, Carbon, 2012, 50, 1833–1842 CrossRef CAS.
- J. Gong, J. Liu, Z. Jiang, X. Wen, E. Mijowska, T. Tang and X. Chen, J. Colloid Interface Sci., 2015, 445, 195–204 CrossRef CAS PubMed.
- Y. Gao, Y. Li, L. Zhang, H. Huang, J. J. Hu, S. M. Shah and X. G. Su, J. Colloid Interface Sci., 2012, 368, 540–546 CrossRef CAS PubMed.
- M. A. Pimenta, G. Dresselhaus, M. S. Dresselhaus, L. G. Cancado, A. Jorio and R. Saito, Phys. Chem. Chem. Phys., 2007, 9, 1276–1291 RSC.
- L. Zhang, F. Zhang, X. Yang, G. Long, Y. Wu, T. Zhang, K. Leng, Y. Huang, Y. Ma, A. Yu and Y. Chen, Sci. Rep., 2013, 3, 1408 Search PubMed.
- Z. Qiang, X. Bao and W. Ben, Water Res., 2013, 47, 4107–4114 CrossRef CAS PubMed.
- S. Lagergren, K. Sven. Vetenskapsakad. Handl., 1898, 24, 1–39 Search PubMed.
- S. Azizian, J. Colloid Interface Sci., 2004, 276, 47–52 CrossRef CAS PubMed.
- D. Kavitha and C. Namasivayam, Bioresour. Technol., 2007, 98, 14–21 CrossRef CAS PubMed.
- X. Song, D. Liu, G. Zhang, M. Frigon, X. Meng and K. Li, Bioresour. Technol., 2014, 151, 428–431 CrossRef CAS PubMed.
- Y. Shen, Q. Fang and B. Chen, Environ. Sci. Technol., 2015, 49, 67–84 CrossRef CAS PubMed.
- I. Langmuir, J. Am. Chem. Soc., 1916, 38, 2221–2295 CrossRef CAS.
- H. M. F. Freundlich, Z. Phys. Chem., 1906, 57, 385–470 CAS.
- M. Temkin and V. Pyzhev, Acta Physicochim. URSS, 1940, 12, 217–222 Search PubMed.
- H. Xiao, H. Peng, S. H. Deng, X. Y. Yang, Y. Z. Zhang and Y. W. Li, Bioresour. Technol., 2012, 111, 127–133 CrossRef CAS PubMed.
- L. Zhang, X. Song, X. Liu, L. Yang, F. Pan and J. Lv, Chem. Eng. J., 2011, 178, 26–33 CrossRef CAS.
- X. Zhu, Y. Liu, F. Qian, C. Zhou, S. Zhang and J. Chen, Bioresour. Technol., 2014, 154, 209–214 CrossRef CAS PubMed.
- M. Kara, H. Yuzer, E. Sabah and M. S. Celik, Water Res., 2003, 37, 224–232 CrossRef CAS PubMed.
- M. J. Ahmed and S. K. Theydan, Chem. Eng. J., 2012, 211–212, 200–207 CrossRef CAS.
- L. Ji, W. Chen, L. Duan and D. Zhu, Environ. Sci. Technol., 2009, 43, 2322–2327 CrossRef CAS PubMed.
- Z. Y. Zhang, H. C. Lan, H. J. Liu and J. H. Qu, Colloids Surf., A, 2015, 471, 133–138 CrossRef CAS.
- P. Liu, W. J. Liu, H. Jiang, J. J. Chen, W. W. Li and H. Q. Yu, Bioresour. Technol., 2012, 121, 235–240 CrossRef CAS PubMed.
- P. H. Chang, Z. Li, J. S. Jean, W. T. Jiang, C. J. Wang and K. H. Lin, Appl. Clay Sci., 2012, 67–68, 158–163 CrossRef CAS.
Footnote |
| † Electronic supplementary information (ESI) available. See DOI: 10.1039/c6ra14877h |
| This journal is © The Royal Society of Chemistry 2016 |

