Inkjet-printed Ag electrodes on paper for high sensitivity impedance measurements†
Hanbin Ma ,
Yang Su
 ,
Chen Jiang and
Arokia Nathan*
Department of Engineering, Electrical Engineering Division, University of Cambridge, Cambridge, CB3 0FA, UK. E-mail: an299@cam.ac.uk
First published on 31st August 2016
Abstract
Low-cost electrodes were fabricated by a standard office inkjet printer with commercial silver ink on glossy paper. Compared to conventional thin-film metal thermal evaporated gold electrodes, the paper-based ones show a two-order enhanced sensitivity for impedance measurement over a low frequency range. The high surface roughness of paper electrodes increases the effective area of the electrolyte–electrode double layer capacitance, and therefore reduces the measured impedance at low frequency range. A passivation layer on the top of the paper electrodes is used to mimic the behaviour of the double layer capacitance. The surface roughness was characterized by optical microscopy and atomic force microscopy. Finite element analysis and impedance equivalent model analysis were also performed for different thin-film electrode devices.
1 Introduction
Paper as a low-cost substrate has been widely used for disposable point-of-care diagnostic devices, and most of the advanced works have been summarised and compared in recent review papers.1–4 Dedicated detection methods have also been developed, and these cover both optical-based techniques (fluorescent or colorimetric)5,6 and electrochemical methods.7–9For all electrochemical methods, electrodes play a significant role as an interface between sensing system and analyte. There are a variety of fabrication techniques available to support different electrode material deposition and patterning. For example, vacuum-based thin-film deposition techniques (e.g. thermal/e-beam evaporation and metal sputtering) are the most reliable methods which provide access to noble metals e.g. gold and platinum, and they are used for most high-end applications.10–12 On the other hand, printing techniques, such as screen and/or stencil printing, are more suitable for low-cost devices.1,3 The first carbon electrodes were screen-printed on paper for electrochemical detection by Dungchai et al.7 in 2009. More materials, e.g. Ag/AgCl,13,14 CNT15 and graphene,16 have become available for printing on paper via this technique. Ink-jet printing, using liquid phase conductive ink to replace the pastes in screen/stencil printing, is a promising technique that provides a “pattern on demand” feature.17 However, the process requires printers normally equipped with sophisticated accessories, such as precise volume controlled nozzle and dedicated driving electronics. In addition, the ink composition and conductive particle selection also need to be carefully designed to increase the material printability.18,19 In recent years, office inkjet printers compatible silver inks have been developed for fast circuit prototyping. Commercial suppliers (e.g. AgIC in this work) provide silver cartridges which enable regular office inkjet printer to print conductive silver tracks on glossy paper directly. This technique reduces the cost of inkjet printing significantly, and therefore can be utilised as an enabling technique for fabrication of disposable sensors.
In this work, we demonstrate the first time the possible use of office inkjet printing of silver electrodes on paper as ultra-sensitive electrodes for impedance measurement.
Impedance-based sensors, detecting and measuring samples-under-tests response under AC signals, have been gaining popularity for biological sensing in recent years.20 These sensors are now widely applied in detections of various scales, e.g. DNA,21–23 proteins,24,25 cells26,27 and bacteria.28 For impedance-based measurements, an electrode–electrolyte double layer will be formed at the electrode surface, and this double layer capacitance behaves as a parasitic component to reduce the sensitivity.29 In some measurements, it is also known as electrode polarisations, which significantly reduce sensing capability at low frequency (typically below 1 kHz). In recent years, novel-material-based electrodes with unique surface properties have been developed which could potentially address this problem, e.g. graphene, graphene related materials30–32 and nanowires.33,34 However, one of the major concerns about nanomaterials for electrodes is the cost, since most of nanomaterial fabrication and pattern involve expensive equipment and dedicated lab environments. In addition, high temperature and aggressive chemicals may also be involved, making most of these modified electrodes incompatible with cheap substrates, e.g. plastic and paper.
In this work, low-cost paper-based electrodes were applied to impedance measurements. The low-cost devices were directly printed by a standard office inkjet printer with commercial silver ink on glossy paper. As a control experiment, a group of printed electrodes was passivated with a layer of SiNx to mimic the electrode–electrolyte double layer. Saline measurements were performed with both non-passivated and passivated Ag electrodes. Thin-film gold electrodes fabricated by conventional techniques were also used as a standard reference. From both saline measurements and simulation, the printed electrodes show an enhanced sensitivity over conventional thin-film gold electrodes.
2 Experimental
2.1 Electrode design and fabrication
2.2 Sodium chloride concentration measurements
Three groups of sodium chloride (NaCl) solution with different concentrations were prepared for the impedance measurements as shown in ESI Table 1.† The NaCl powder was purchased from Sigma-Aldrich (S7653). Deionised (DI) water from Sigma-Aldrich (38796) was used with conductivity lower than 4.3 μS cm−1. 2.5 g of NaCl powder was dissolved in 1 L of DI water to prepare a stock solution at a concentration of 2.5 mg mL−1. The stock solution was diluted with DI water by 1![[thin space (1/6-em)]](https://www.rsc.org/images/entities/char_2009.gif) :
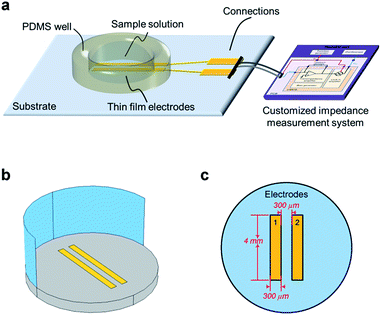
:![[thin space (1/6-em)]](https://www.rsc.org/images/entities/char_2009.gif) 1 yielding a concentration of 1.25 mg mL−1, and further diluted for concentrations of 0.625 mg mL−1 and 0.312 mg mL−1. 80 μL of each sample was used for each impedance measurements. As shown in Fig. 1a, all electrodes were surrounded by a PDMS ring to contain the electrolyte, and they were connected to an customized impedance measurement system.35 An AC signal with the amplitude of 100 mV was used with the frequencies ranging from 10 Hz to 10 MHz. The measurement results were analysed and fitted with equivalent circuit models. All the data was fitted by ZView®, supplied by Scribner Associated Inc.
1 yielding a concentration of 1.25 mg mL−1, and further diluted for concentrations of 0.625 mg mL−1 and 0.312 mg mL−1. 80 μL of each sample was used for each impedance measurements. As shown in Fig. 1a, all electrodes were surrounded by a PDMS ring to contain the electrolyte, and they were connected to an customized impedance measurement system.35 An AC signal with the amplitude of 100 mV was used with the frequencies ranging from 10 Hz to 10 MHz. The measurement results were analysed and fitted with equivalent circuit models. All the data was fitted by ZView®, supplied by Scribner Associated Inc.
2.3 Finite element analysis
Finite element analysis (FEA) of the contact and contactless electrode systems was performed using COMSOL Multiphysics AC/DC package. A 3-dimensional model (as shown in Fig. 1b) was synthesised based on the specifications of the fabricated electrodes. Fig. 1c is the top view of the model, and the electrodes design is consistent with the dimensions of the fabricated electrodes. The model consists of an insulated substrate, conductive electrodes and electrolyte. For the contactless simulation, a thin dielectric layer was also inserted between electrodes and the electrolyte. The detailed simulation setup has been reported previously.36,372.4 Cell constant analysis
The cell constant κ (cm−1) was used in this study to evaluate the sensitivities of different electrodes. It can be calculated as:37
 | (1) |
3 Results and discussion
3.1 Sodium chloride concentration measurements
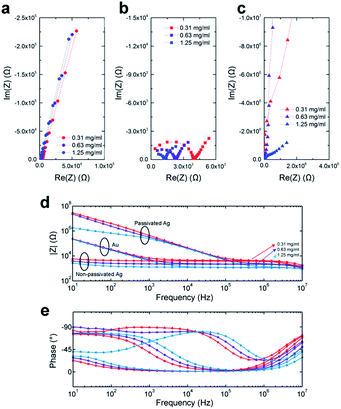
Three different concentrated NaCl solutions were measured by all three groups of electrodes. The Cole–Cole plots of the impedance measurements for Au, non-passivated and passivated Ag electrodes are shown as Fig. 2a–c. For Au electrodes (Fig. 2a) and non-passivated Ag electrodes (Fig. 2b) measurements, higher concentration solution (data in blue) always shows lower impedance due to the higher solution conductivity. However, the passivated Ag electrodes (Fig. 2c) measurements do not agree with the non-passivated ones, indicating that the sample solutions were out of the sensitive region for the passivated Ag at part of the stimulus frequency. Fig. 2d and e illustrate the Bode plot of all nine measurements. For Au electrodes, the constant slope at low frequency range (10 Hz to 10 kHz) for all three concentrations indicates the electrode–electrolyte double layer capacitance. As the measurement frequency increases, the influence of double layer capacitance reduces, and the magnitudes of impedance become independent of the stimulus frequency. The cut-off frequency (ft) is defined as:38
 | (2) |
For the passivated Ag electrodes, the electrolyte does not directly contact with the electrodes, and there is a layer of insulator performed as a dielectric layer. Therefore, the double-layer capacitance Cdl is replaced by the insulator capacitance Ci. In this work, a 200 nm SiNx was used as the insulator, and the Ci is much smaller than Cdl in Au electrode since 200 nm is much greater than the typical dimension of the double layer. As a result, the cut-off frequency for passivated-Ag electrodes (Fig. 2d) is much higher than that of Au electrodes.
3.2 Equivalent circuit fitting
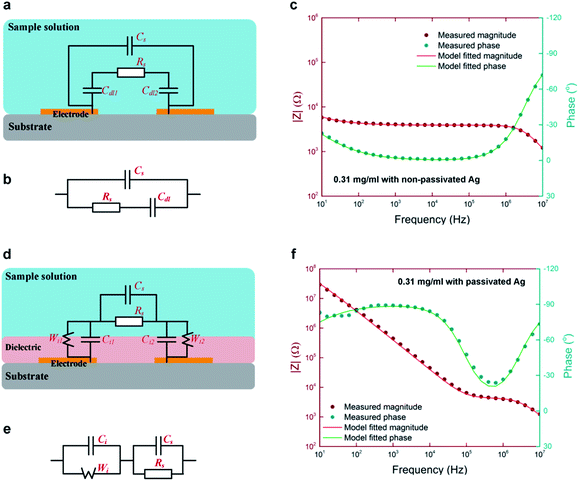
Equivalent circuit models are used to further investigate the saline impedance results and validate the effects on double layer/insulator capacitances. As shown in Fig. 3a, a non-passivated impedance measurement model is presented, where Cdl is the double layer capacitance at both electrodes, Rs and Cs are the solution resistance and capacitance, respectively. Fig. 3b is the simplified model, which was used to fit all the non-passivated electrode measurements. Fig. 3c shows both the measured and modelled results of non-passivated Ag electrode in a Bode plot. Impedance magnitude and phase angle are all highly matched from 10 Hz to 10 MHz. Similar to the non-passivate ones, Fig. 3d shows the schematic of the model of passivated impedance measurement. Since glossy papers were used as the substrates and inkjet-printed Ag was used as the electrodes, the surface was too rough for the subsequence PECVD process to form an ideal insulation layer. Insulator capacitance (Ci) is paralleled with a Warburg element (Wi) to simulate the non-ideal interface and the dielectric leakage current induced resistance.Fig. 3e and f show the simplified equivalent circuit and the model fitted results. The fitting agreed with the measurement results over all frequencies. As shown in ESI Table 2,† model extracted solution resistance (Rs) are consistent for all three groups of electrodes with the same sample concentration. Complete equivalent fitting results and parameters can be found in ESI Fig. 1–3.†
3.3 FEA simulation
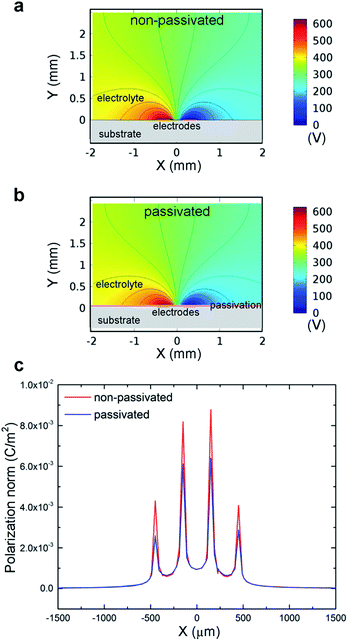
For impedance measurements, a source current was injected between the electrodes, leading to an electric field in the electrolyte. The electric potential distribution will affect the measurement results between different electrode setups. Therefore, it is important to understand the effect of the passivation layer on electric potential distribution to evaluate the electrode performance. Fig. 4a and b depict the potential distributions of non-passivated and passivated electrodes setup with 0.31 mg mL−1 NaCl solution. From the colour map and equal-potential lines, the two systems show identical results. Fig. 4c shows the normalized polarization at the interface. For the non-passivated model, the interface was defined as the top layer of the electrode, and the distance between the interface and the driving electrodes is zero. On the other hand, the passivated model defined the interface as the top of the insulation layer, and the gap between the interface and the electrodes is 200 nm. This difference causes the slight polarization mismatch as shown in Fig. 4c.3.4 Surface roughness
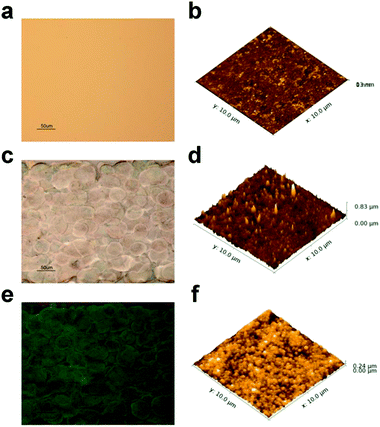
As discussed in Section 3.1, the electrode surface roughness is the main reason for the increased double layer capacitance in non-passivated Ag electrodes. Fig. 5 a shows an optical microscope image of the Au electrode surface, and Fig. 5b is an AFM image over a 10 μm × 10 μm square. Vacuum deposition techniques normally give a very good film quality, and the RMS of this Au surface is only 0.8 nm. For the non-passivated Ag electrode, silver nanoparticles were directly injected onto the substrate, and no post-annealing was applied. Ink droplets formed grains overlapped together, and the grain size as observed in Fig. 5c is about 50 μm. The AFM image (Fig. 5d) shows the surface roughness within one grain with 46.5 nm RMS. After passivated with SiNx at 150 °C, the printed Ag was further sintered, and the grain size (Fig. 5e) was slightly increased. The AFM image of the insulator on the top of one grain is shown as Fig. 5f, and the RMS is approximately 26.4 nm.3.5 Cell constant and sensitivity
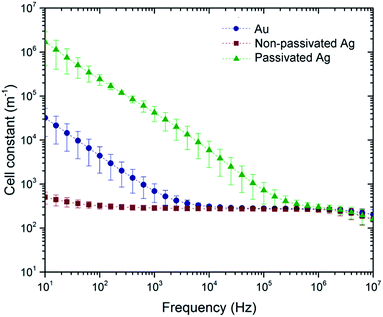
The cell constant (as expressed in eqn (1)) of an impedance sensor, is defined as the ratio of the measured impedance and the specific impedance of sample solution. It is an effective parameter to evaluate the electrode performance. In general, smaller cell constant indicate the sensor is more sensitive to the analyte.Based on eqn (1) and parameters listed in ESI Table 1,† frequency-dependent complex domain cell constants of Au, non-passivated and passivated Ag electrodes were calculated. For each electrode system at a certain frequency, the mean cell constant value of three NaCl concentrations is plotted in Fig. 6 with the standard deviation as the error bar. The cut-off frequency of different electrodes is also reflected in this cell constant plot. For Au and passivated Ag electrodes, the cell constants reduce as the stimulus frequency increases, and it becomes frequency-independent after the cut-off point. Similar to the impedance Bode plot as shown in Fig. 2d, the cut-off frequency of the non-passivated Ag is not observed in the measurement frequency range. The non-passivated Ag electrode cell constant remains at the lowest level from 10 Hz to 10 MHz. This reflects almost two-order sensitivity enhancement at 10 Hz. On the other hand, for the passivated Ag electrode, the electrode–electrolyte capacitance is artificially increased by an insulation layer. As a result the cell constant is more than an order of magnitude greater than that of the reference Au electrodes. This also explains why this electrode system is unlikely to be sensitive to any analyte in the lower frequency range, since the electrical double layer induced by the dielectric layer dominates the impedance measurement.
From the cell constant analysis, it is clear that a rough electrode surface produced by an office inkjet printer contributes to the reduction of electrode–electrolyte double layer impedance, thereby reducing the cell constant. Apart from electrode geometry optimization39,40 and special measurement arrangement,37,41 electrode surface engineering can be considered as an alternative method to enhance the impedance sensing capability.
4 Conclusions
In this paper, low-cost electrodes were fabricated by a standard office inkjet printer with silver ink. This technique provides a ‘pattern on demand’ feature for electrodes fabrication, while significantly reduces the cost compared to lab-used material inkjet printer. In addition, the surface roughness of the printed silver electrodes is much higher compared to conventional thin-film gold electrodes; which significantly reduces electrode–electrolyte double layer impedance. It therefore leads to a reduced cell constant and a two-order sensitivity enhancement at 10 Hz. A separate experiment using passivated Ag electrode with SiNx dielectric layer validate the theory that cell constant can be manipulated by controlling the electro-electrolyte double layer.References
- A. K. Yetisen, M. S. Akram and C. R. Lowe, Lab Chip, 2013, 13, 2210–2251 RSC.
- C. Desmet, C. A. Marquette, L. J. Blum and B. Doumèche, Biosens. Bioelectron., 2016, 76, 145–163 CrossRef CAS PubMed.
- J. Hu, S. Wang, L. Wang, F. Li, B. Pingguan-Murphy, T. J. Lu and F. Xu, Biosens. Bioelectron., 2014, 54, 585–597 CrossRef CAS PubMed.
- J. Mettakoonpitak, K. Boehle, S. Nantaphol, P. Teengam, J. a. Adkins, M. Srisa-Art and C. S. Henry, Electroanalysis, 2016, 28, 1–18 CrossRef.
- N. K. Thom, G. G. Lewis, K. Yeung and S. T. Phillips, RSC Adv., 2014, 4, 1334–1340 RSC.
- E. Petryayeva and W. R. Algar, RSC Adv., 2015, 5, 22256–22282 RSC.
- W. Dungchai, O. Chailapakul and C. S. Henry, Anal. Chem., 2009, 81, 5821–5826 CrossRef CAS PubMed.
- M. Santhiago and L. T. Kubota, Sens. Actuators, B, 2013, 177, 224–230 CrossRef CAS.
- Z. Nie, C. A. Nijhuis, J. Gong, X. Chen, A. Kumachev, A. W. Martinez, M. Narovlyansky and G. M. Whitesides, Lab Chip, 2010, 10, 477–483 RSC.
- D. L. Huber, R. P. Maginell, M. A. Samara, B.-I. Kim and B. C. Bunker, Science, 2003, 301, 352–354 CrossRef CAS PubMed.
- W. Gao, S. Emaminejad, H. Y. Y. Nyein, S. Challa, K. Chen, A. Peck, H. M. Fahad, H. Ota, H. Shiraki, D. Kiriya, D.-H. Lien, G. A. Brooks, R. W. Davis and A. Javey, Nature, 2016, 529, 509–514 CrossRef CAS PubMed.
- U. Kim, S. Ghanbari, A. Ravikumar, J. Seubert and S. Figueira, IEEE J. Transl. Eng. Health Med., 2013, 1, 3700207 CrossRef PubMed.
- I. Shitanda, M. Komoda, Y. Hoshi and M. Itagaki, Analyst, 2015, 6481–6484 RSC.
- Z. Nie, F. Deiss, X. Liu, O. Akbulut and G. M. Whitesides, Lab Chip, 2010, 10, 3163–3169 RSC.
- L. Zhang, M. Zhou, D. Wen, L. Bai, B. Lou and S. Dong, Biosens. Bioelectron., 2012, 35, 155–159 CrossRef CAS PubMed.
- C. Sriprachuabwong, C. Karuwan, A. Wisitsorrat, D. Phokharatkul, T. Lomas, P. Sritongkham and A. Tuantranont, J. Mater. Chem., 2012, 22, 5478 RSC.
- M. Singh, H. M. Haverinen, P. Dhagat and G. E. Jabbour, Adv. Mater., 2010, 22, 673–685 CrossRef CAS PubMed.
- H.-H. Lee, K.-S. Chou and K.-C. Huang, Nanotechnology, 2005, 16, 2436–2441 CrossRef CAS PubMed.
- H. W. Choi, T. Zhou, M. Singh and G. E. Jabbour, Nanoscale, 2014, 7, 3338–3355 RSC.
- M. Crescentini, M. Bennati and M. Tartagni, Electroanalysis, 2012, 24, 563–572 CrossRef CAS.
- H. Ma, R. W. R. Wallbank, R. Chaji, J. Li, Y. Suzuki, C. Jiggins and A. Nathan, Sci. Rep., 2013, 3, 2730 Search PubMed.
- J. Liu, S. Tian, P. E. Nielsen and W. Knoll, Chem. Commun., 2005, 2969–2971 RSC.
- K.-H. Lee, J.-O. Lee, M.-J. Sohn, B. Lee, S.-H. Choi, S. K. Kim, J.-B. Yoon and G.-H. Cho, Biosens. Bioelectron., 2010, 26, 1373–1379 CrossRef CAS PubMed.
- M. S. Mannoor, T. James, D. V Ivanov, L. Beadling and W. Braunlin, Biophys. J., 2010, 98, 724–732 CrossRef CAS PubMed.
- S. K. Srivastava, R. Ramaneti, M. Roelse, H. D. Tong, E. X. Vrouwe, A. G. M. Brinkman, L. C. P. M. de Smet, C. J. M. van Rijn and M. a. Jongsma, RSC Adv., 2015, 5, 52563–52570 RSC.
- T. Sun, E. J. Swindle, J. E. Collins, J. a. Holloway, D. E. Davies and H. Morgan, Lab Chip, 2010, 10, 1611–1617 RSC.
- R. Pradhan, S. Rajput, M. Mandal, A. Mitra and S. Das, RSC Adv., 2014, 4, 9432 RSC.
- J. Chen, J. Cai, H. Hu, X. Huang, T. Yi, K. Wang and S. Pan, RSC Adv., 2015, 5, 85919–85927 RSC.
- J. S. Daniels and N. Pourmand, Electroanalysis, 2007, 19, 1239–1257 CrossRef CAS PubMed.
- B. J. Sanghavi, W. Varhue, J. L. Chávez, C. F. Chou and N. S. Swami, Anal. Chem., 2014, 86, 4120–4125 CrossRef CAS PubMed.
- M. a. Gross, M. J. a. Sales, M. a. G. Soler, M. a. Pereira-da-Silva, M. F. P. da Silva and L. G. Paterno, RSC Adv., 2014, 4, 17917 RSC.
- Z. Wang, X. Zhou, J. Zhang, F. Boey and H. Zhang, J. Phys. Chem. C, 2009, 113, 14071–14075 CAS.
- P. Alivisatos, Nat. Biotechnol., 2004, 22, 47–52 CrossRef CAS PubMed.
- P. Mostafalu and S. Sonkusale, RSC Adv., 2015, 5, 8680–8687 RSC.
- H. Ma, J. Li, X. Cheng and A. Nathan, Sens. Actuators, B, 2015, 211, 77–82 CrossRef CAS.
- Y. Su, Math. Probl. Eng., 2014, 2014, e581063 Search PubMed.
- H. Ma, Y. Su and A. Nathan, Sens. Actuators, B, 2015, 221, 1264–1270 CrossRef CAS.
- B. Timmer, W. Sparreboom, W. Olthuis, P. Bergveld and A. van den Berg, Lab Chip, 2002, 2, 121–124 RSC.
- Q. Liu, J. Yu, L. Xiao, J. C. O. Tang, Y. Zhang, P. Wang and M. Yang, Biosens. Bioelectron., 2009, 24, 1305–1310 CrossRef CAS PubMed.
- M. Varshney and Y. Li, Biosens. Bioelectron., 2009, 24, 2951–2960 CrossRef CAS PubMed.
- V. Valente and A. Demosthenous, Sensors, 2016, 16, 1159 CrossRef PubMed.
Footnote |
| † Electronic supplementary information (ESI) available: NaCl solution electrical parameters used for FEA in this work; impedance equivalent model fitting and extracted parameters. See DOI: 10.1039/c6ra18645a |
| This journal is © The Royal Society of Chemistry 2016 |

