 Open Access Article
Formation of coke during the esterification of pyrolysis bio-oil
Liping
Wu
,
Xun
Hu
 ,
Shuai
Wang
,
Daniel
Mourant
,
Yao
Song
,
Tingting
Li
and
Chun-Zhu
Li
*
,
Shuai
Wang
,
Daniel
Mourant
,
Yao
Song
,
Tingting
Li
and
Chun-Zhu
Li
*
Fuels and Energy Technology Institute, Curtin University of Technology, GPO Box U1987, Perth, WA 6845, Australia. E-mail: chun-zhu.li@curtin.edu.au; Fax: +61 8 9266 1138; Tel: +61 8 9266 1131
First published on 6th September 2016
Abstract
Coke formation during the esterification of bio-oil in alcohols and water over a solid acid catalyst Amberlyst 70 has been investigated. The amounts of coke formed from the acid-treatment of bio-oil in various alcohols are half of that in water. Alcohols stabilize the major components in bio-oil such as sugars, furans, aldehydes, carboxylic acids and phenolics. On the other hand, water promotes the polymerisation of these components. In addition, experimental parameters also affect the coke formation during acid-treatment of bio-oil in alcohols. The elevated reaction temperature, long residence time, and high dosage of catalyst significantly promoted coke formation. The soluble polymeric material and insoluble polymeric material was characterized with FI-IR and UV-florescence spectroscopies. The results show that the coke formed is highly aromatic. The aromatics in bio-oil have a significant contribution to the formation of coke during the esterification of bio-oil.
Introduction
Bio-oil is a liquid product from the pyrolysis of biomass, which can be upgraded to biofuel.1–5 During the upgrading of bio-oil, for example via hydrotreating, coke formation is found to be one of the biggest bottle-neck challenges as it can block reactors and lead to fast catalyst deactivation.6–11 Bio-oil thus needs to be stabilized before further treatment under harsh conditions.12–14 Esterification in alcohols is one method to stabilize bio-oil through the removal of the reactive compounds such as sugars and furans via various acid-catalyzed reactions.15Various acid catalysts has been applied in the esterification of bio-oil, including mineral acids, solid acidic resin, supported acid catalysts and sulfated metal oxides. The inorganic liquid acid catalysts can disperse homogeneously in bio-oil. However, the difficulty to separate them from products, high corrosiveness and low recyclability restrain their application. In comparison, solid acid catalysts can easily recover from product mixture and could be reused, which had been widely employed as catalysts via esterification of bio-oil.16–20 The studies about bio-oil esterification were mainly focused on the transformation of bio-oil into the required products and the development of catalysts,21–25 while the coke formation during esterification has hardly been noticed. Coke formed during esterification cannot be neglected as it can deactivate solid acid catalysts, lower the efficiency of the process and increase the cost.26
Various reaction parameters affect the coke formation during the esterification of bio-oil. For example, various alcohols can be used to esterify bio-oil, but they have different structures and possibly have different effects on coke formation. In addition, alcohols can suppress the polymerisation of sugars under the esterification conditions.15 However, it has not been cleared whether these alcohols can also suppress the polymerisation reactions in bio-oil or not. Further to this, it has also not been cleared about the contribution of water towards the polymerisation of bio-oil as water is the most abundant compound in bio-oil.
Understanding the effects of different alcohols and water on coke formation during esterification could help to understand the mechanism for coke formation. This will further help to develop the countermeasures to suppress the coke formation. Thus, in this study the characteristics of coke formation from bio-oil in various alcohols (methanol, ethanol, 1-propanol, 1-butanol, ethylene glycol), phenol (another form of “alcohol”) and water under a wide range of reaction conditions were investigated. The functional groups and structures of the coke were analyzed with FT-IR and UV-fluorescence spectroscopy.
Experimental
Materials
The crude pyrolysis oil used in this study was produced from the fast pyrolysis of mallee wood in a fluidized-bed reactor (nominally 1 kg h−1) at 500 °C. A detailed description of reactor system and experimental procedure can be found in the literatures.27,28 Bio-oil sample was kept in fridge after being produced. All of the chemicals used here were purchased form Sigma Aldrich and Merck Australia. The acid catalyst Amberlyst 70 was obtained commercially from Dow Company (Shanghai branch) and was used without any pre-treatment.Experiment procedure
The experiments in this work were carried out with an autoclave reactor (Autoclave Engineers, Division of Snap-Tite Inc.).29 The mass ratio of bio-oil to alcohols or phenol or water was 1![[thin space (1/6-em)]](https://www.rsc.org/images/entities/char_2009.gif) :
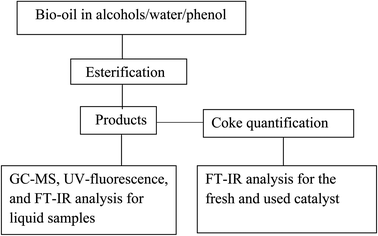
:![[thin space (1/6-em)]](https://www.rsc.org/images/entities/char_2009.gif) 2. The reaction temperature ranged from 90 to 170 °C and reaction time ranged from 30 to 360 minutes. The specific parameters of typical experiments were shown in Table 1. The flowchart of the reaction system was illustrated in Fig. 1. Typically, the bio-oil and alcohols with the mass ratio of 1
2. The reaction temperature ranged from 90 to 170 °C and reaction time ranged from 30 to 360 minutes. The specific parameters of typical experiments were shown in Table 1. The flowchart of the reaction system was illustrated in Fig. 1. Typically, the bio-oil and alcohols with the mass ratio of 1![[thin space (1/6-em)]](https://www.rsc.org/images/entities/char_2009.gif) :
:![[thin space (1/6-em)]](https://www.rsc.org/images/entities/char_2009.gif) 2 were loaded into an autoclave vessel at room temperature. The autoclave was flushed with nitrogen for three times to exclude air and then sealed in nitrogen atmosphere. The reactor was then heated up to the target temperature at a stirring rate of 500 rpm in 20 min. Once reaction temperature reached the set value, a sample was taken immediately and the rest were taken at 20 min intervals until the end of the experiment. In some other experiments no sampling was taken with the purpose of determining the amount of coke formed during the esterification of bio-oil. The polymeric material formed was collected together with catalyst, washed with acetone, and dried in an oven at 105 °C for four hours to constant weight to measure the coke formed.
2 were loaded into an autoclave vessel at room temperature. The autoclave was flushed with nitrogen for three times to exclude air and then sealed in nitrogen atmosphere. The reactor was then heated up to the target temperature at a stirring rate of 500 rpm in 20 min. Once reaction temperature reached the set value, a sample was taken immediately and the rest were taken at 20 min intervals until the end of the experiment. In some other experiments no sampling was taken with the purpose of determining the amount of coke formed during the esterification of bio-oil. The polymeric material formed was collected together with catalyst, washed with acetone, and dried in an oven at 105 °C for four hours to constant weight to measure the coke formed.
| Reaction medium | Mass ratioa | Bio-oil (g) | Reaction time (min) | Reaction temperature (°C) | Catalystb loading (wt%) | Coke yieldc (wt%) |
|---|---|---|---|---|---|---|
| a The mass ratio refers to the ratio of bio-oil to reaction medium. b The catalyst loading was based on the mass of bio-oil and solvent. c The coke yield was based on the mass of bio-oil. d Reaction occurred at room temperature. e The mass of coke included soluble polymeric material and insoluble polymeric material, while in other experiments only referred to insoluble polymeric material. | ||||||
| Water | 1![[thin space (1/6-em)]](https://www.rsc.org/images/entities/char_2009.gif) : :![[thin space (1/6-em)]](https://www.rsc.org/images/entities/char_2009.gif) 2 2 |
25 | 120 | 170 | 15 | 27.6 |
| Methanol | 1![[thin space (1/6-em)]](https://www.rsc.org/images/entities/char_2009.gif) : :![[thin space (1/6-em)]](https://www.rsc.org/images/entities/char_2009.gif) 2 2 |
25 | 120 | RTd | 15 | 2.9 |
| Methanol | 1![[thin space (1/6-em)]](https://www.rsc.org/images/entities/char_2009.gif) : :![[thin space (1/6-em)]](https://www.rsc.org/images/entities/char_2009.gif) 2 2 |
25 | 120 | 170 | 15 | 15.4 |
| Ethanol | 1![[thin space (1/6-em)]](https://www.rsc.org/images/entities/char_2009.gif) : :![[thin space (1/6-em)]](https://www.rsc.org/images/entities/char_2009.gif) 2 2 |
25 | 120 | 170 | 15 | 15.4 |
| 1-Propanol | 1![[thin space (1/6-em)]](https://www.rsc.org/images/entities/char_2009.gif) : :![[thin space (1/6-em)]](https://www.rsc.org/images/entities/char_2009.gif) 2 2 |
25 | 120 | 170 | 15 | 15.5 |
| 1-Butanol | 1![[thin space (1/6-em)]](https://www.rsc.org/images/entities/char_2009.gif) : :![[thin space (1/6-em)]](https://www.rsc.org/images/entities/char_2009.gif) 2 2 |
25 | 120 | 170 | 15 | 15.6 |
| Ethylene glycol | 1![[thin space (1/6-em)]](https://www.rsc.org/images/entities/char_2009.gif) : :![[thin space (1/6-em)]](https://www.rsc.org/images/entities/char_2009.gif) 2 2 |
25 | 120 | 170 | 15 | 18.0 |
| Methanol | 1![[thin space (1/6-em)]](https://www.rsc.org/images/entities/char_2009.gif) : :![[thin space (1/6-em)]](https://www.rsc.org/images/entities/char_2009.gif) 2 2 |
25 | 120 | 90 | 15 | 3.2 |
| Methanol | 1![[thin space (1/6-em)]](https://www.rsc.org/images/entities/char_2009.gif) : :![[thin space (1/6-em)]](https://www.rsc.org/images/entities/char_2009.gif) 2 2 |
25 | 120 | 130 | 15 | 7.9 |
| Methanol | 1![[thin space (1/6-em)]](https://www.rsc.org/images/entities/char_2009.gif) : :![[thin space (1/6-em)]](https://www.rsc.org/images/entities/char_2009.gif) 2 2 |
25 | 120 | 170 | 5 | 10.4 |
| Methanol | 1![[thin space (1/6-em)]](https://www.rsc.org/images/entities/char_2009.gif) : :![[thin space (1/6-em)]](https://www.rsc.org/images/entities/char_2009.gif) 2 2 |
25 | 120 | 170 | 10 | 14.8 |
| Methanol | 1![[thin space (1/6-em)]](https://www.rsc.org/images/entities/char_2009.gif) : :![[thin space (1/6-em)]](https://www.rsc.org/images/entities/char_2009.gif) 2 2 |
25 | 30 | 170 | 15 | 11.5 |
| Methanol | 1![[thin space (1/6-em)]](https://www.rsc.org/images/entities/char_2009.gif) : :![[thin space (1/6-em)]](https://www.rsc.org/images/entities/char_2009.gif) 2 2 |
25 | 360 | 170 | 15 | 16.2 |
| Methanol | 1![[thin space (1/6-em)]](https://www.rsc.org/images/entities/char_2009.gif) : :![[thin space (1/6-em)]](https://www.rsc.org/images/entities/char_2009.gif) 1 1 |
40 | 120 | 170 | 15 | 15.4 |
| Methanol | 1![[thin space (1/6-em)]](https://www.rsc.org/images/entities/char_2009.gif) : :![[thin space (1/6-em)]](https://www.rsc.org/images/entities/char_2009.gif) 1 1 |
40 | 120 | 170 | 15 | 20.0e |
| Phenol | 1![[thin space (1/6-em)]](https://www.rsc.org/images/entities/char_2009.gif) : :![[thin space (1/6-em)]](https://www.rsc.org/images/entities/char_2009.gif) 2 2 |
20 | 120 | 170 | 15 | 19.6 |
The definitions of typical compounds conversion was as follows (mol basis):
GC-MS analysis
The products were analysed using an Agilent GC-MS (6890 series GC with 5973 series MS detector) equipped with a capillary column (HP-INNOWax). The bio-oil samples were diluted with acetone first to ca. 10 wt% and was then injected into the injection port with a split ratio of 50![[thin space (1/6-em)]](https://www.rsc.org/images/entities/char_2009.gif) :
:![[thin space (1/6-em)]](https://www.rsc.org/images/entities/char_2009.gif) 1. The oven was held at 35 °C for 1.7 min, and then heated to 260 °C at a rate of 10 °C min−1 and held at 260 °C for 10 min. Standards was injected to identify and quantify the compounds when available. One of the GC-MS spectra was shown in Fig. 2, and the identification of typical compounds was shown in Table 2 as well.
1. The oven was held at 35 °C for 1.7 min, and then heated to 260 °C at a rate of 10 °C min−1 and held at 260 °C for 10 min. Standards was injected to identify and quantify the compounds when available. One of the GC-MS spectra was shown in Fig. 2, and the identification of typical compounds was shown in Table 2 as well.
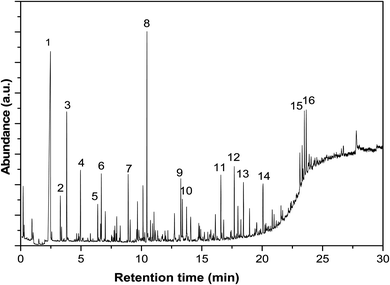 | ||
| Fig. 2 GC-MS spectrum of the bio-oil after esterification with methanol for 120 minutes at 170 °C. See Table 2 for the identification of the compounds. | ||
| Number | Compounds | Number | Compounds |
|---|---|---|---|
| 1 | Water | 9 | 1,2-Cyclopentanedione, 3-methyl- |
| 2 | 2-Propanone, 1-methoxy- | 10 | 2-Cylopenten-1-one, 2-hydroxy-3-methyl- |
| 3 | Ethane, 1,1,2-trimethoxy- | 11 | Butanoic acid, dimethyl ester |
| 4 | 2-Propanone, 1,1-dimethoxy- | 12 | Phenol, 2,6-dimethoxy- |
| 5 | Acetic acid, dimethoxy-, methyl ester | 13 | 1,2,4-Trimethoxybenzene |
| 6 | 2-Propanone, 1-hydroxy- | 14 | Phenol, 2,6-dimethoxy-4-(2-propenyl)- |
| 7 | Acetic acid | 15 | Ethanone, 1-(4-hydroxy-3,5-dimethoxyohenyl)- |
| 8 | Methyl levulinate | 16 | Desaspidinol |
FT-IR and UV-fluorescence spectroscopic analysis
FT-IR spectra were recorded using a Perkin-Elmer Spectrum GX FT-IR/Raman spectrometer in the 4000–500 cm−1 range with a spectral resolution of 4 cm−1 at room temperature. Each spectrum represented the average of at least 6 scans. The solid catalyst was dried at 105 °C for two hours, ground to powder, mixed with KBr (ca. 2 wt%) and pressed into a pellet for the acquisition of the spectra. Liquid samples were diluted by isopropanol and then was injected into a liquid sample cell formed by CaF2 windows with a spacer size of 0.025 mm in between.UV-fluorescence spectra of samples were recorded using a Perkin-Elmer LS50B spectrometer, indicating the information about the relative size and concentration of aromatic rings. The UV-fluorescence spectra of samples were recorded with a constant energy difference of −2800 cm−1 and a scan speed of 200 nm min−1. Samples were diluted with methanol to minimise the effect of self-absorption. The intensity of UV-fluorescence is in a linear relationship with the concentration of sample. The excitation wavelength indicates the size of aromatic rings. For example, that at 280 nm represents mono aromatic ring, while that at 330 nm represents two fused benzene rings and that at 380 nm represents the aromatics containing around three or more than three fused benzene rings.30–32
Results and discussion
Coke formation in different alcohols and water
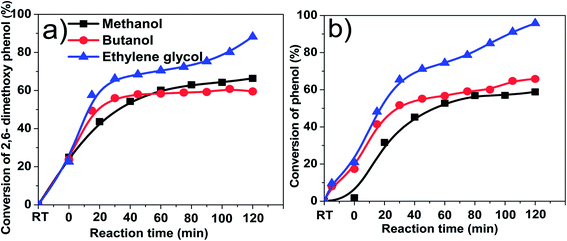
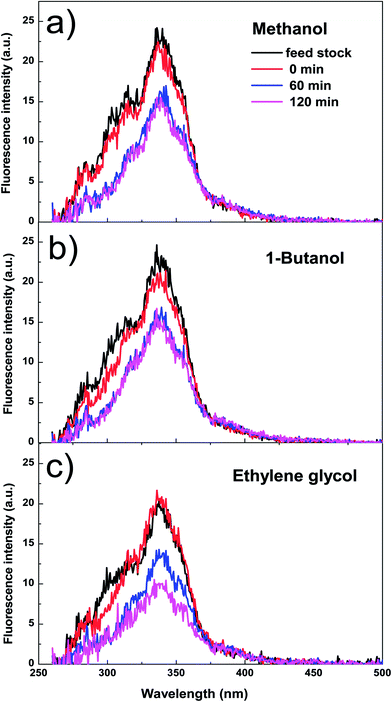
Table 1 shows the coke formation during the acid-treatment of bio-oil with various alcohols and water. The effects of methanol and 1-butanol on the coke formation were quite similar (coke yield: 15.4 wt% versus 15.6 wt%), although 1-butanol has a long carbon chain and methanol has a short one. The longer aliphatic carbon chain in 1-butanol does not have remarkable impact on the amount of coke formed. The steric effect of different sizes of the alcohols with the different carbon chain during esterification of bio-oil was relatively small.However, more coke was formed in the esterification of bio-oil with ethylene glycol. The multiple hydroxyl groups in ethylene glycol made the alcohol very reactive. For example, the conversions of phenol and 2,6-dimethoxyphenol in bio-oil (Fig. 3) were similar in methanol and 1-butanol but relatively higher in ethylene glycol. The conversion of 2,6-dimethoxyphenol increased rapidly in alcohols within the first 30 minutes, reaching a plateau after 40 minutes in methanol and butanol. However, in ethylene glycol, the conversion kept increasing with the prolonged reaction time. Similar phenomenon was observed in the conversion of phenol. However it is very difficult to identify the exact products from the conversion of 2,6-dimethoxyphenol due to the complexity of bio-oil, but UV-fluorescence characterization (Fig. 4) can give us a clue about the reactivity of aromatics in different alcohols.
Fig. 4 shows the fluorescence intensity of the aromatics in the esterified bio-oil versus reaction time. The decreases in the intensity with reaction time indicate that some aromatics were transformed from liquid phase into solid phase (form coke). Increasing the holding time from 0 to 60 min, the fluorescence intensity of the aromatics in all alcohols declined significantly, indicating the polymerisation of these aromatics. This agrees well with the conversion trend of phenol and 2,6-dimethoxyphenol shown in Fig. 3 at the same time frame.
After 60 min of residence time, in methanol and 1-butanol the fluorescence intensity reached a steady state and the reactions also reached an equilibrium, but in ethylene glycol the intensity continued to decrease, which is also well related with the continuous conversion of phenol and 2,6-dimethoxyphenol in ethylene glycol with progress of the reaction. These results clearly indicate that ethylene glycol is more reactive towards the aromatics in bio-oil than methanol and 1-butanol, producing more polymeric materials.
Water is an important product from the fast pyrolysis of biomass. It plays a key role in the coke formation from bio-oil. Compared with the coke yield in methanol, the coke yield in water almost doubled. Although water also has a hydroxyl group, it did not show the same effect of coke formation as methanol and 1-butanol. Water and alcohols behaves differently during acid-treatment of bio-oil, leading to very different amount of coke formation. Carboxylic acids in bio-oil are the catalysts for the polymerisation of bio-oil.8 In alcohol-rich medium, the carboxylic acids are converted to neutral esters.21 In comparison, water cannot remove the carboxylic acids in bio-oil, but in converse promotes their formation.21 In addition to carboxylic acids, some other reactive compounds in bio-oil such as aldehydes can also be stabilized. C6 sugars and furans like HMF and furfuryl alcohol in bio-oil can be stabilized and finally converted to alkyl levulinate in alcohols rich medium.33 However, in water, sugars such as levoglucosan tended to polymerise to coke.33,34 The difference created the distinct tendency of coke formation during the acid-treatment of bio-oil in methanol and in water.
Coke formation in phenol
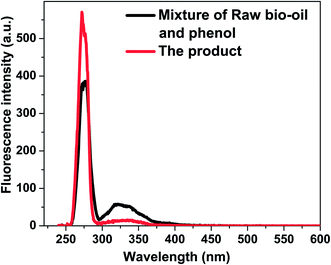
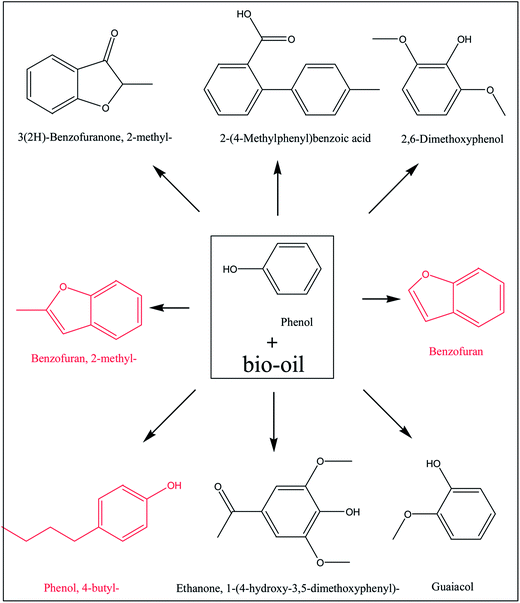
Similar to alcohols and water, phenol also contains a hydroxyl group. Phenol is more acidic than alcohols and water, and the polymerisation of bio-oil may be different in phenol. As shown in Table 1 the coke amount formed in phenol is 19.6%, which is relatively higher than that in methanol. This is because in phenol with Amberlyst 70 some of the aromatics with bigger aromatic rings were converted to coke by condensation reactions. As is shown in Fig. 5, the peak centred at 275 nm representing mono-benzene ring increased after the reaction, while the peak centred at 330 nm representing the aromatic ring systems having two or more fused benzene rings decreased.35 Phenol as one of the reactants contributed to the intensified peak centred at 280 nm. After the acid-treatment, although phenol was consumed, the intensity of the peak representing mono-rings increased, indicating some hydrolysis reactions happened, producing more products with single rings. The decrease of the intensity of peak ranging from 300 to 375 nm elucidate the condensation and polymerisation reactions occurred. In addition, according to GC-MS analysis, some new aromatics are detected in the product, while the abundance of others increased significantly after the acid-treatment of bio-oil in phenol, as is shown in Fig. 6. It is believed that phenol reacted with the components in bio-oil, forming these bigger aromatics and more coke.Effects of reaction temperature on coke formation
Reaction temperature significantly affects the formation of coke during esterification. As expected, coke yield increased with the increase of reaction temperature. It is noteworthy to mention that even at room temperature, a small amount of coke was formed, mechanism of which has not been cleared but there are two possible reasons. Firstly, small particles such as char produced from the pyrolysis of biomass might deposit on the catalyst. Secondly, bio-oil from the fast pyrolysis of biomass was not a very stable mixture of organics. Some components in bio-oil may be already reactive enough in the presence of acid catalyst at room temperature to condense.The coke yield at 90 °C only increased by 0.3% when compared with the coke yield at room temperature, which means the coke formation at 90 °C may followed similar mechanism with that at room temperature. The majority of components in bio-oil such as levoglucosan have not yet started their reactions at such a low temperature. When the reaction temperature was increased to 130 and 170 °C, much more coke was formed. Clearly, the components in bio-oil became reactive and participated in the condensation reactions at elevated temperatures. These are also in a good agreement with characterisation of the products with UV fluorescence.
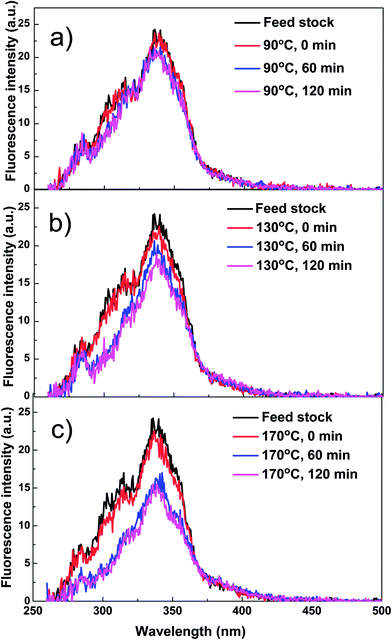
As is shown in Fig. 7, at 90 °C, the fluorescence intensity of the bio-oil/methanol mixture did not show any clear decreases with reaction time, while at elevated reaction temperature of 130 and 170 °C they decreased significantly, indicating serious coke formation. However, due to the complexity of bio-oil, it is difficult to identify the source or precursors for coke formation. Thus, special attention was paid to some typical compounds to gain some better understanding about the formation of coke.
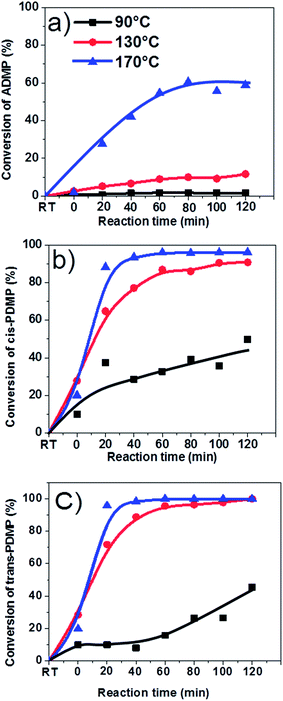
As is shown in Fig. 8, aromatics can be very reactive at elevated temperatures (i.e. 170 °C) but they have different reactivity due to their different molecular structures. trans-4-Propenyl-2,6-dimethoxyphenol and cis-4-propenyl-2,6-dimethoxypheno with big conjugated π bonds were more reactive than 4-allyl-2,6-dimethoxyphenol, resulting in almost 95% of conversion at 130 and 170 °C. Apparently, the functional groups could significantly affect reactivity. However, it is difficult to identify all their corresponding products. Possibly, the products were heavy polymers which cannot be detected with GC-MS.
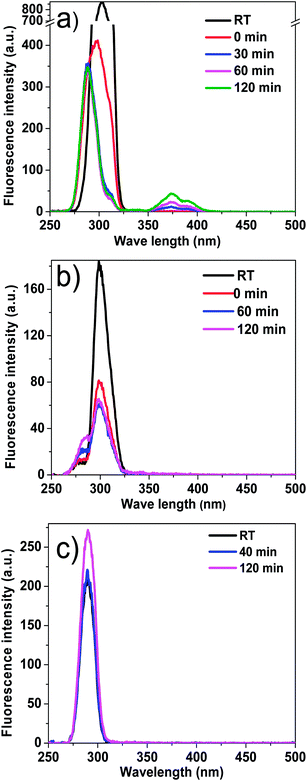
In order to understand the reactivities of aromatics in bio-oil with different structures during esterification with methanol, three typical aromatics in bio-oil, isoeugenol, 2,6-dimethoxyphenol and 1,2,4-trimethoxyphenol, were chosen for model compound experiments. The UV-fluorescence results of isoeugenol showed that some soluble polymer was formed, as is shown in Fig. 9. Two broad peaks were obtained, centred at 280 and 375 nm, respectively. The peak centred at 280 nm represented compounds with mono-benzene ring, which was the reactant here. The peak centred at 375 nm represented compounds with around three fused benzene rings,34 which were the products. The fluorescence intensity of reactant decreased and meanwhile fluorescence intensity of products increased with prolonged reaction time, indicating the polymerisation of isoeugenol. However, the soluble polymer cannot be identified with UV-fluorescence in the model compounds experiments of 2,6-dimethoxyphenol and 1,2,4-trimethoxyphenol. This indicates that these two compounds without C![[double bond, length as m-dash]](https://www.rsc.org/images/entities/char_e001.gif) C bonds in their side chain are more stable.
C bonds in their side chain are more stable.
Effects of catalyst loadings and reaction time on coke formation
Catalyst loading can also affect the coke formation but not much. With the increase of catalyst loading from 10 to 15%, coke yield almost unchanged (14.8%). However, with low catalyst loading of 5%, coke yield is only 10.4%. Obviously, the amount of coke formed is related to the amount of acidic sites available to the reactants. Amberlyst 70 is a solid acid resin catalyst, and most of active sites (hydrogen ions) are located deep in the polymeric structure of catalyst.36 Easy access to the hydrogen ions promoted the acid-catalysed reactions including polymerisation reactions. The higher the loading of catalyst, the higher chance they polymerised.Residence time also significantly affect coke formation. The coke yield in the experiment with only 30 min of residence time was 11.5%, which is close to that in the experiment with 120 min residence time (15.4%). This indicates that the majority of coke formation has already occurred in the first 30 min. The polymerisation of the reactive compounds proceeds very quick, which can deactivate the solid acid catalysts and affect the conversion of other components. In addition, it was noteworthy to mention that the prolonged reaction from 120 to 360 min only increased the yield of coke by 0.8%. From 120 to 360 min, the components of bio-oil remain almost unchanged and bio-oil was stabilised under these conditions.
Characterization of coke by FT-IR spectroscopy
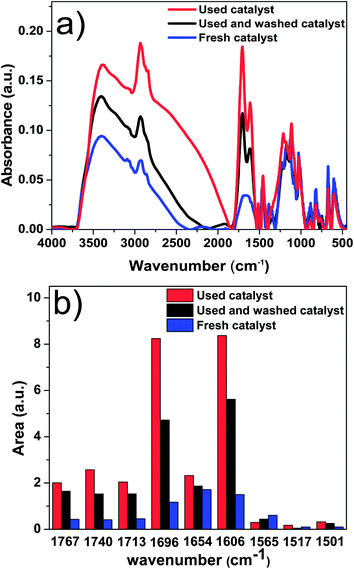
In order to understand property of the coke formed, the fresh catalyst and used catalyst were characterised with FT-IR. The results are shown in Fig. 10a. Fig. 10b was the corresponding deconvolution results of Fig. 10a. Each band was obtained by following the method developed in our previous study.37 The peak centred at 1606 cm−1 refers to C![[double bond, length as m-dash]](https://www.rsc.org/images/entities/char_e001.gif) C bond in aromatic ring, and the peak centred at 1696 cm−1 refers to C
C bond in aromatic ring, and the peak centred at 1696 cm−1 refers to C![[double bond, length as m-dash]](https://www.rsc.org/images/entities/char_e001.gif) O bond of unsaturated aldehydes and ketones. Compared with that of the fresh catalyst, the intensity of peaks at 1606 and 1696 cm−1 increased significantly for the used catalyst. This indicates that the coke on catalyst was primarily comprised of big aromatics and unsaturated aldehydes and ketones.
O bond of unsaturated aldehydes and ketones. Compared with that of the fresh catalyst, the intensity of peaks at 1606 and 1696 cm−1 increased significantly for the used catalyst. This indicates that the coke on catalyst was primarily comprised of big aromatics and unsaturated aldehydes and ketones.
The abundance of the big aromatics, unsaturated aldehydes and ketones in the unwashed catalyst is higher than that of washed one, indicating that the main components of the soluble polymeric material in bio-oil were also big aromatics and unsaturated aldehydes and ketones. The big aromatics and unsaturated aldehydes and ketones are likely the precursors for coke formation.
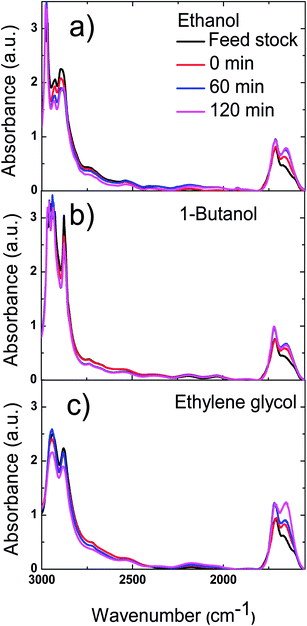
The polymerisation was accompanied by the dehydration of the reactive components in bio-oil to form carbon double bonds, which was proved by FT-IR results of bio-oil. As are shown in Fig. 11, the two peaks between 3000 and 2800 cm−1, which represent the stretching vibrations of C–H bond in alkanes, decreased with reaction time. Meanwhile, the peaks centred at 1720 and 1650 cm−1, which represent stretching vibration of C![[double bond, length as m-dash]](https://www.rsc.org/images/entities/char_e001.gif) O double bond and C
O double bond and C![[double bond, length as m-dash]](https://www.rsc.org/images/entities/char_e001.gif) C bond respectively, increased with reaction time. These two phenomena prove that more unsaturated compounds with these functional groups were formed during the esterification of bio-oil with methanol.
C bond respectively, increased with reaction time. These two phenomena prove that more unsaturated compounds with these functional groups were formed during the esterification of bio-oil with methanol.
The characterisation of soluble polymer by UV-fluorescence spectroscopy
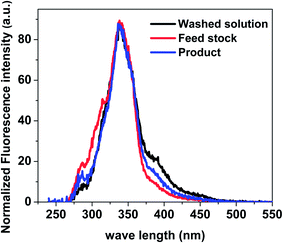
Soluble polymeric material is considered to be largely the precursor of insoluble polymeric material. Methanol/chloroform at the volume ratio of 1![[thin space (1/6-em)]](https://www.rsc.org/images/entities/char_2009.gif) :
:![[thin space (1/6-em)]](https://www.rsc.org/images/entities/char_2009.gif) 4 was used to wash the used catalyst. The fluorescence spectra of the washed solution from catalyst, raw feed stock solution and liquid product were shown in Fig. 12. The ratio of aromatics with two fused benzene rings to mono aromatic ring for liquid product is higher than that in feed stock solution. The ratio of the aromatics with three more fused benzene rings to the aromatics with two fused benzene rings for wash solution from catalyst is higher than those for liquid product and feed stock solution. These clearly indicate that there are more big aromatic rings in the wash solution from catalyst than that in feed stock solution and liquid product solution. This is the direct evidence about the important contribution of the aromatics to coke formation during esterification.
4 was used to wash the used catalyst. The fluorescence spectra of the washed solution from catalyst, raw feed stock solution and liquid product were shown in Fig. 12. The ratio of aromatics with two fused benzene rings to mono aromatic ring for liquid product is higher than that in feed stock solution. The ratio of the aromatics with three more fused benzene rings to the aromatics with two fused benzene rings for wash solution from catalyst is higher than those for liquid product and feed stock solution. These clearly indicate that there are more big aromatic rings in the wash solution from catalyst than that in feed stock solution and liquid product solution. This is the direct evidence about the important contribution of the aromatics to coke formation during esterification.
Conclusions
This study reported the effects of alcohol, water, reaction temperature and catalyst loading on coke formation during the esterification of bio-oil. Coke yields during esterification in the mono-alcohols (methanol ethanol, 1-propanol and 1-butanol) were similar, which were independent of the size of alcohols. A higher coke yield was obtained in ethylene glycol due to its multiple hydroxyl groups. The coke yield in water is much higher than those in alcohols. Alcohols can stabilise the reactive components of bio-oil such as carboxylic acids, aldehydes and sugar oligomers, while water promotes the polymerisation of bio-oil. Phenol as a typical phenolic compound also boosted the coke formation of bio-oil. Small mono-rings were produced and meanwhile, the aromatics with fused benzene rings were consumed. Higher reaction temperatures, longer residence time and higher catalyst loading also favour the polymerisation of bio-oil. FT-IR characterizations of soluble polymeric material and insoluble polymeric material showed that aromatics were the dominant components in these two kinds of polymeric materials. The UV-fluorescence results indicated that small aromatics in bio-oil underwent polymerisation to form big fused aromatics.Acknowledgements
Australian Government funding through the Second Generation Biofuels Research and Development Grant Program supports this project. The study also received support from the Government of Western Australia via the Centre for Research into Energy for Sustainable Transport (CREST). This project is also partly supported by the Commonwealth of Australia under the Australia-China Science and Research Fund.References
- D. Chiaramonti, A. Oasmaa and Y. Solantausta, Renewable Sustainable Energy Rev., 2007, 11, 1056–1086 CrossRef CAS.
- D. Mohan, C. U. Pittman Jr and P. H. Steele, Energy Fuels, 2006, 20, 848–889 CrossRef CAS.
- W. Marquardt, A. Harwardt, M. Hechinger, K. Kraemer, J. Viell and A. Voll, AIChE J., 2010, 56, 2228–2235 CAS.
- X. Hu, C. Lievens and C.-Z. Li, ChemSusChem, 2012, 5, 1427–1434 CrossRef CAS PubMed.
- S. Czernik and A. V. Bridgwater, Energy Fuels, 2004, 18, 590–598 CrossRef CAS.
- A. Sanna, K. Ogbuneke and J. M. Andrésen, Fuel, 2009, 88, 2340–2347 CrossRef CAS.
- R. P. B. Ramachandran, G. Rossum, W. P. M. Swaaij and S. R. A. Kersten, Environ. Prog. Sustainable Energy, 2009, 28, 410–417 CrossRef CAS.
- X. Hu, Y. Wang, D. Mourant, R. Gunawan, C. Lievens, W. Chaiwat, M. Gholizadeh, L. Wu, X. Li and C.-Z. Li, AIChE J., 2013, 59, 888–900 CrossRef CAS.
- D. C. Elliott, Energy Fuels, 2007, 21, 1792–1815 CrossRef CAS.
- Y. Wang, D. Mourant, X. Hu, S. Zhang, C. Lievens and C.-Z. Li, Fuel, 2013, 108, 439–444 CrossRef CAS.
- Z. Wang, Y. Pan, T. Dong, X. Zhu, T. Kan, L. Yuan, Y. Torimoto, M. Sadakata and Q. Li, Appl. Catal., A, 2007, 320, 24–34 CrossRef CAS.
- E. Fratini, M. Bonini, A. Oasmaa, Y. Solantausta, J. Teixeira and P. Baglioni, Langmuir, 2006, 22, 306–312 CrossRef CAS PubMed.
- S. Czernik, D. K. Johnson and S. Black, Biomass Bioenergy, 1994, 7, 187–192 CrossRef CAS.
- Q. Lu, X. Yang and X. Zhu, J. Anal. Appl. Pyrolysis, 2008, 82, 191–198 CrossRef CAS.
- X. Hu, R. Gunawan, D. Mourant, C. Lievens, X. Li, S. Zhang, W. Chaiwat and C.-Z. Li, Fuel, 2012, 97, 512–522 CrossRef CAS.
- E. Ahmad, M. I. Alam, K. K. Pant and M. A. Haider, Green Chem., 2016 10.1039/c6gc01523a.
- J. Fu, L. Chen, P. Lv, L. Yang and Z. Yuan, Fuel, 2015, 154, 1–8 CrossRef CAS.
- M. I. Alam, S. De, S. Dutta and B. Saha, RSC Adv., 2012, 2, 6890–6896 RSC.
- M. I. Alam, S. De, B. Singh and B. Saha, Appl. Catal., A, 2014, 486, 42–48 CrossRef CAS.
- M. Milina, S. Mitchell and J. Pérez-Ramírez, Catal. Today, 2014, 235, 176–183 CrossRef CAS.
- W. Li, C. Pan, L. Sheng, Z. Liu, P. Chen, H. Lou and X. Zheng, Bioresour. Technol., 2011, 102, 9223–9228 CrossRef CAS PubMed.
- X. Li, R. Gunawan, C. Lievens, Y. Wang, D. Mourant, S. Wang, H. Wu, M. Garcia-Perez and C.-Z. Li, Fuel, 2011, 90, 2530–2537 CrossRef CAS.
- S. Miao and B. H. Shanks, Appl. Catal., A, 2009, 359, 113–120 CrossRef CAS.
- J. Peng, P. Chen, H. Lou and X. Zheng, Bioresour. Technol., 2010, 100, 3415–3418 CrossRef PubMed.
- X. Hu, D. Mourant, Y. Wang, L. Wu, W. Chaiwat, R. Gunawan, M. Gholizadeh, C. Lievens, M. Garcia-Perez and C.-Z. Li, Fuel Process. Technol., 2013, 106, 569–576 CrossRef CAS.
- X. Hu, C. Lievens, D. Mourant, Y. Wang, L. Wu, R. Gunawan, Y. Song and C.-Z. Li, Appl. Energy, 2013, 111, 94–103 CrossRef CAS.
- M. Garcia-Perez, S. Wang, J. Shen, M. Rhodes, W. J. Lee and C.-Z. Li, Energy Fuels, 2008, 22, 2022–2032 CrossRef CAS.
- D. Mourant, Z. Wang, M. He, X. S. Wang, M. Garcia-Perez and K. Ling, et al. , Fuel, 2011, 90, 2915–2922 CrossRef CAS.
- http://www.autoclaveengineers.com/ae_pdfs/2D_drawings/EZE-SEAL/Hastelloy/40A-8681.pdf .
- C.-Z. Li, F. Wu, H.-Y. Cai and R. Kandiyoti, Energy Fuels, 1994, 8, 1039–1048 CrossRef CAS.
- G. V. C. Peacocke, E. S. Madrali, C.-Z. Li, A. J. Guell, F. Wu, R. Kandiyoti and A. V. Bridgwater, Biomass Bioenergy, 1994, 7, 155–167 CrossRef CAS.
- C. Zeng, G. Favas, H. Wu, A. L. Chaffee, J. Hayashi and C.-Z. Li, Energy Fuels, 2006, 20, 281–286 CrossRef CAS.
- X. Hu, L. Wu, Y. Wang, D. Mourant, C. Lievens, R. Gunawan and C.-Z. Li, Green Chem., 2012, 14, 3087–3098 RSC.
- X. Hu, C. Lievens, A. Larcher and C.-Z. Li, Bioresour. Technol., 2011, 102, 10104–10113 CrossRef CAS PubMed.
- Y. Wang, X. Hu, Y. Song, Z. Min, D. Mount, T. Li, R. Gunawan and C.-Z. Li, Fuel Process. Technol., 2013, 116, 234–240 CrossRef CAS.
- B. Corain, M. Zecca and K. Jerabek, J. Mol. Catal. A: Chem., 2001, 177, 3–20 CrossRef CAS.
- C. Lievens, D. Mourant, M. He, R. Gunawan, X. Li and C.-Z. Li, Fuel, 2011, 90, 3417–3423 CrossRef CAS.
| This journal is © The Royal Society of Chemistry 2016 |

